
Matplotlib绘图9种经典风格,你喜欢哪种?
Matplotlib作为高度定制化的绘图工具,它能让使用者很轻松地将数据图形化,并且提供多样化的输出格式。
只要你使用Python编程便可完美绘制二维统计图表、三维图表、动态图表、交互图表,甚至可以编辑图片,修改各种元素。📊
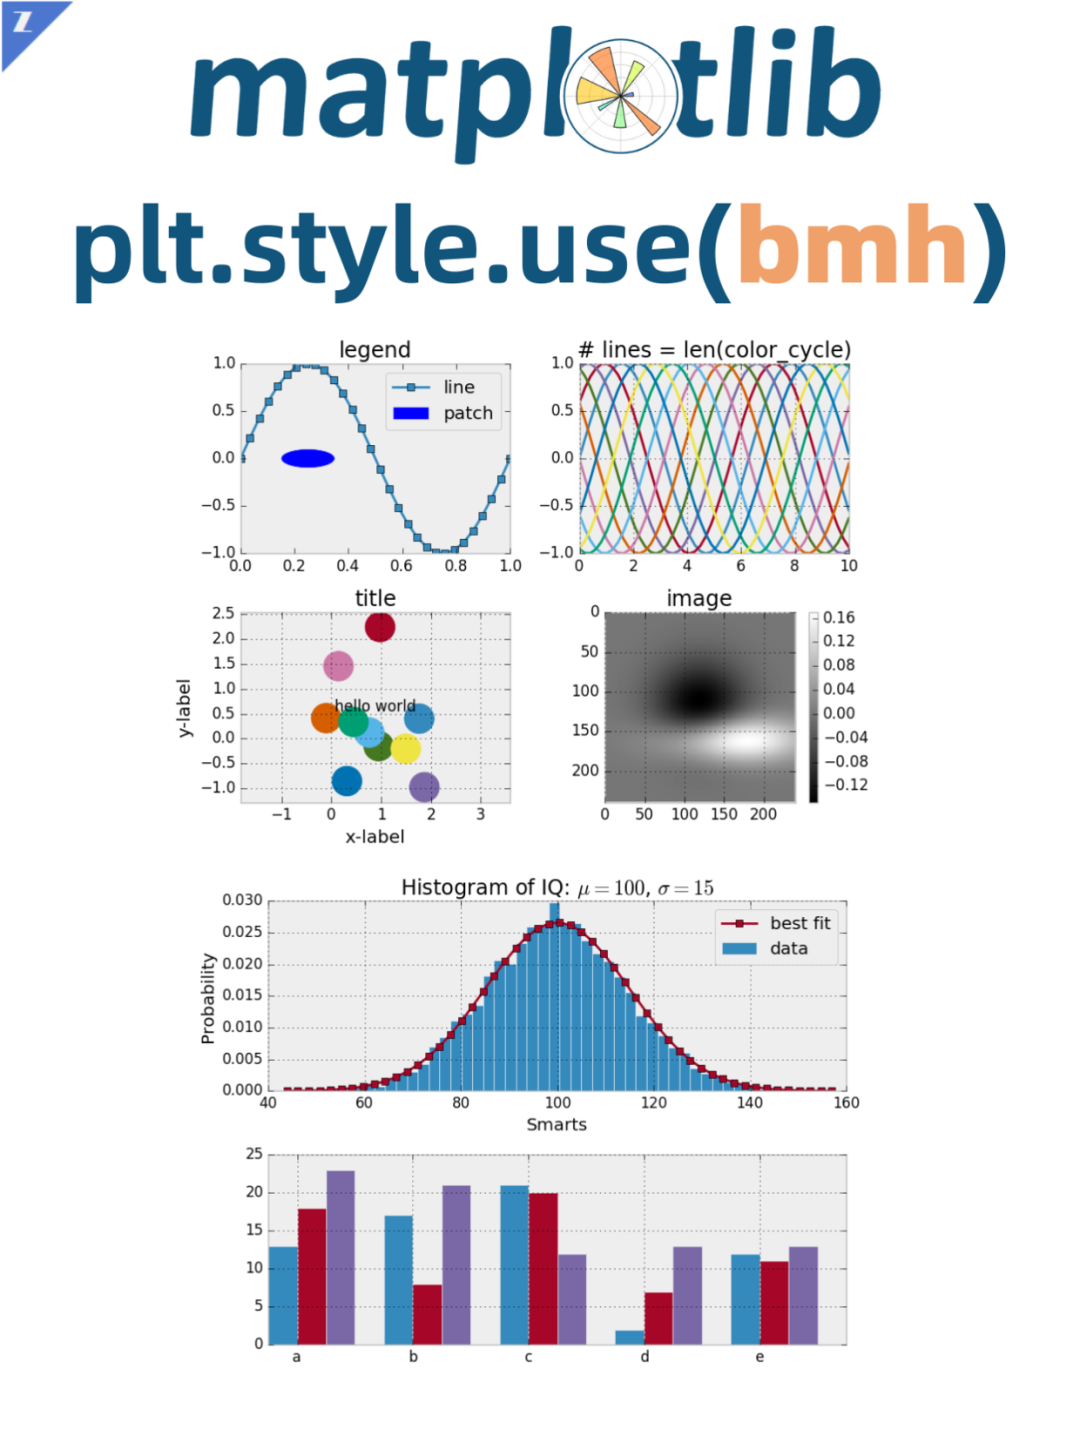
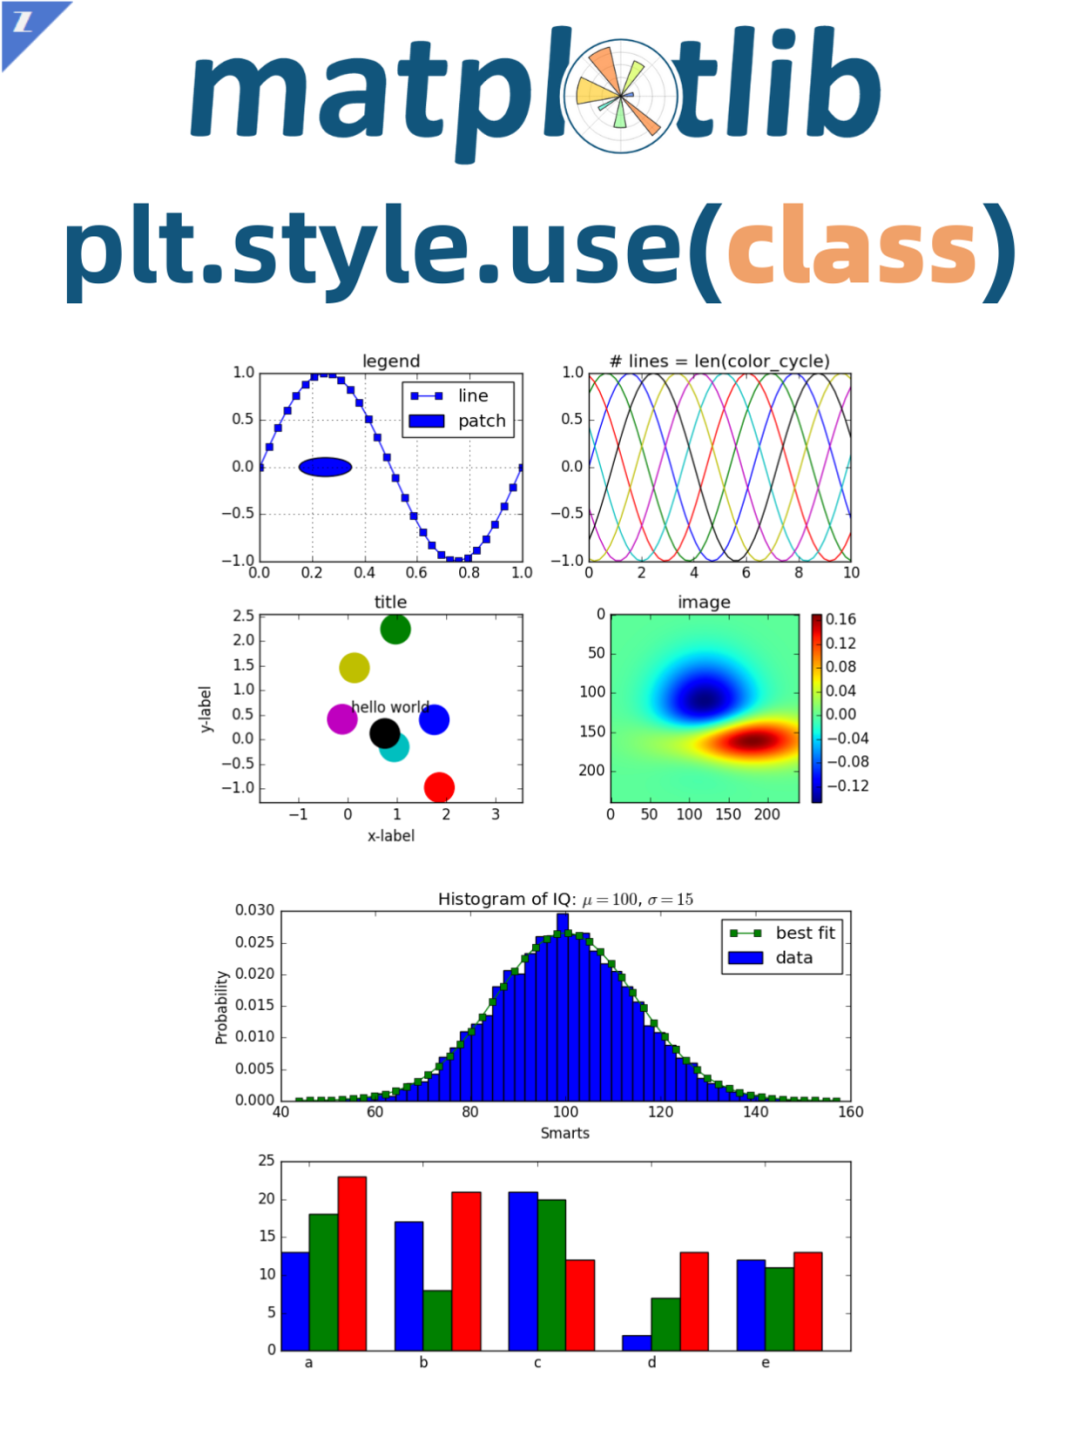
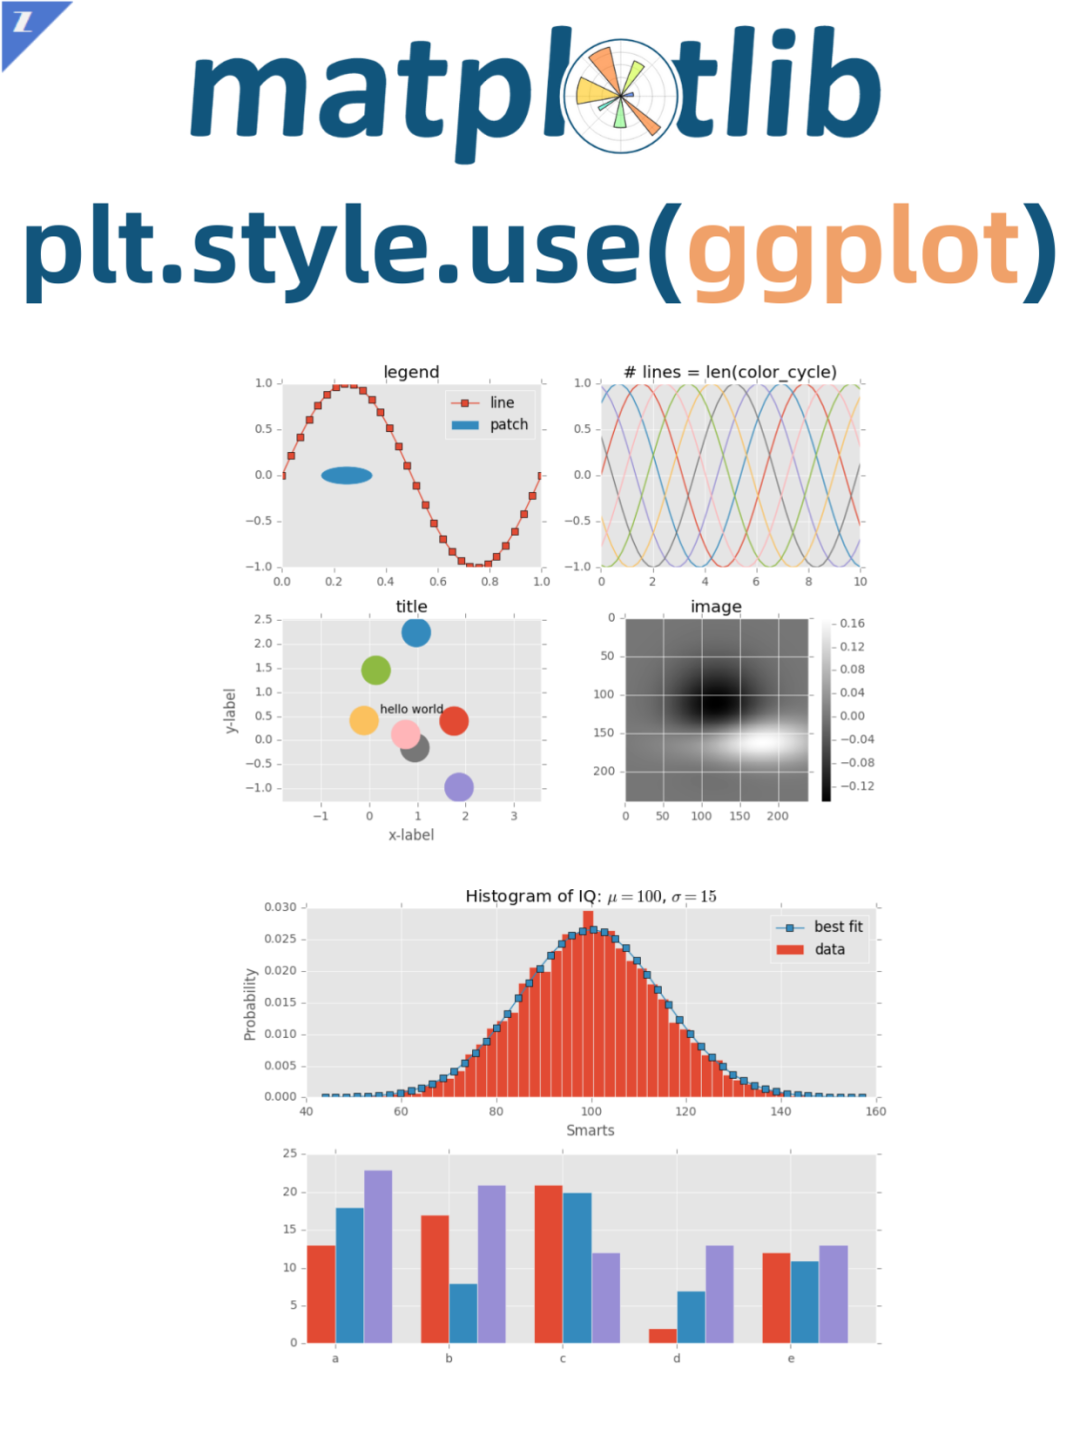
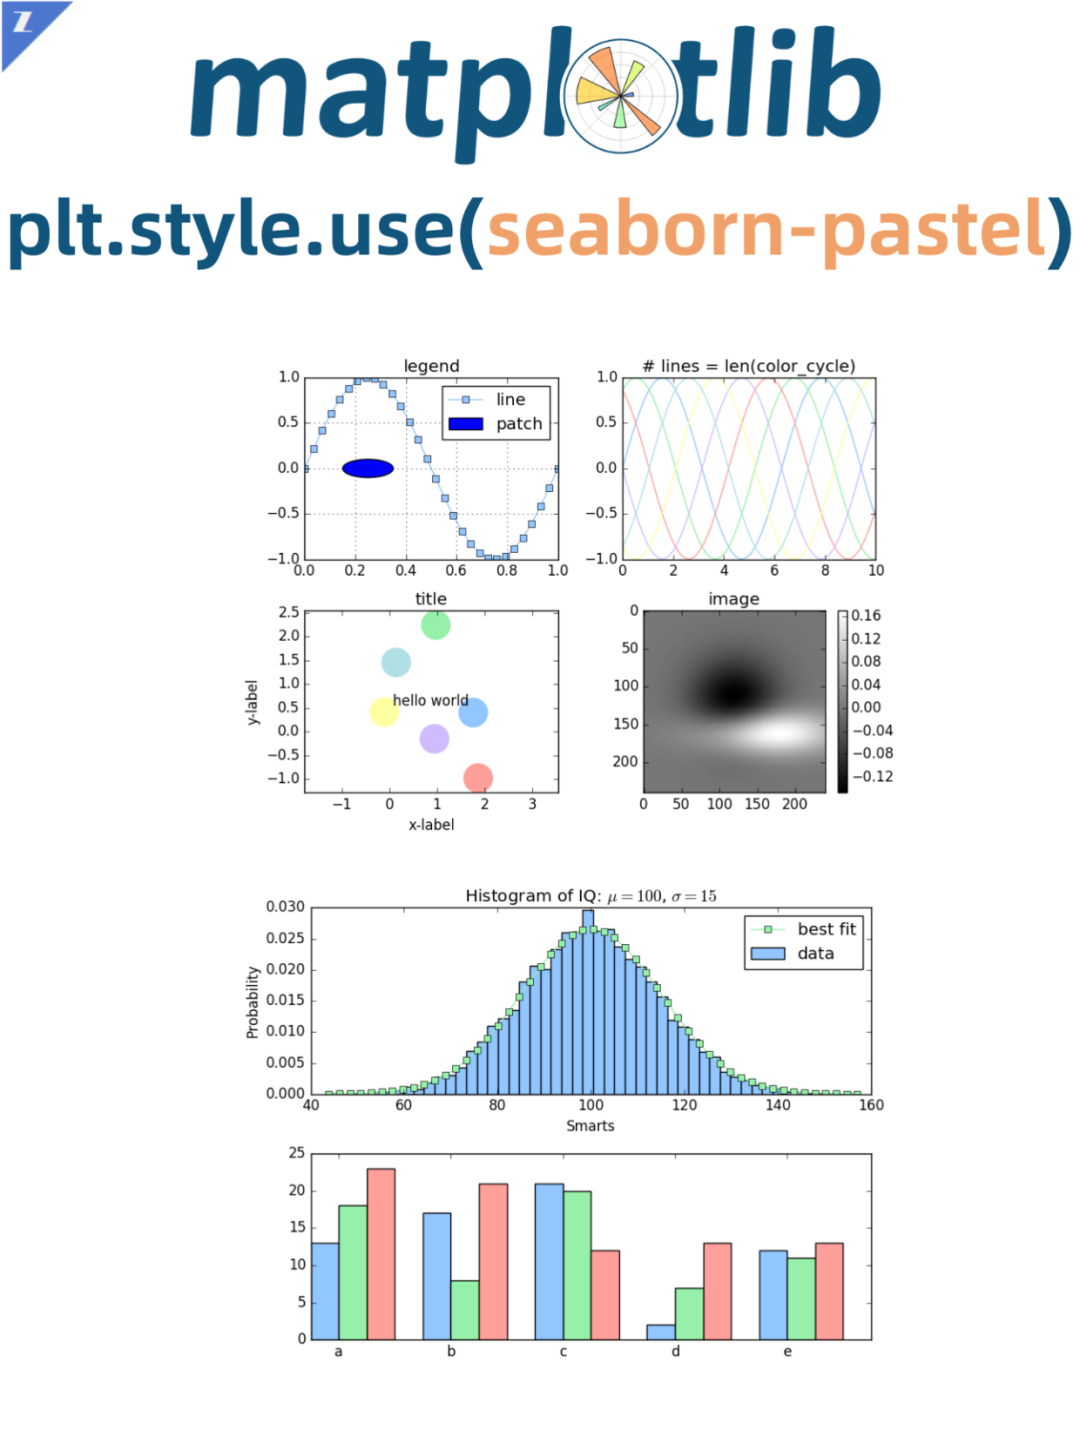
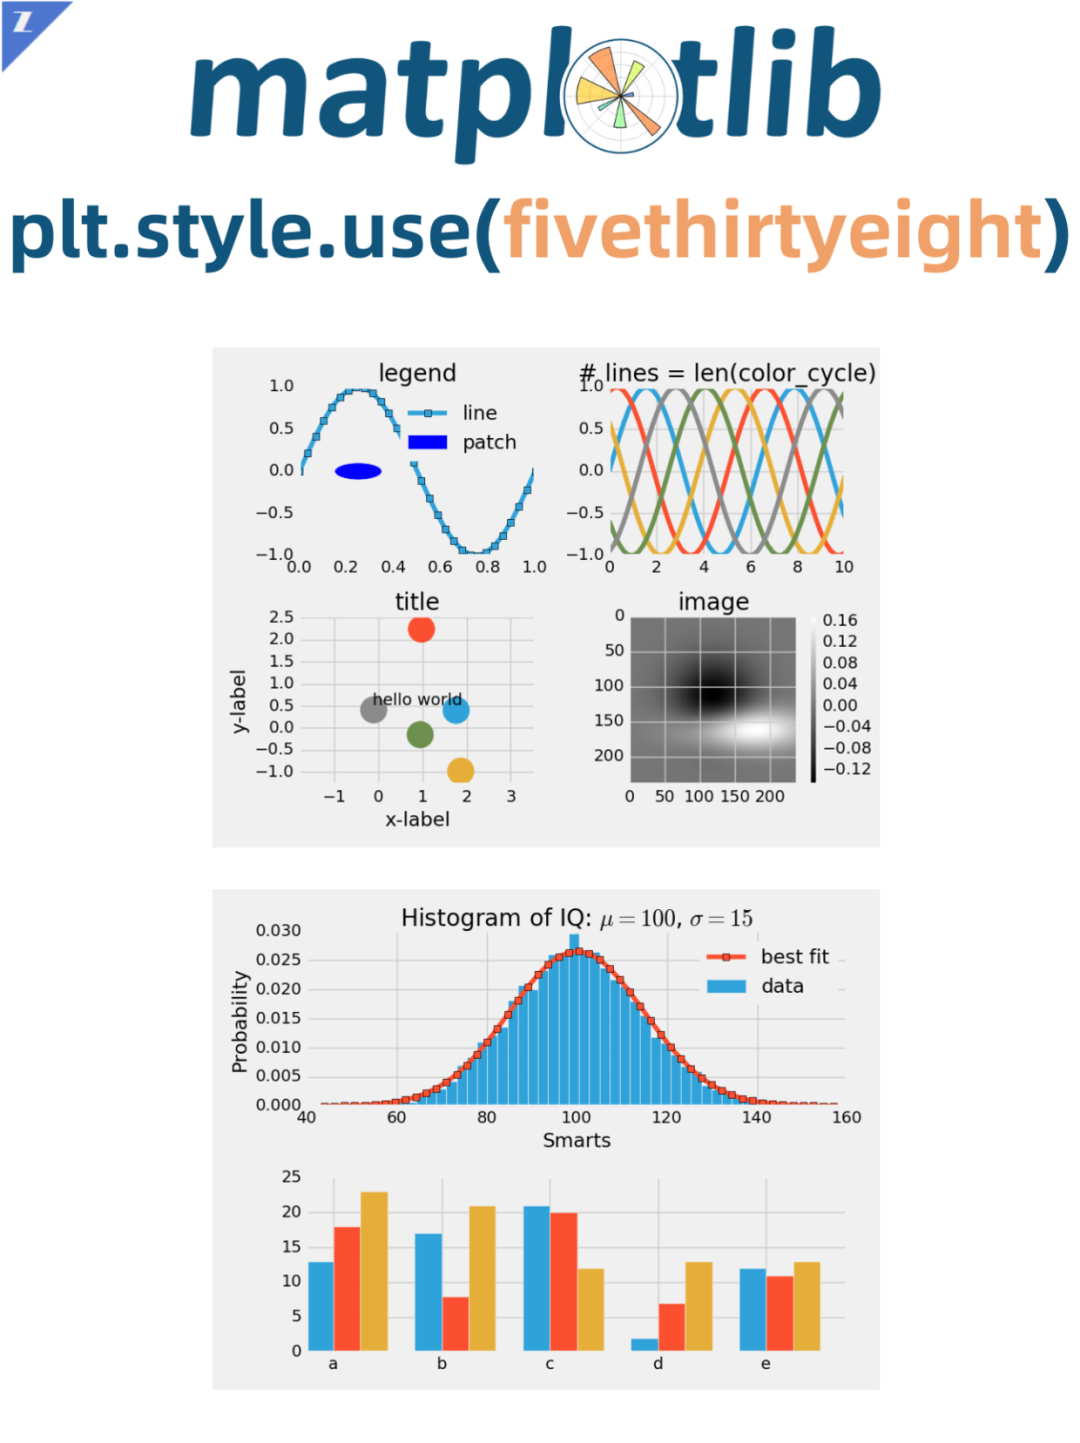
刚接触Matplotlib的小伙伴可能无法绘制出好看的图,这里建议使用内置的style风格,只需要一行代码便可以让图表变得好看。🤩
Matplotlib提供了几十种图表样式,满足了不同场景和需求,比如论文用图、会议用图、报告用图等。
我这里选了9种比较喜欢的分享出来,希望能帮助到需要的小伙伴。
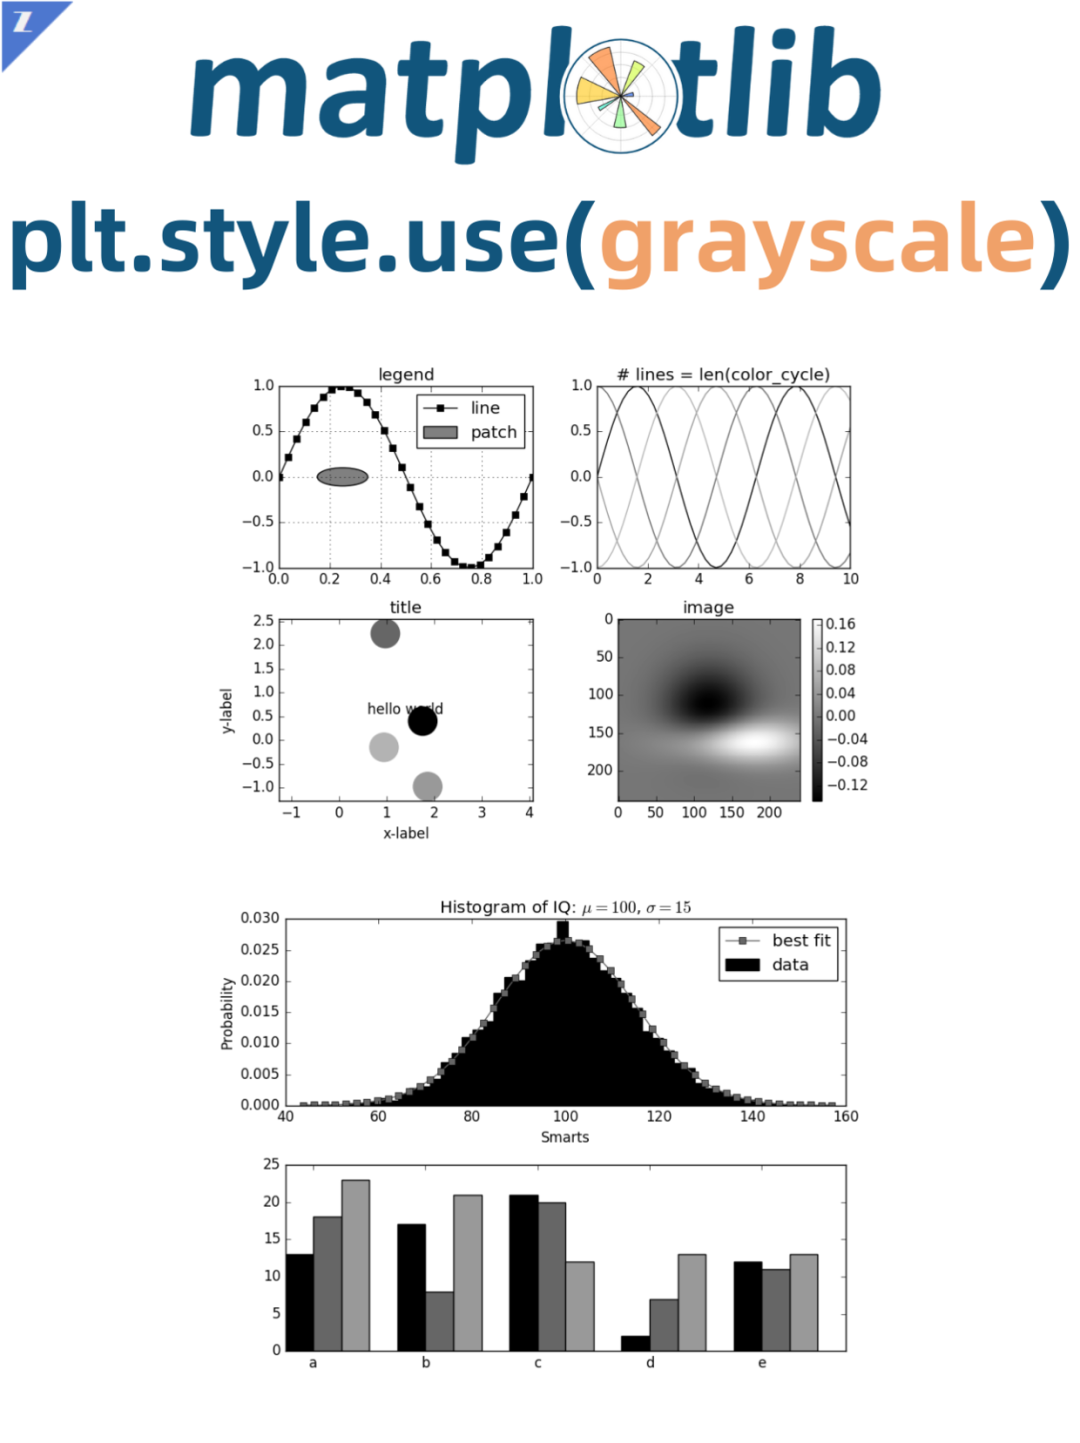
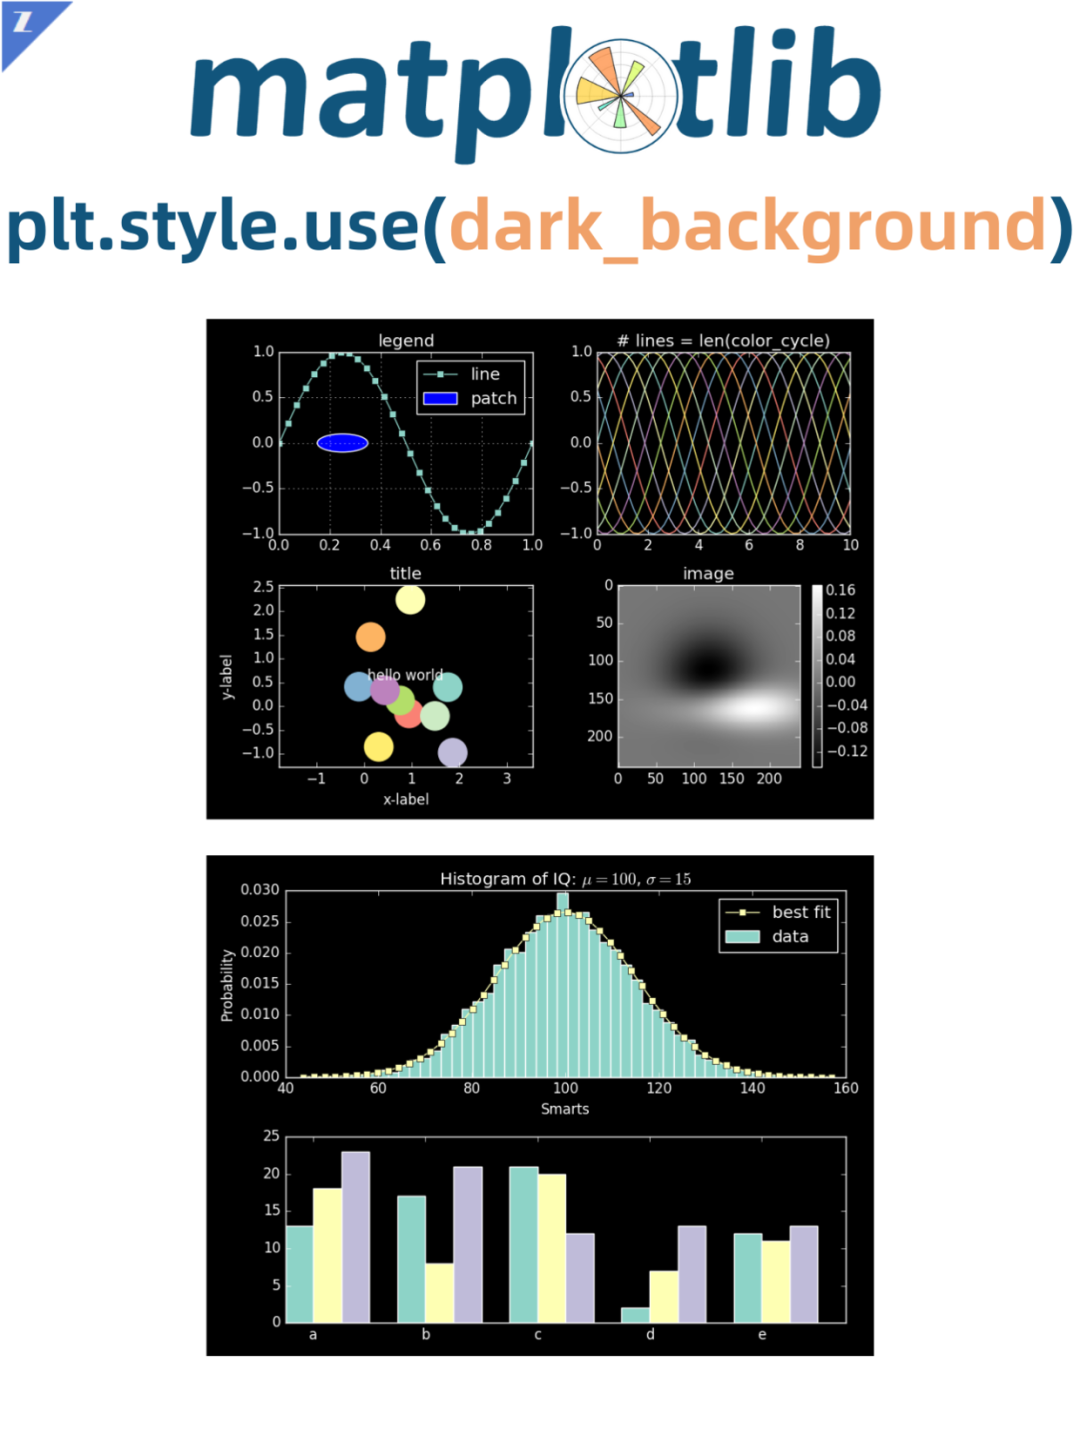
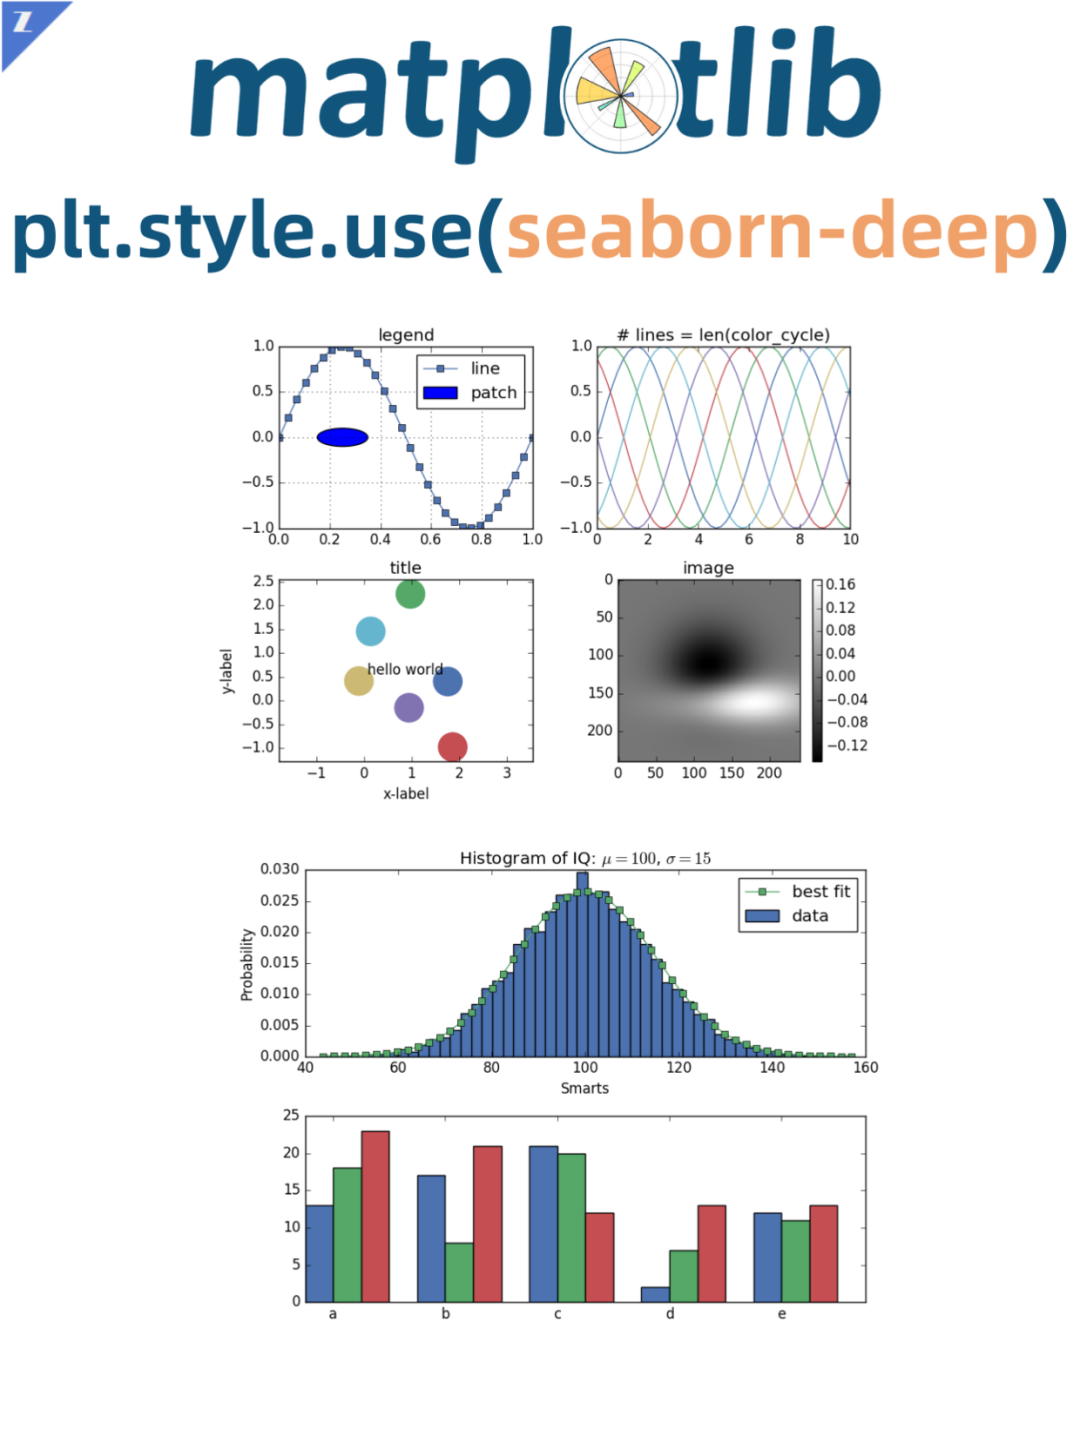
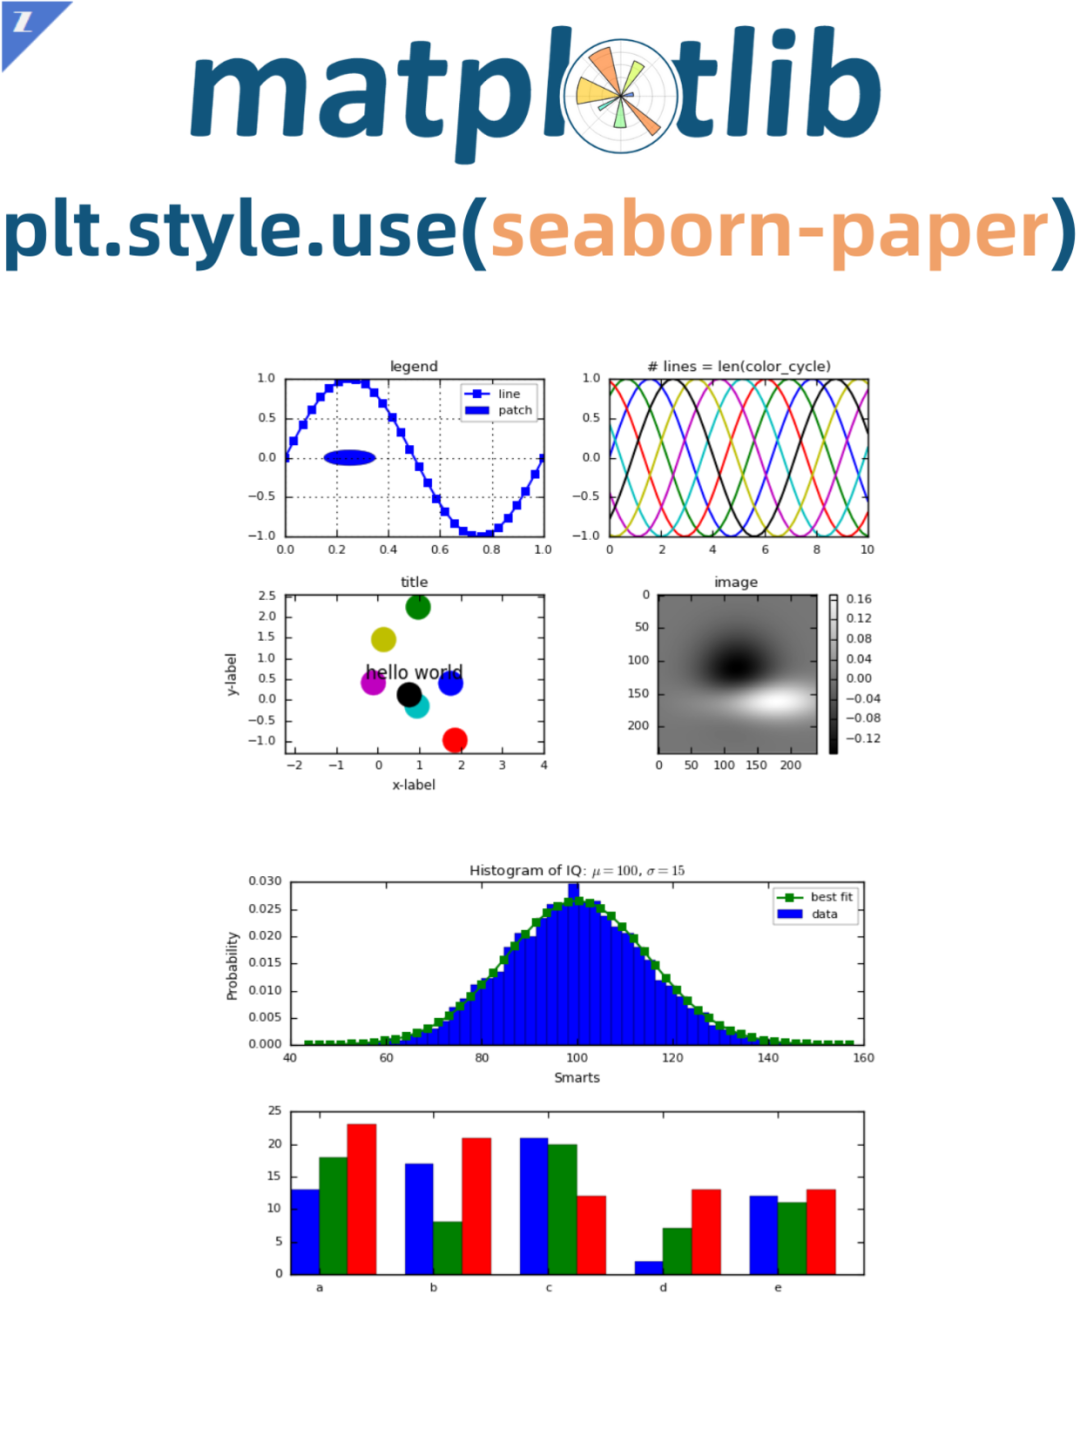
style使用方式:👇👇👇
plt.style.use(style_name)
查看有哪些style:👇👇👇
plt.style.available
END
推荐阅读
吴恩达deeplearining.ai的经典总结资料
Ps:从小程序直接获取下载
评论