硬核教程,利用 Python 搞定精美网络图!

一、NetworkX 概述
PS:本文所使用的数据源以及代码文件,可以在文末获取
二、NetworkX 的安装
pip install networkx -i http://pypi.douban.com/simple --trusted-host pypi.douban.com
三、NetworkX 基础知识
1. 创建图
import network as nx
G = nx.Graph()
G = nx.DiGraph()
G = nx.MultiGraph()
G = nx.MultiDiGraph()
2. 网络图的加点和加边
import networkx as nx
import matplotlib.pyplot as plt
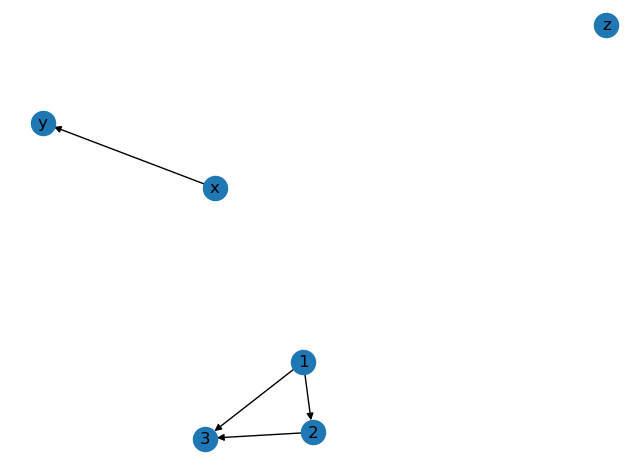
G = nx.DiGraph()
G.add_node('z') # 添加节点z
G.add_nodes_from([1, 2, 3]) # 添加节点 1 2 3
G.add_edge('x', 'y') # 添加边 起点为x 终点为y
G.add_edges_from([(1, 2), (1, 3), (2, 3)]) # 添加多条边
# 网络图绘制与显示
nx.draw(G, with_labels=True)
plt.show()
nx.draw() 方法里的参数
nx.draw(G, pos=nx.random_layout(G), node_color = 'b', edge_color = 'r', with_labels = True, font_size =18, node_size =20)
G:待绘制的网络图G
node_size:指定节点的尺寸大小(默认是300)
node_color: 指定节点的颜色 (可以用字符串简单标识颜色,例如'r'为红色,'g'为绿色这样)
node_shape: 节点的形状(默认是圆形,用字符串'o'标识)
alpha: 透明度 (默认是1.0,不透明,0为完全透明)
width: 边的宽度 (默认为1.0)
edge_color: 边的颜色(默认为黑色)
style: 边的样式(默认为实现,可选: solid | dashed | dotted | dashdot
with_labels:节点是否带标签
font_size: 节点标签字体大小
font_color: 节点标签字体颜色(默认为黑色)
3. 运用布局
import networkx as nx
import matplotlib.pyplot as plt
# 初始化一个有向图对象
DG = nx.DiGraph()
DG.add_node('X')
# 添加节点 传入列表
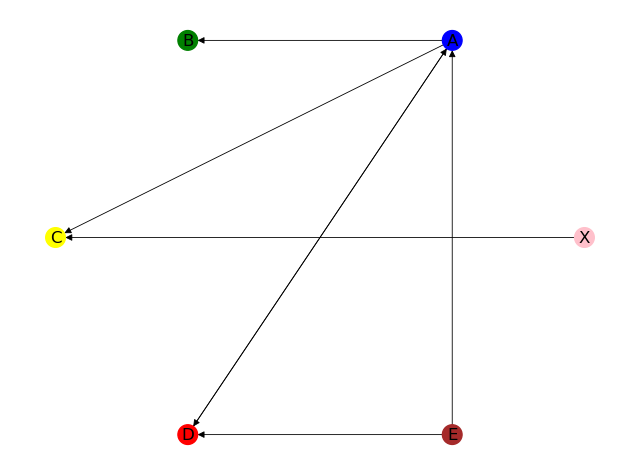
DG.add_nodes_from(['A', 'B', 'C', 'D', 'E'])
print(f'输出图的全部节点:{DG.nodes}')
print(f'输出节点的数量:{DG.number_of_nodes()}')
# 添加边 传入列表 列表里每个元素是一个元组 元组里表示一个点指向另一个点的边
DG.add_edges_from([('A', 'B'), ('A', 'C'), ('A', 'D'), ('D', 'A'), ('E', 'A'), ('E', 'D')])
DG.add_edge('X', 'C')
print(f'输出图的全部边:{DG.edges}')
print(f'输出边的数量:{DG.number_of_edges()}')
# 可自定义节点颜色
colors = ['pink', 'blue', 'green', 'yellow', 'red', 'brown']
# 运用布局
pos = nx.circular_layout(DG)
# 绘制网络图
nx.draw(DG, pos=pos, with_labels=True, node_size=200, width=0.6, node_color=colors)
# 展示图片
plt.show()
输出图的全部节点:['X', 'A', 'B', 'C', 'D', 'E']
输出节点的数量:6
输出图的全部边:[('X', 'C'), ('A', 'B'), ('A', 'C'), ('A', 'D'), ('D', 'A'), ('E', 'A'), ('E', 'D')]
输出边的数量:7
四、利用 NetworkX 实现关联类分析
1. 提取数据
import pandas as pd
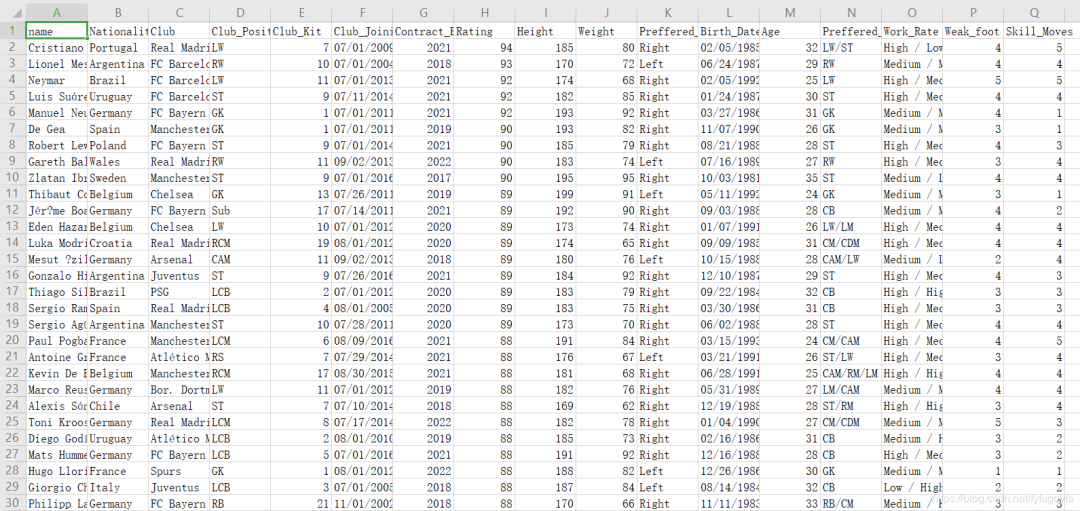
df = pd.read_csv('soccer.csv', encoding='gbk')
data = df['Club'].value_counts()
# 球员人数最多的5个俱乐部
clubs = list(data.index[:5])
# 球员数量最多的俱乐部抽取30名
df1 = df[df['Club'] == clubs[0]].sample(30, axis=0)
# 剩下4个俱乐部各抽取5名
df2 = df[df['Club'] == clubs[1]].sample(5, axis=0)
df3 = df[df['Club'] == clubs[2]].sample(5, axis=0)
df4 = df[df['Club'] == clubs[3]].sample(5, axis=0)
df5 = df[df['Club'] == clubs[4]].sample(5, axis=0)
# 合并多个DataFrame
result = pd.concat([df1, df2, df3, df4, df5], axis=0, ignore_index=True)
# 打乱DataFrame顺序
new_result = result.sample(frac=1).reset_index(drop=True)
# new_result.info()
# 抽样的数据保存到excel
new_result.to_excel('samples.xlsx')
import pandas as pd
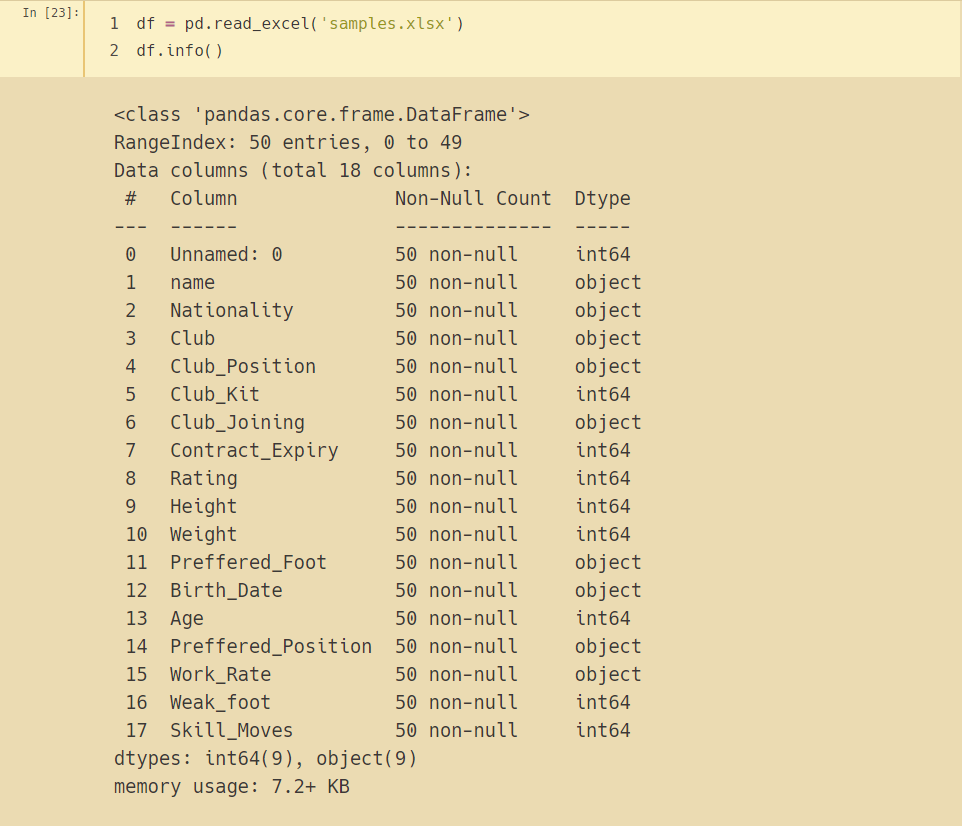
df = pd.read_excel('samples.xlsx')
df.info()
2. 画网络图
import pandas as pd
df = pd.read_excel('samples.xlsx')
df = df.loc[::, ['Name', 'Club']]
print(df['Club'].value_counts())
datas = df.values.tolist()
name = [datas[i][0] for i in range(len(datas))]
nodes = [str(i) for i in range(len(datas))]
club = [datas[i][1] for i in range(len(datas))]
# print(nodes)
df = pd.DataFrame({'姓名': name, '节点编号': nodes, '所属俱乐部': club})
df.to_csv('nodes_info.csv')
with open('record.txt', 'w') as f:
for i in range(len(nodes)):
for j in range(i, len(nodes) - 1):
if datas[i][1] == datas[j+1][1]: # 属于同一俱乐部
f.write(f'{nodes[i]}-{nodes[j + 1]}-{datas[i][1]}'+ '\n')
(1) 随机分布网络图
import networkx as nx
import matplotlib.pyplot as plt
import pandas as pd
from collections importCounter
df = pd.read_csv('nodes_info.csv')['所属俱乐部']
items = df.values
print(Counter(items))
node_colors = []
# 5个俱乐部 属于同一个俱乐部的节点设置相同颜色
for item in items:
if item == 'Free Agents':
node_colors.append('red')
elif item == 'Real Madrid':
node_colors.append('yellow')
elif item == 'Chelsea':
node_colors.append('blue')
elif item == 'FC Barcelona':
node_colors.append('green')
elif item == 'Manchester Utd':
node_colors.append('pink')
DG = nx.MultiGraph()
DG.add_nodes_from([str(i) for i in range(0, 50)])
DG.nodes()
with open('record.txt', 'r') as f:
con = f.read().split('\n')
edges_list = []
for i in con[:-1]:
edges_list.append(tuple(i.split('-')[:2]))
print(edges_list)
DG.add_edges_from(edges_list)
# 运用布局
pos = nx.random_layout(DG) # 节点随机分布
# 绘制网络图
nx.draw(DG, pos, with_labels=True, node_size=200, width=0.6, node_color=node_colors)
# 显示图片
plt.show()

(2) Fruchterman-Reingold 算法排列节点网络图
import networkx as nx
import matplotlib.pyplot as plt
import pandas as pd
from collections importCounter
df = pd.read_csv('nodes_info.csv')['所属俱乐部']
items = df.values
print(Counter(items))
node_colors = []
# 5个俱乐部 属于同一个俱乐部的节点设置相同颜色
for item in items:
if item == 'Free Agents':
node_colors.append('red')
elif item == 'Real Madrid':
node_colors.append('yellow')
elif item == 'Chelsea':
node_colors.append('blue')
elif item == 'FC Barcelona':
node_colors.append('green')
elif item == 'Manchester Utd':
node_colors.append('pink')
DG = nx.MultiGraph()
DG.add_nodes_from([str(i) for i in range(0, 50)])
DG.nodes()
with open('record.txt', 'r') as f:
con = f.read().split('\n')
edges_list = []
for i in con[:-1]:
edges_list.append(tuple(i.split('-')[:2]))
print(edges_list)
DG.add_edges_from(edges_list)
# 运用布局
pos = nx.spring_layout(DG) # 用Fruchterman-Reingold算法排列节点(样子类似多中心放射状)
# 绘制网络图
nx.draw(DG, pos, node_size=10, width=0.6, node_color=node_colors)
# 显示图片
plt.show()

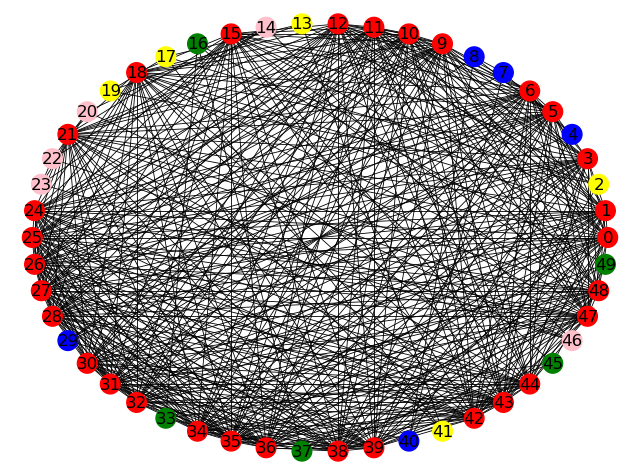
(3) 同心圆分布网络图
import networkx as nx
import matplotlib.pyplot as plt
import pandas as pd
from collections importCounter
df = pd.read_csv('nodes_info.csv')['所属俱乐部']
items = df.values
print(Counter(items))
node_colors = []
# 5个俱乐部 属于同一个俱乐部的节点设置相同颜色
for item in items:
if item == 'Free Agents':
node_colors.append('red')
elif item == 'Real Madrid':
node_colors.append('yellow')
elif item == 'Chelsea':
node_colors.append('blue')
elif item == 'FC Barcelona':
node_colors.append('green')
elif item == 'Manchester Utd':
node_colors.append('pink')
DG = nx.MultiGraph()
DG.add_nodes_from([str(i) for i in range(0, 50)])
DG.nodes()
with open('record.txt', 'r') as f:
con = f.read().split('\n')
edges_list = []
for i in con[:-1]:
edges_list.append(tuple(i.split('-')[:2]))
print(edges_list)
DG.add_edges_from(edges_list)
# 运用布局
pos = nx.shell_layout(DG) # 节点在同心圆上分布
# 绘制网络图
nx.draw(DG, pos, with_labels=True, node_size=200, width=0.6, node_color=node_colors)
# 显示图片
plt.show()
-END-
扫码添加早小起,进入Python技术交流群
