7000字 23张图,Pandas一键生成炫酷的动态交互式图表
今天小编来演示一下如何用pandas一行代码来绘制可以动态交互的图表,并且将绘制的图表组合到一起,组成可视化大屏,本次小编将要绘制的图表有
折线图 散点图 直方图 柱状图 饼图 面积图 地图 组合图
准备工作
我们先导入需要用到的库,并做相应的设置
import pandas as pd
import pandas_bokeh
pandas_bokeh.output_notebook()
因为小编是在jupyter nobteook上面操作的,这边就用到了output_notebook()的设置
折线图
我们先来画一张简单的折线图,当中随机生成一批数据
import numpy as np

np.random.seed(55)
df = pd.DataFrame({"宁德时代": np.random.randn(100)+0.2,
                   "贵州茅台": np.random.randn(100)+0.17},
                   index=pd.date_range('1/1/2021', periods=100))
df = df.cumsum()
df = df + 50
df.plot_bokeh(kind="line")
output
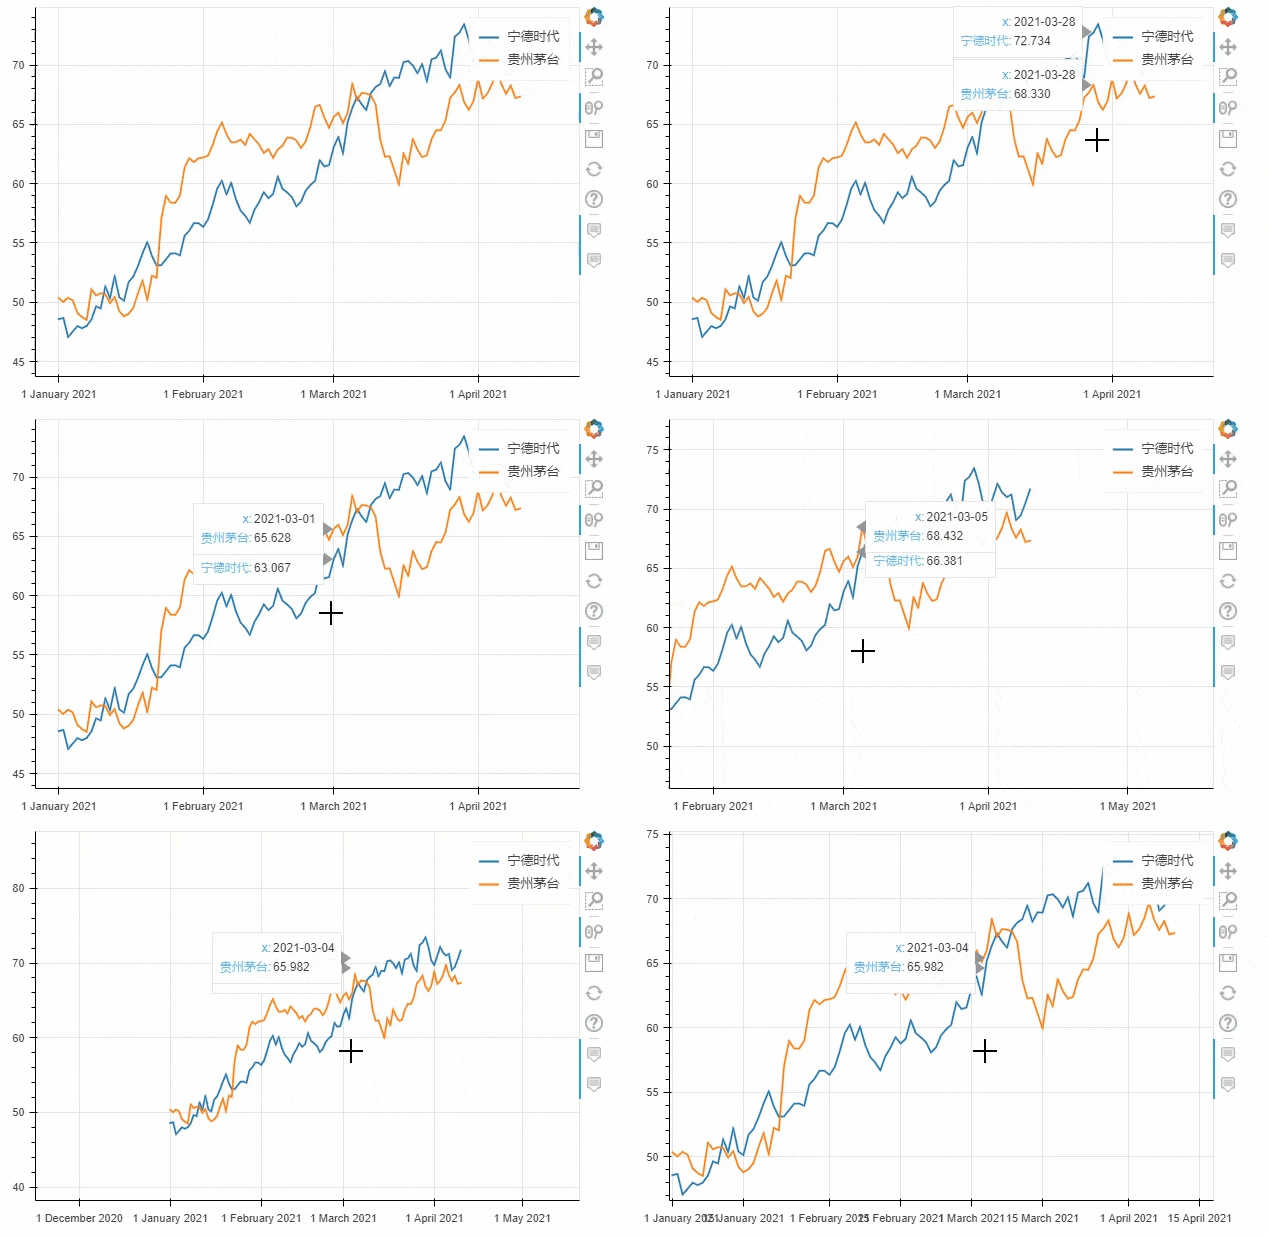
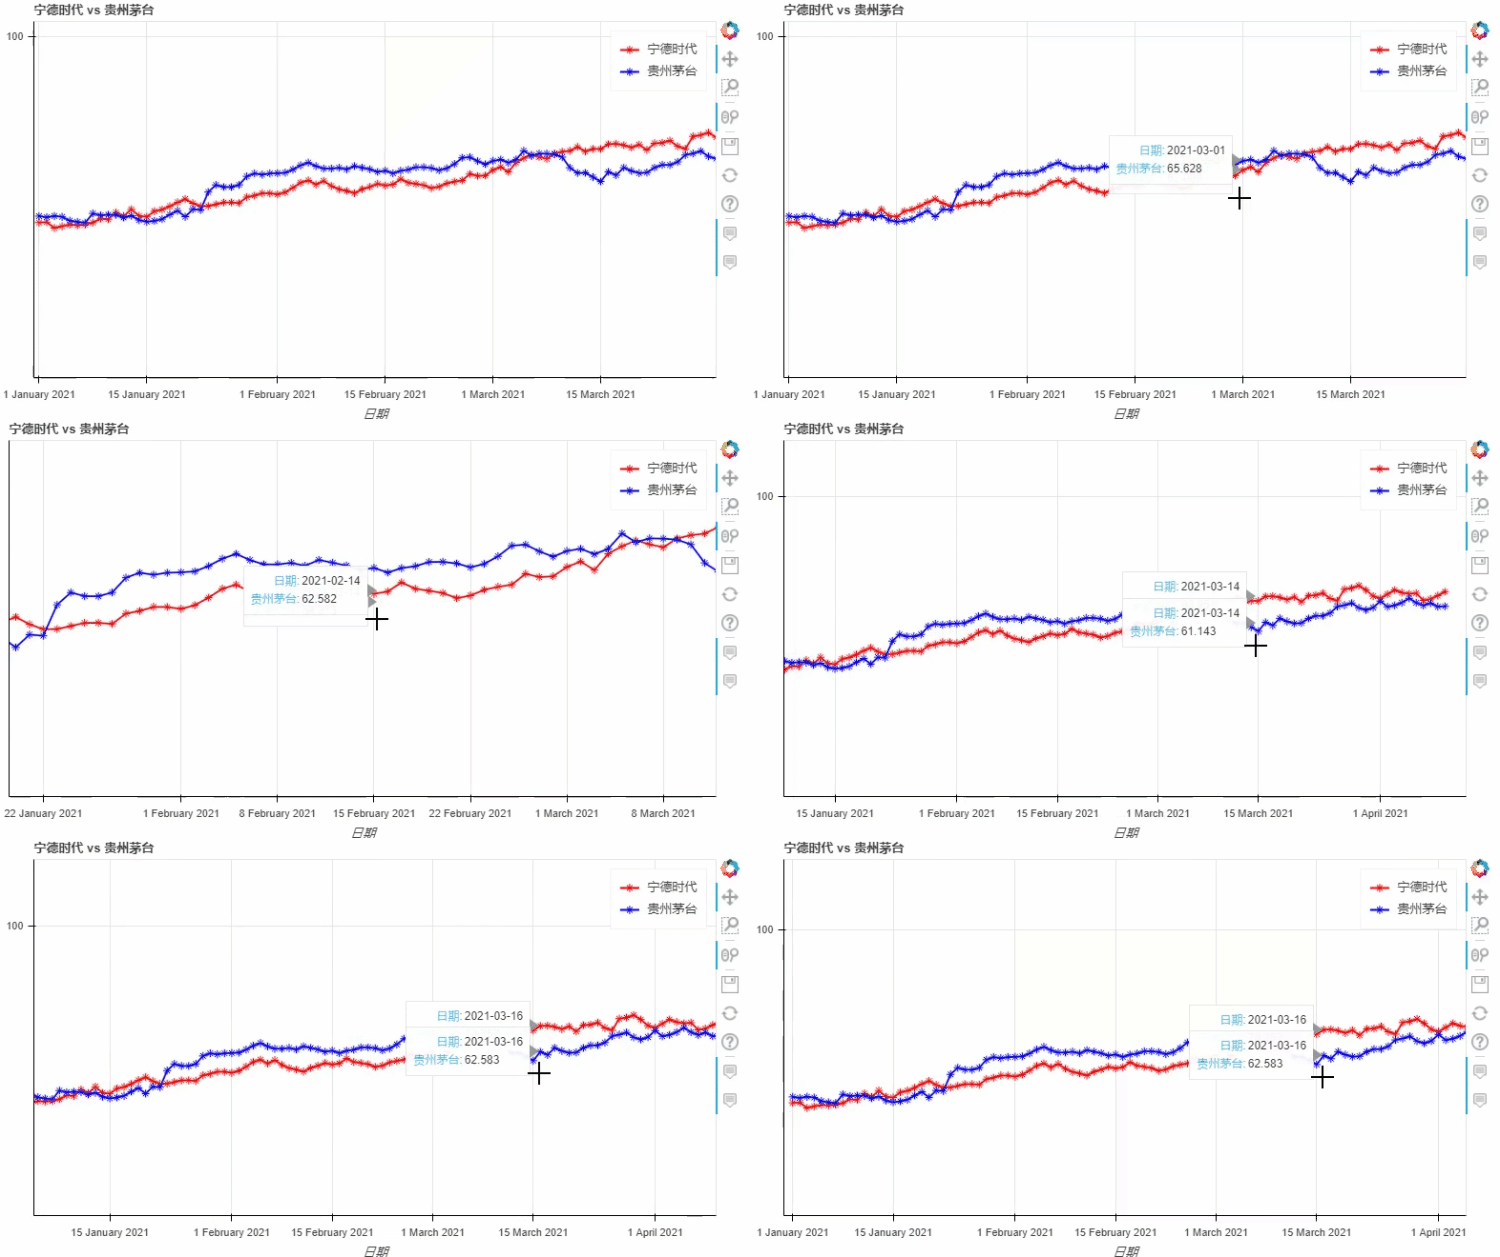
kind加以设定,我们将上面的代码优化一下df.plot_bokeh.line(
figsize=(800, 450),
title="宁德时代 vs 贵州茅台",
xlabel="日期",
ylabel="股票价格 [$]",
yticks=[0, 100, 200, 300, 400],
ylim=(0, 100),
xlim=("2021-01-01", "2021-04-01"),
colormap=["red", "blue"],
plot_data_points=True,
plot_data_points_size=10,
marker="asterisk")
output
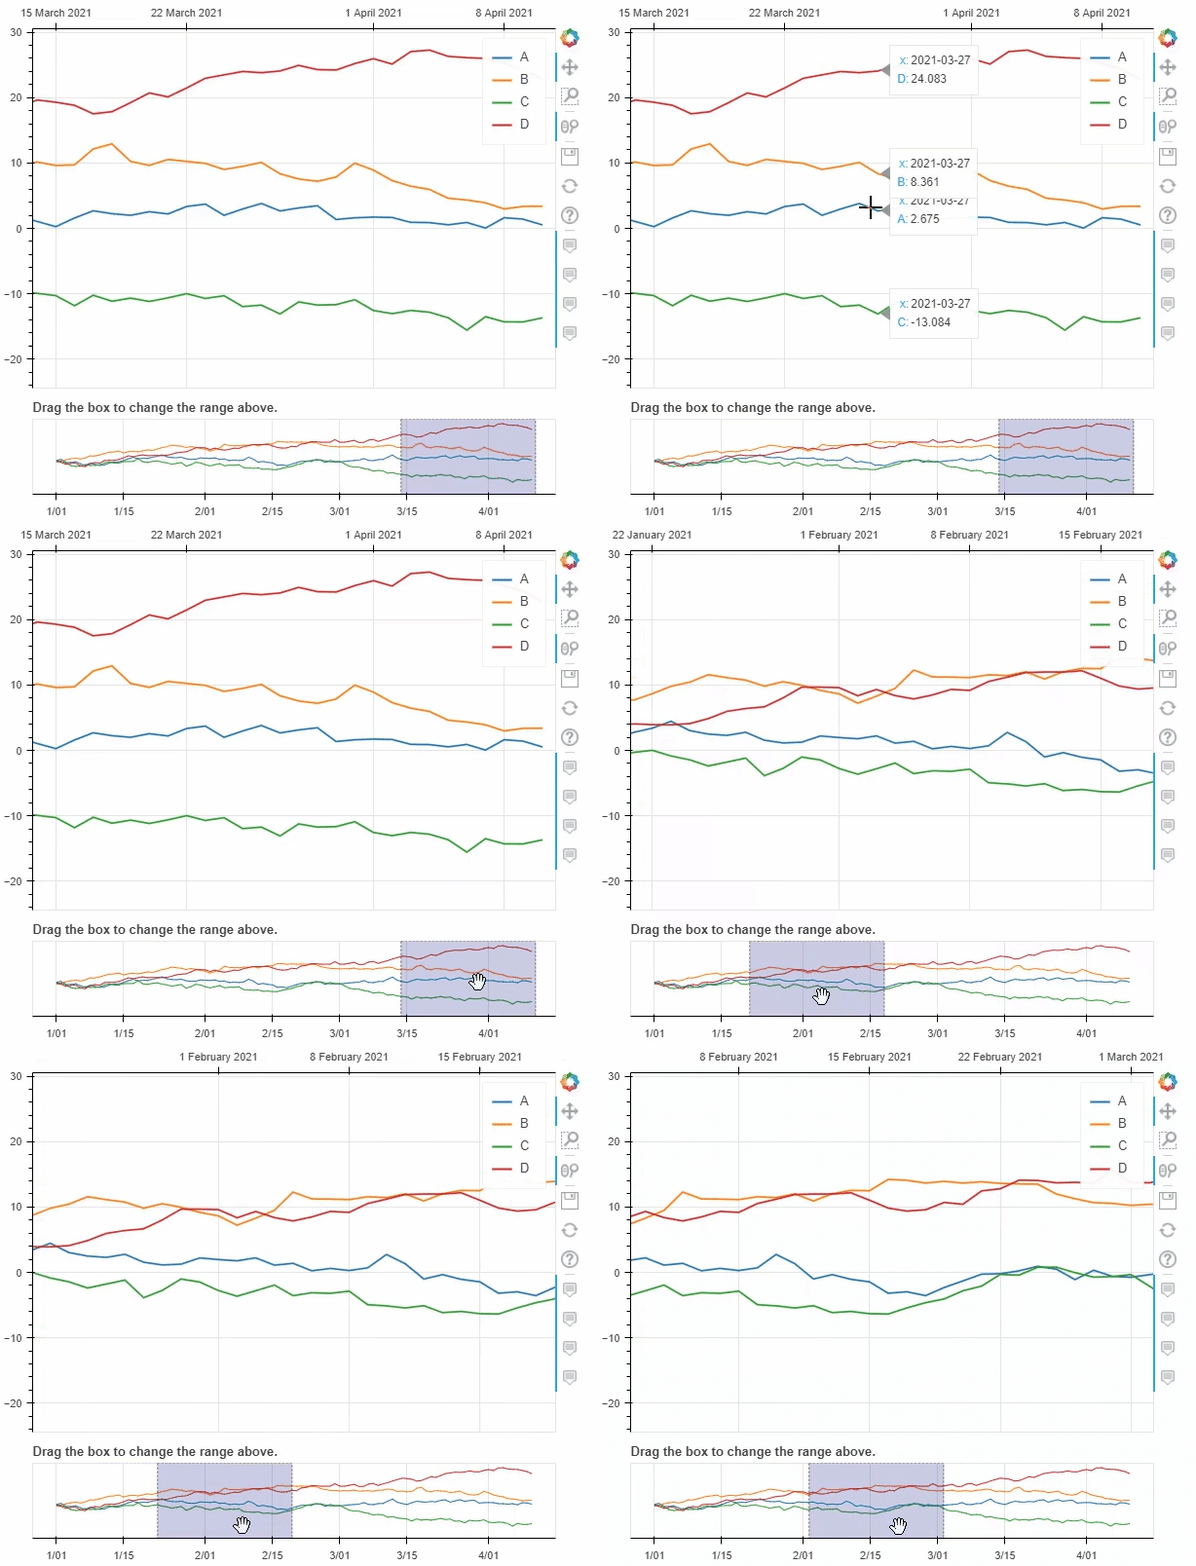
pyecharts类似,我们也可以在图标的底部添加一个时间轴,拖动时间轴来展示数据ts = pd.Series(np.random.randn(100), index=pd.date_range('1/1/2021', periods=100))
df = pd.DataFrame(np.random.randn(100, 4), index=ts.index, columns=list('ABCD'))
df = df.cumsum()
df.plot_bokeh(rangetool=True)
output
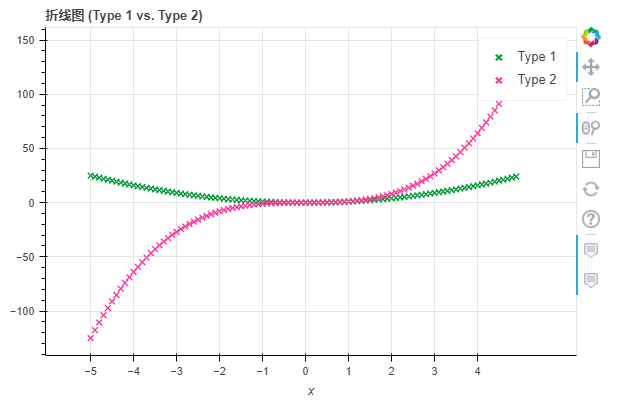
markerx = np.arange(-5, 5, 0.1)
y2 = x**2
y3 = x**3
df = pd.DataFrame({"x": x, "Type 1": y2, "Type 2": y3})
df.plot_bokeh.point(
x="x",
xticks=range(-5, 5),
size=5,
colormap=["#009933", "#ff3399"],
title="折线图 (Type 1 vs. Type 2)",
marker="x")
output
散点图
接下来我们来看散点图,步骤与上述的折线图相类似
df = pd.read_csv("iris.csv")
p_scatter = df.plot_bokeh.scatter(
    x="petal length(cm)",
    y="sepal width(cm)",
    category="species",
    title="Iris数据集可视化",
    show_figure=True,
)
output
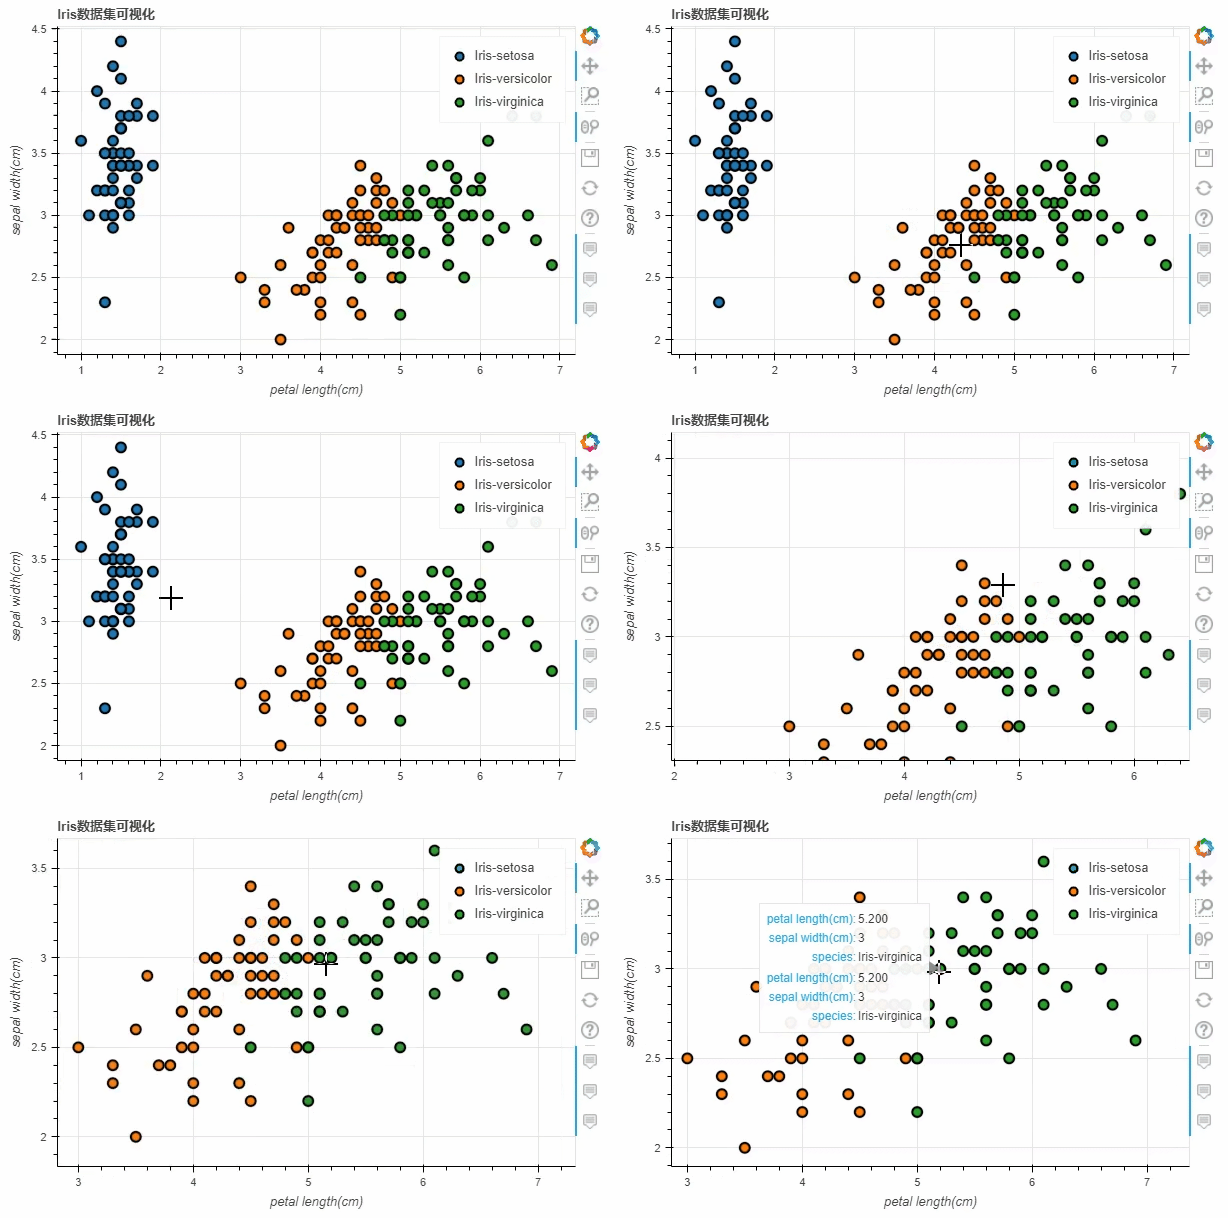
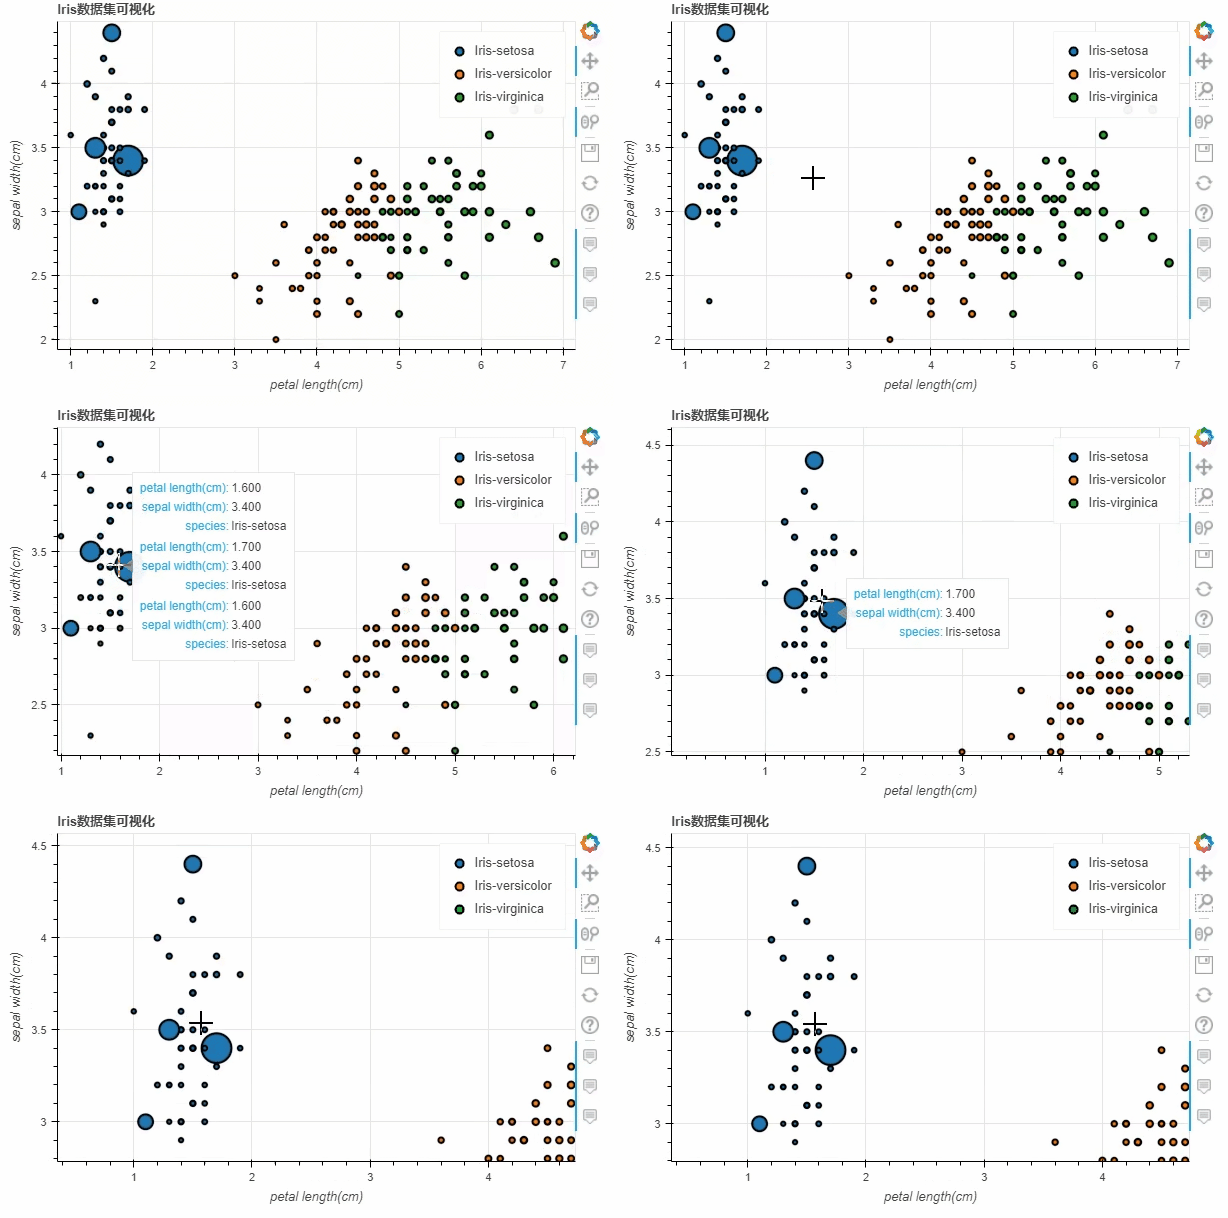
iris数据集之后,将x参数和y参数上填上我们所要绘制的两列,而title参数则是设置图表的标题我们也可以通过当中size这个参数来控制散点的大小,例如
df.loc[13, "sepal length(cm)"] = 15
df.loc[15, "sepal length(cm)"] = 17
df.loc[20, "sepal length(cm)"] = 30
df.loc[40, "sepal length(cm)"] = 20

p_scatter = df.plot_bokeh.scatter(
    x="petal length(cm)",
    y="sepal width(cm)",
    category="species",
    title="Iris数据集可视化",
    show_figure=True,
    size="sepal length(cm)"
)
output
柱状图
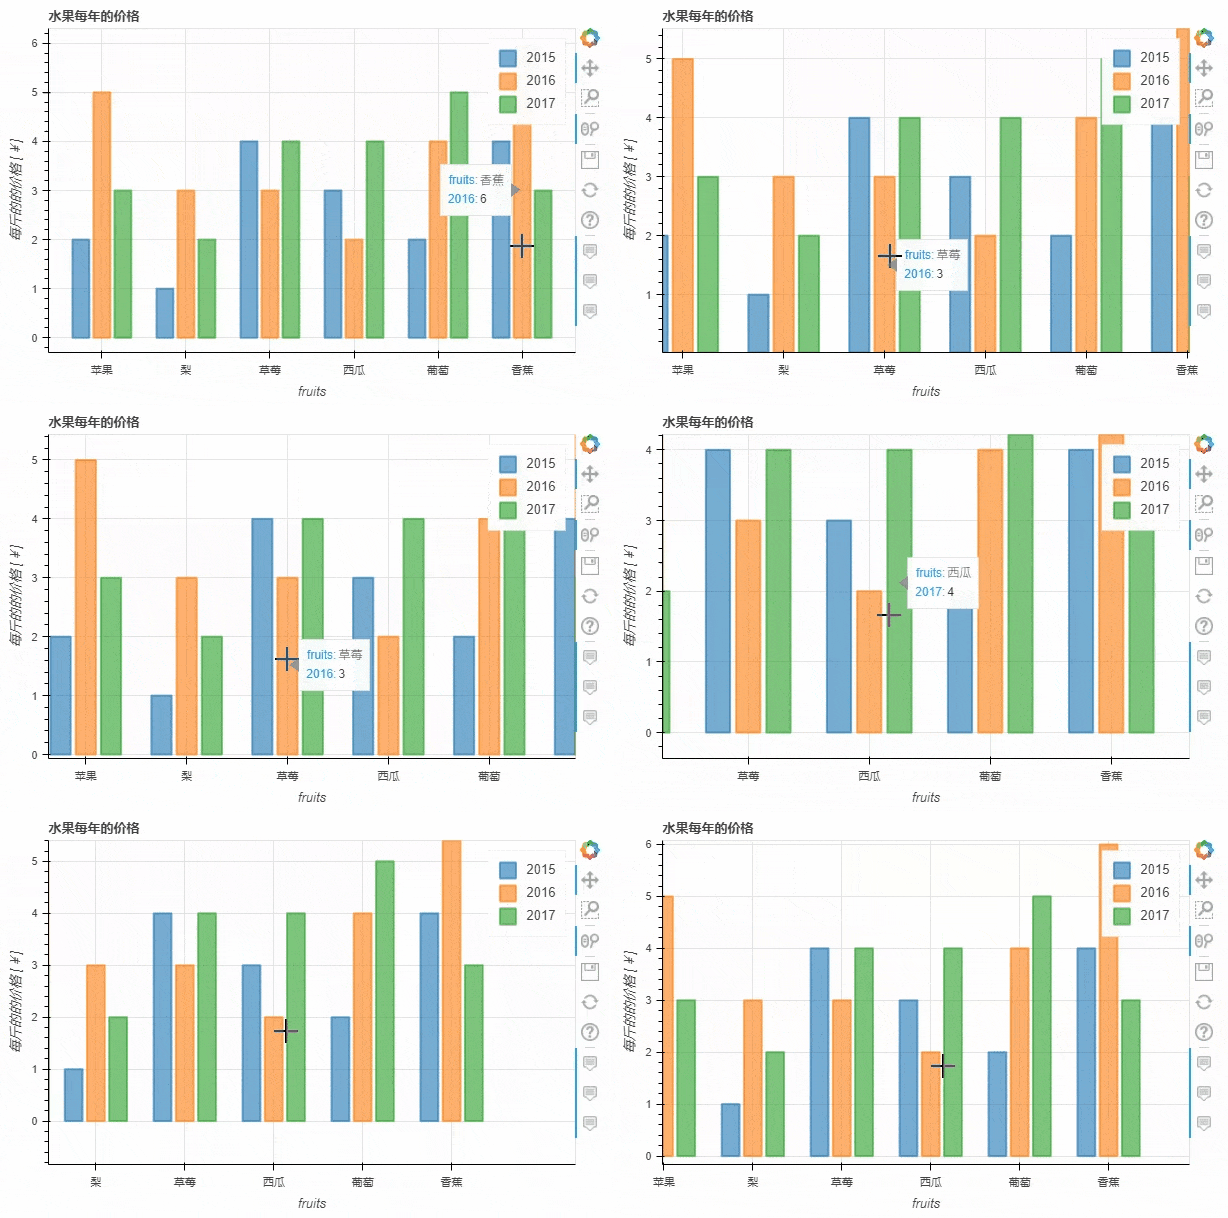
下面我们来看一下直方图的绘制
data = {
    'fruits':
    ['苹果', '梨', '草莓', '西瓜', '葡萄', '香蕉'],
    '2015': [2, 1, 4, 3, 2, 4],
    '2016': [5, 3, 3, 2, 4, 6],
    '2017': [3, 2, 4, 4, 5, 3]
}
df = pd.DataFrame(data).set_index("fruits")

p_bar = df.plot_bokeh.bar(
    ylabel="每斤的的价格 [¥]",
    title="水果每年的价格",
    alpha=0.6)
output
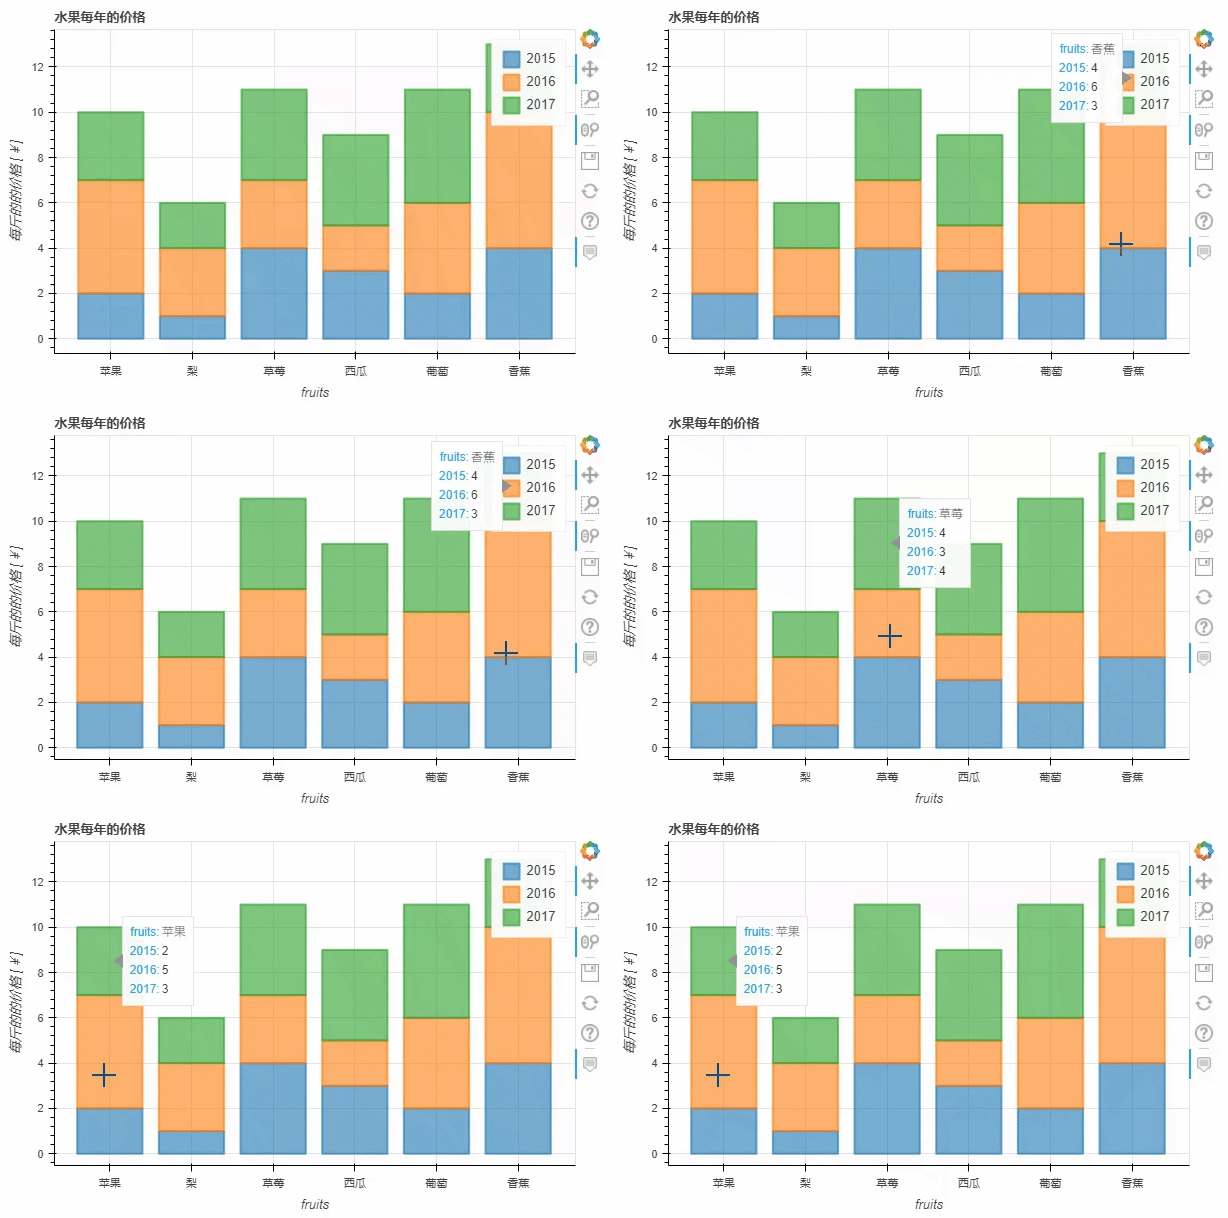
stacked这个参数来实现p_stacked_bar = df.plot_bokeh.bar(
ylabel="每斤的的价格 [¥]",
title="水果每年的价格",
stacked=True,
alpha=0.6)
output
直方图
绘制直方图的方式也是类似的
p_hist = df_hist.plot_bokeh.hist(
    y=["a", "b"],
    bins=np.arange(-5, 5, 0.5),
    normed=100,
    vertical_xlabel=True,
    ylabel="Share[%]",
    title="正则分布直方图",
    show_average=True,
    xlim=(-4, 6),
    ylim=(0, 30),
    show_figure=True)
output
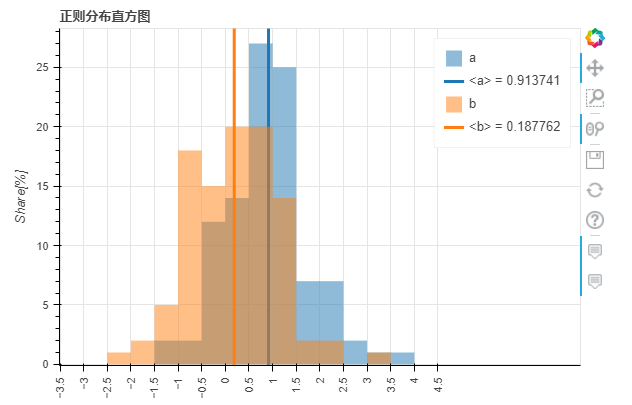
小编个人觉得直方图有点丑,不知道大家是不是有类似的体验
面积图
df.plot_bokeh.area(
    x="Year",
    stacked=True,
    legend="top_left",
    colormap=["yellow", "orange", "black", "grey", "blue", "green"],
    title="全球不同能源的消耗量",
    ylabel="不同能源的消耗(吨)",
    ylim=(0, 16000))
output
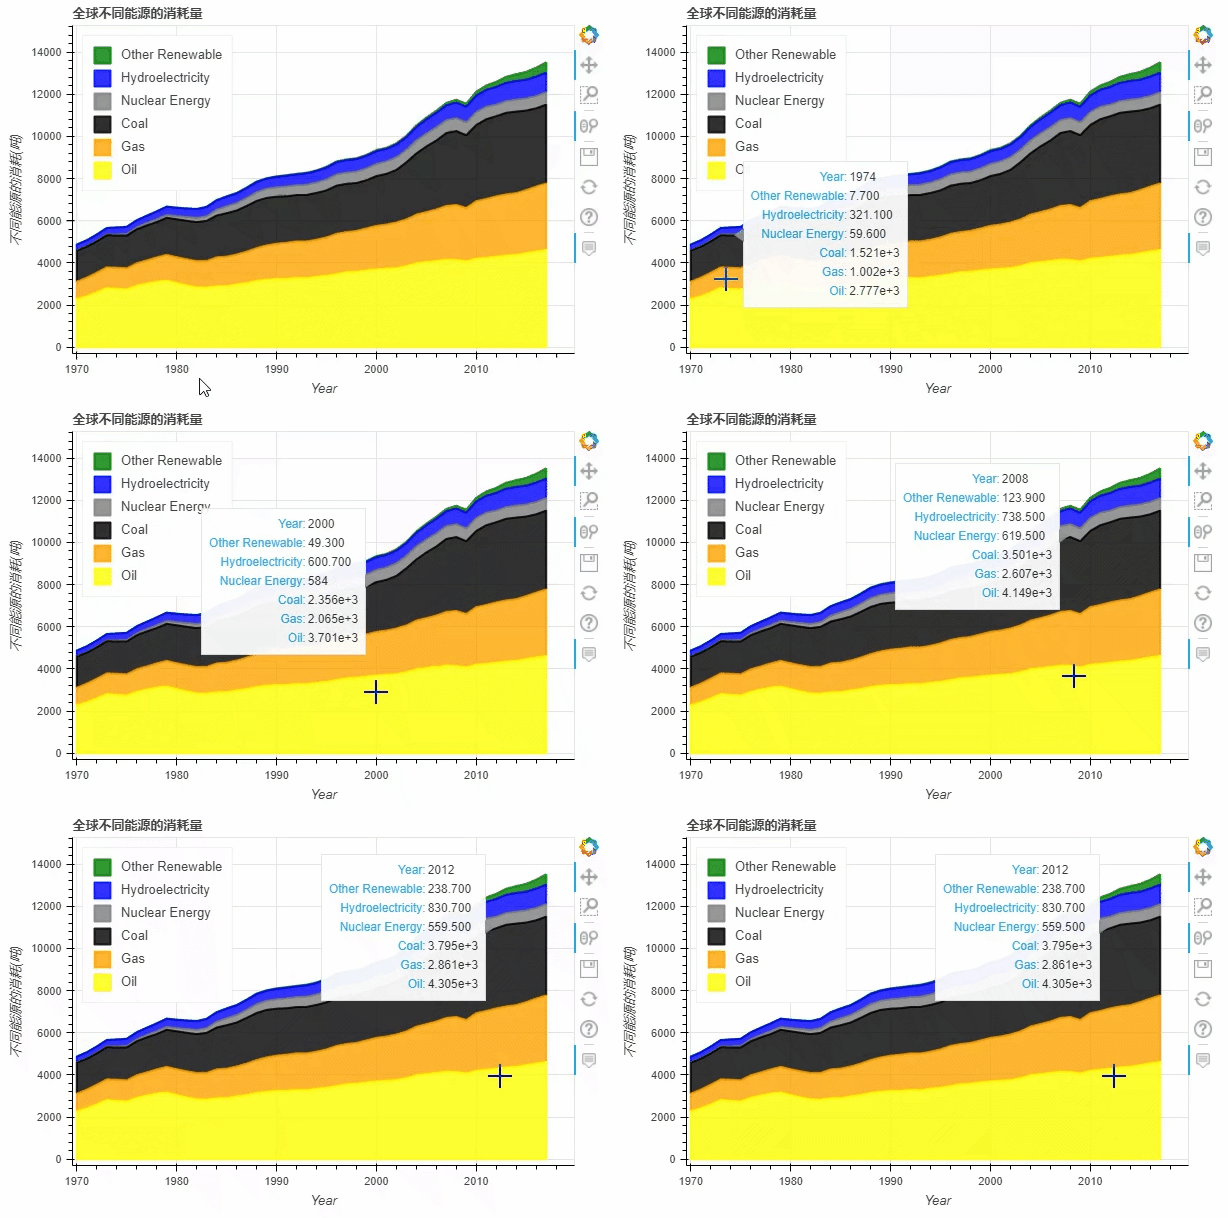
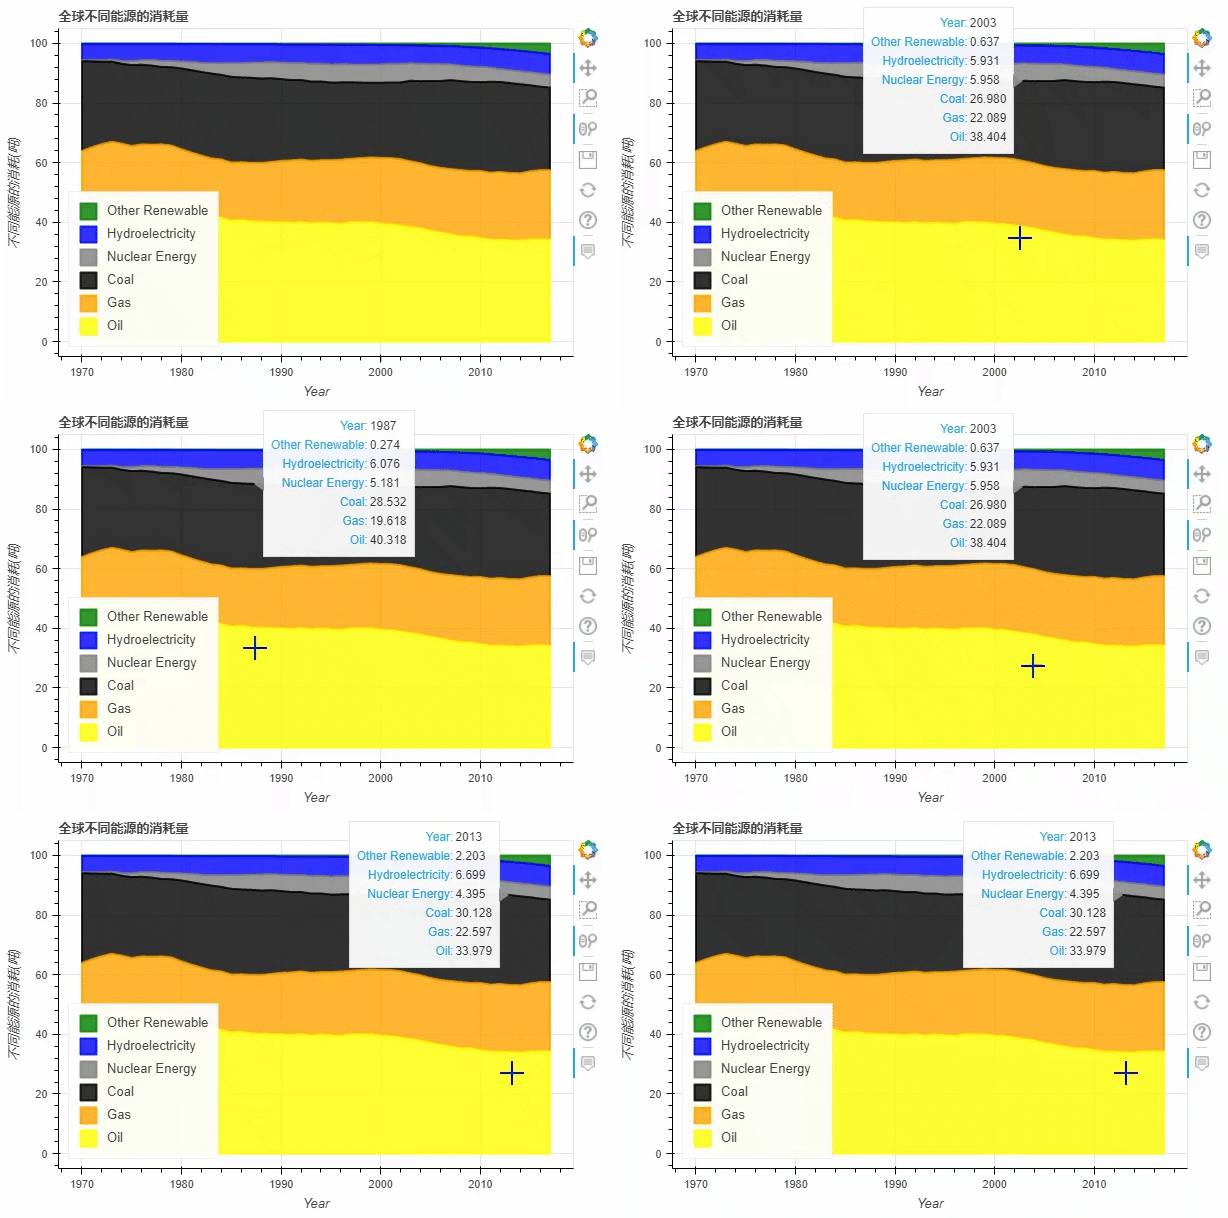
normed参数来帮助我们更好的观察数据的走势df.plot_bokeh.area(
x="Year",
stacked=True,
normed = 100,
legend="bottom_left",
colormap=["yellow", "orange", "black", "grey", "blue", "green"],
title="全球不同能源的消耗量",
ylabel="不同能源的消耗(吨)")
output
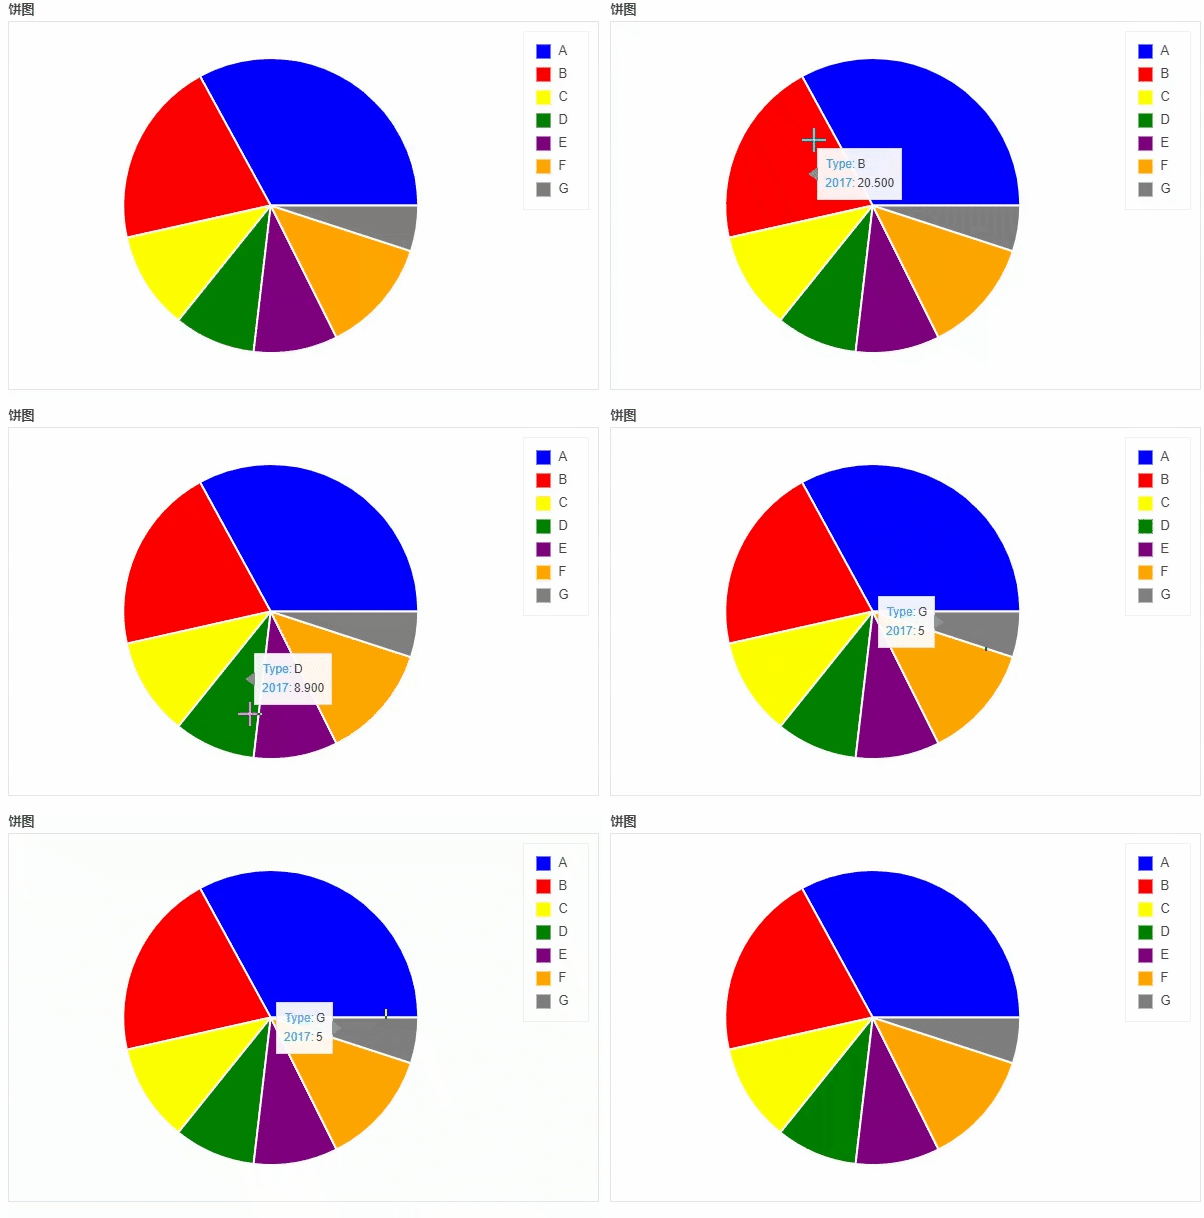
饼图
df_pie.plot_bokeh.pie(
    x="Type",
    y="2017",
    colormap=["blue", "red", "yellow", "green", "purple", "orange", "grey"],
    title="饼图",
    )
output
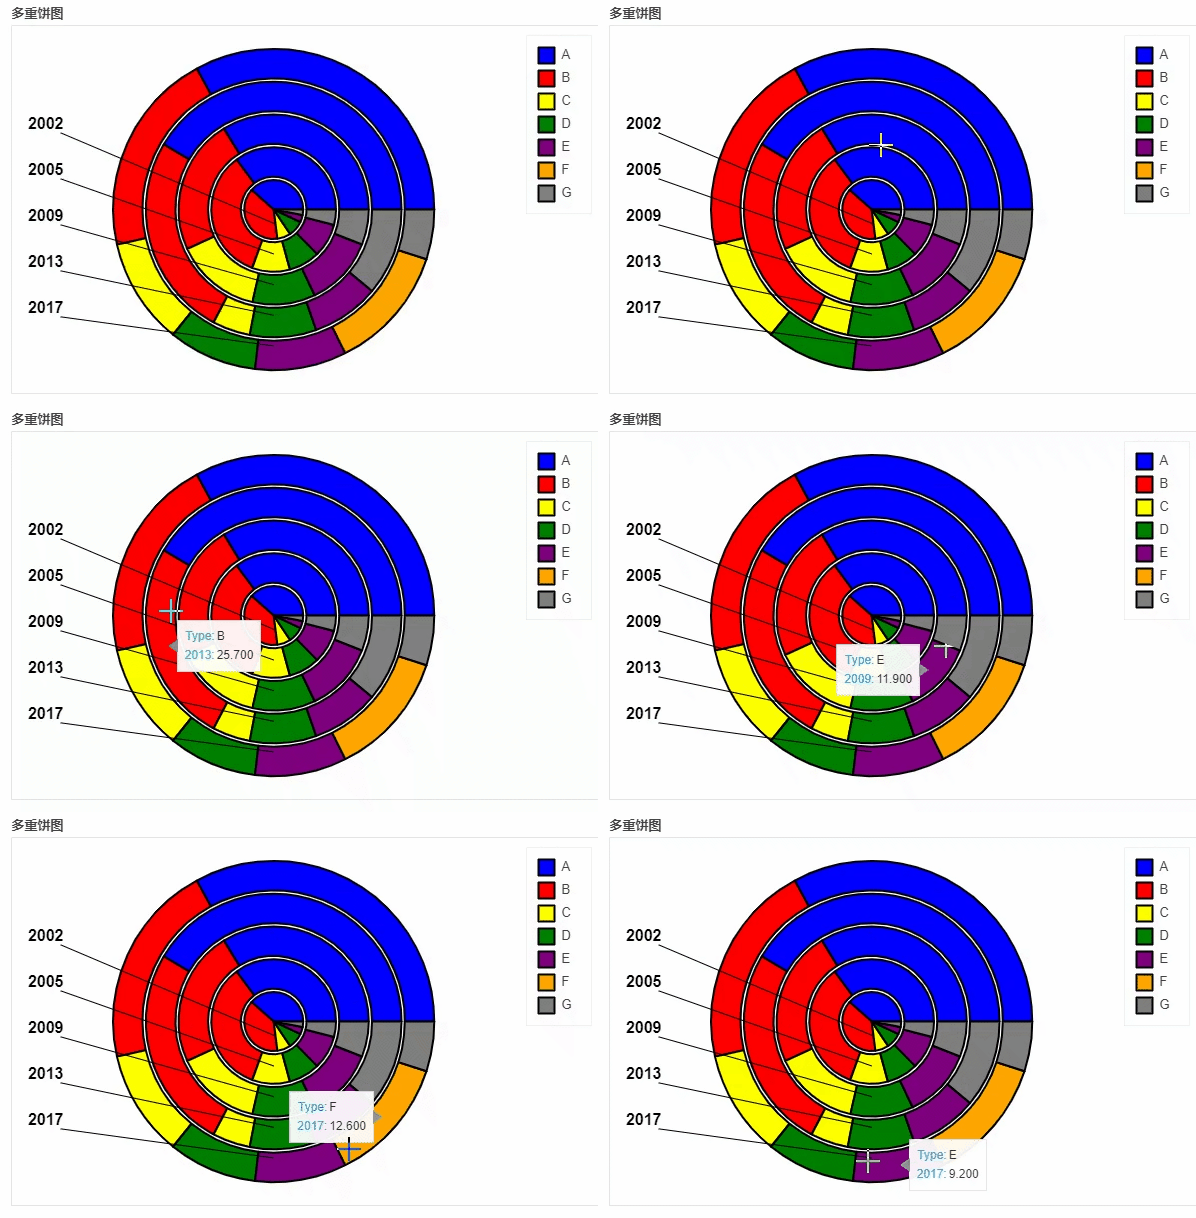
df_pie.plot_bokeh.pie(
    x="Type",
    colormap=["blue", "red", "yellow", "green", "purple", "orange", "grey"],
    title="多重饼图",
    line_color="black")
output
地图
df_mapped.plot_bokeh.map(
    x="longitude",
    y="latitude",
    hovertool_string=""" @{name}

                         Population: @{pop_max} """,
    tile_provider="STAMEN_TERRAIN_RETINA",
    size="population",
    figsize=(900, 600),
    title="全球特大城市分布")
output
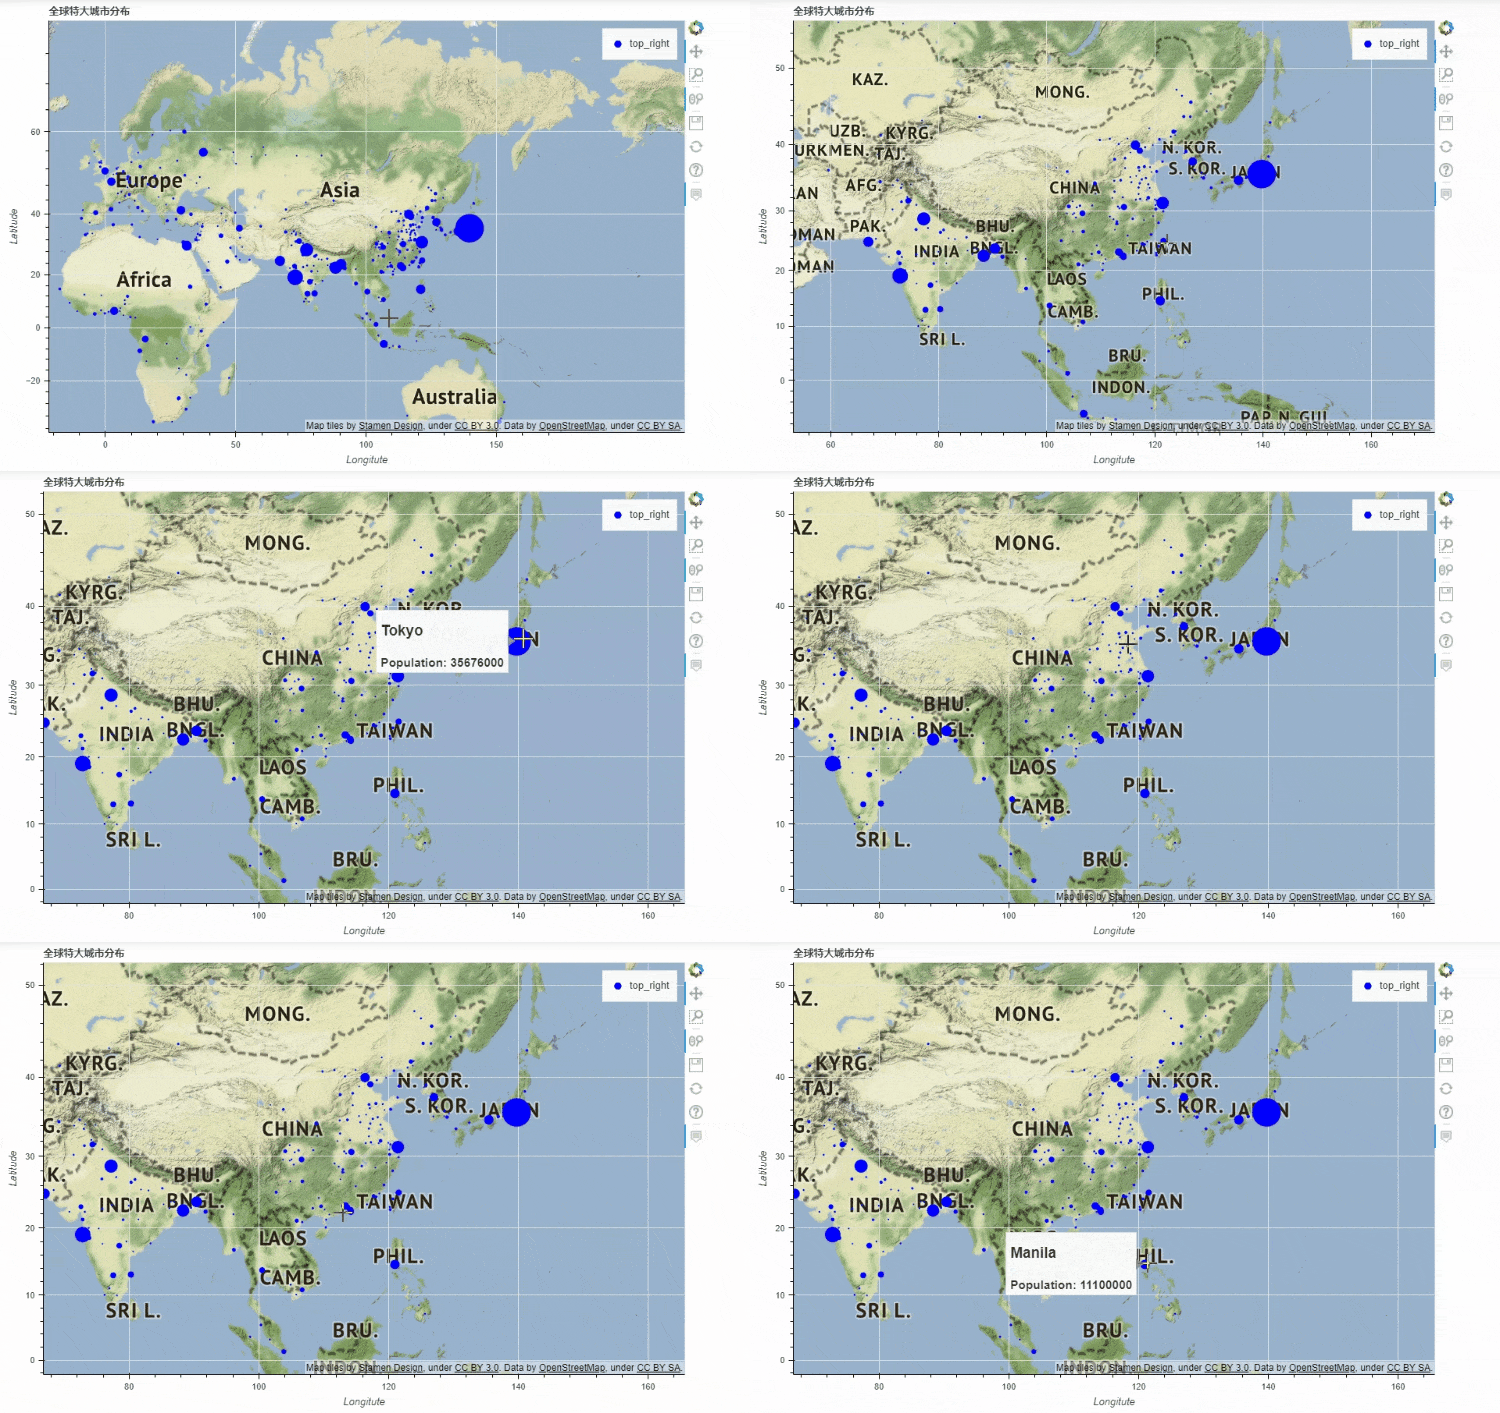
x和y分别对应的是经纬度,import geopandas as gpd
import pandas_bokeh
pandas_bokeh.output_file("Interactive Plot.html")
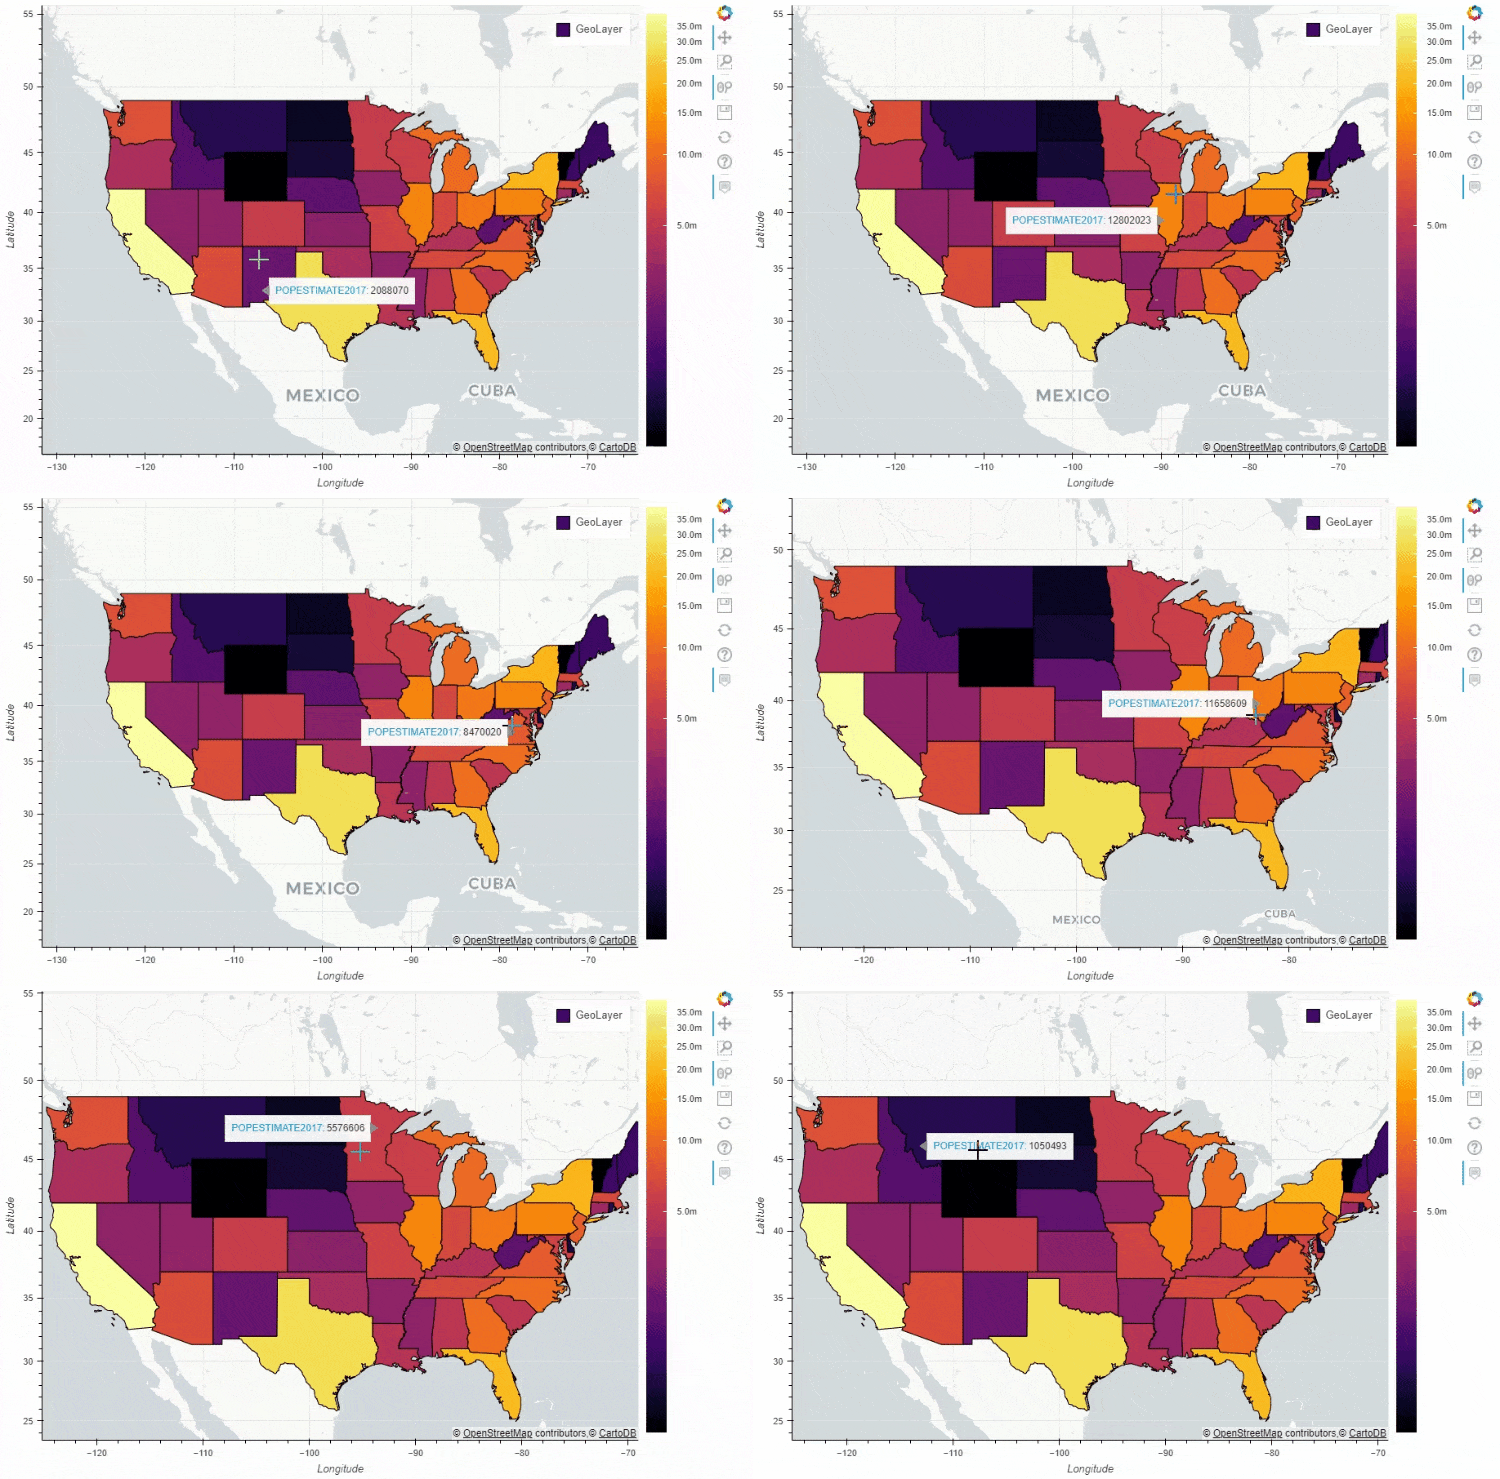
df_states = gpd.read_file("states.geojson")
print(df_states.head())
df_states.plot_bokeh(
    figsize=(900, 600),
    category="POPESTIMATE2017",
    simplify_shapes=5000,
    colormap="Inferno",
    colormap_uselog=True,
    colorbar_tick_format="0.0a")
output
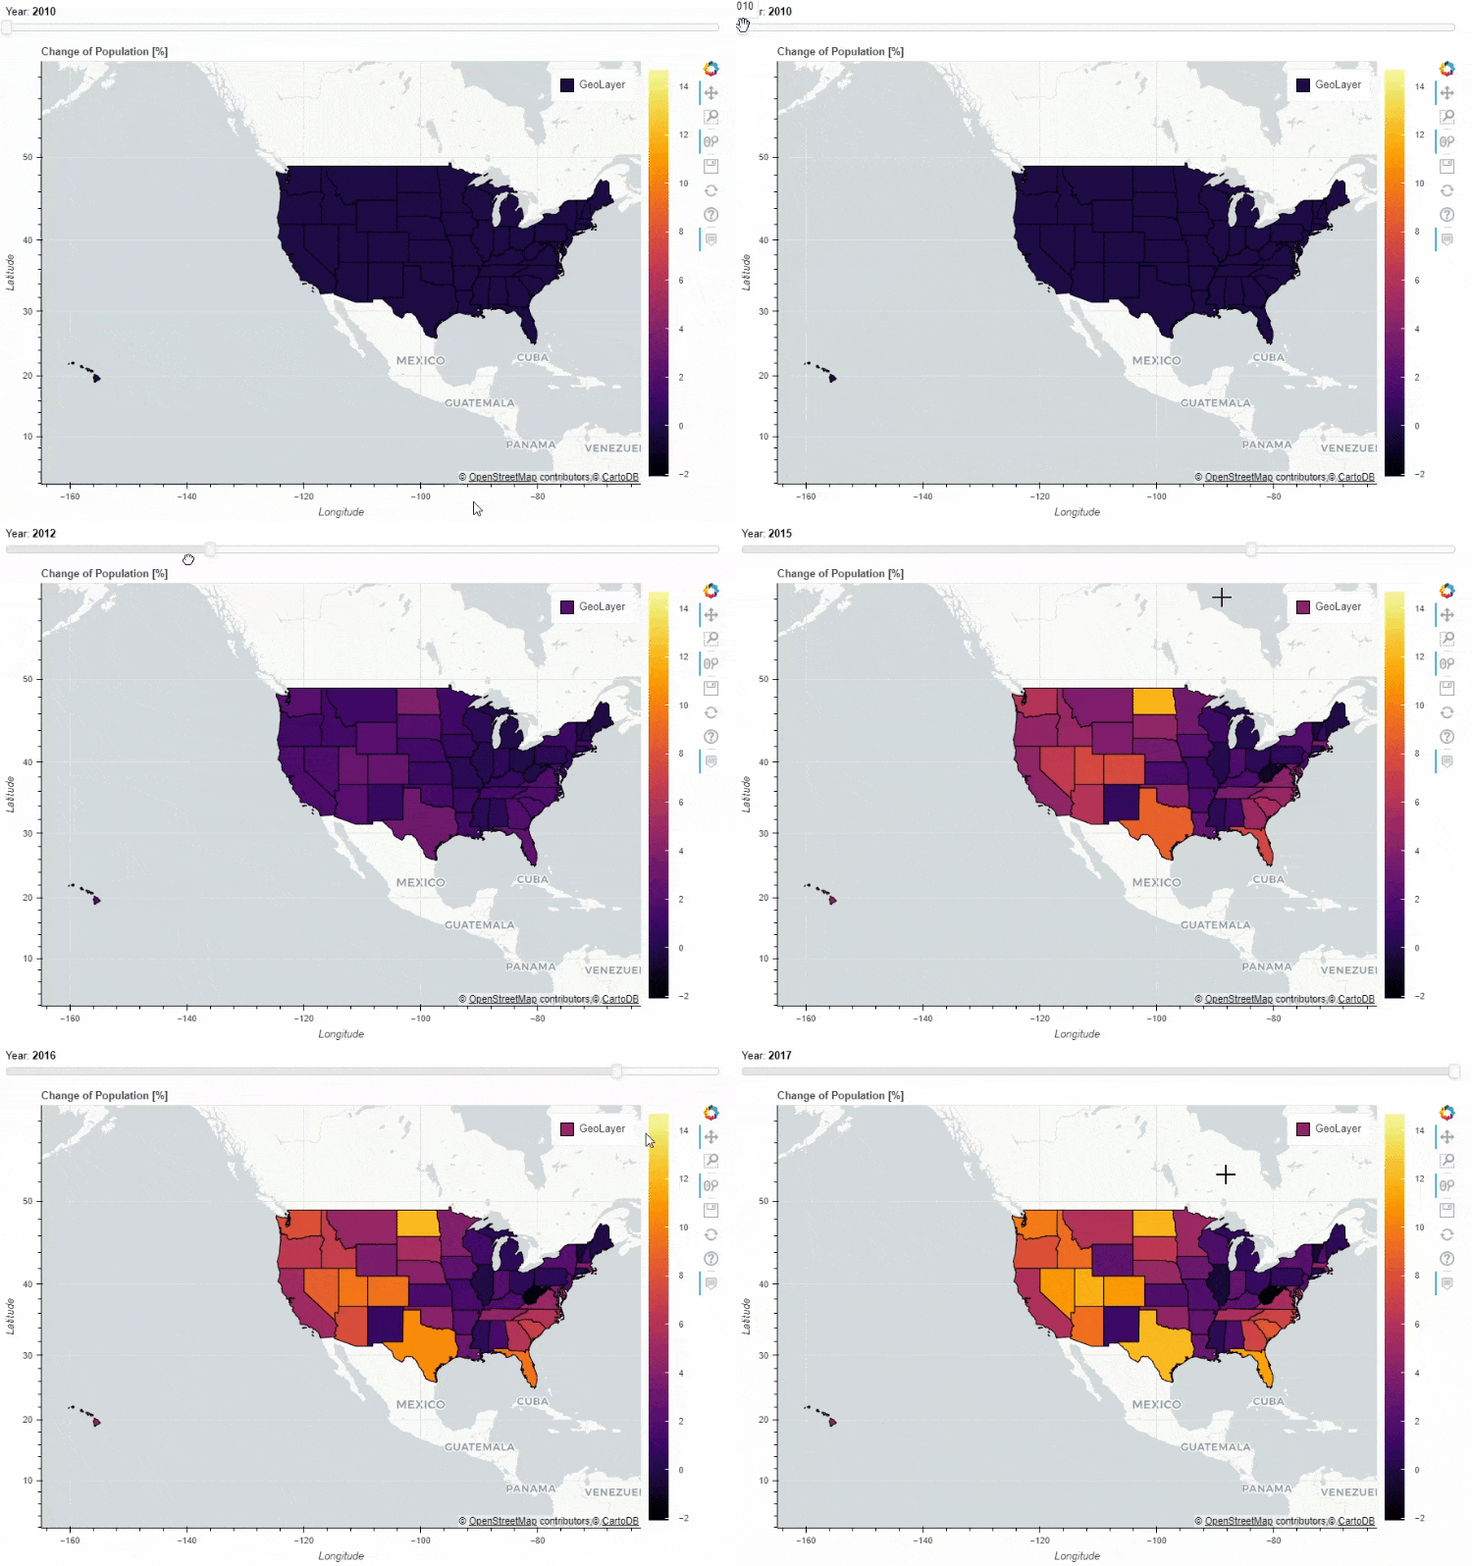
当然我们也可以在地图上面添加一个时间轴,让图表随着时间的流逝而变化
for i in range(8):
    df_states["Delta_Population_201%d"%i] = ((df_states["POPESTIMATE201%d"%i] / df_states["POPESTIMATE2010"]) -1 ) * 100

slider_columns = ["Delta_Population_201%d"%i for i in range(8)]
slider_range = range(2010, 2018)
df_states.plot_bokeh(
    figsize=(900, 600),
    simplify_shapes=5000,
    slider=slider_columns,
    slider_range=slider_range,
    slider_name="Year",
    colormap="Inferno",
    hovertool_columns=["STATE_NAME"] + slider_columns,
    title="Change of Population [%]")
output
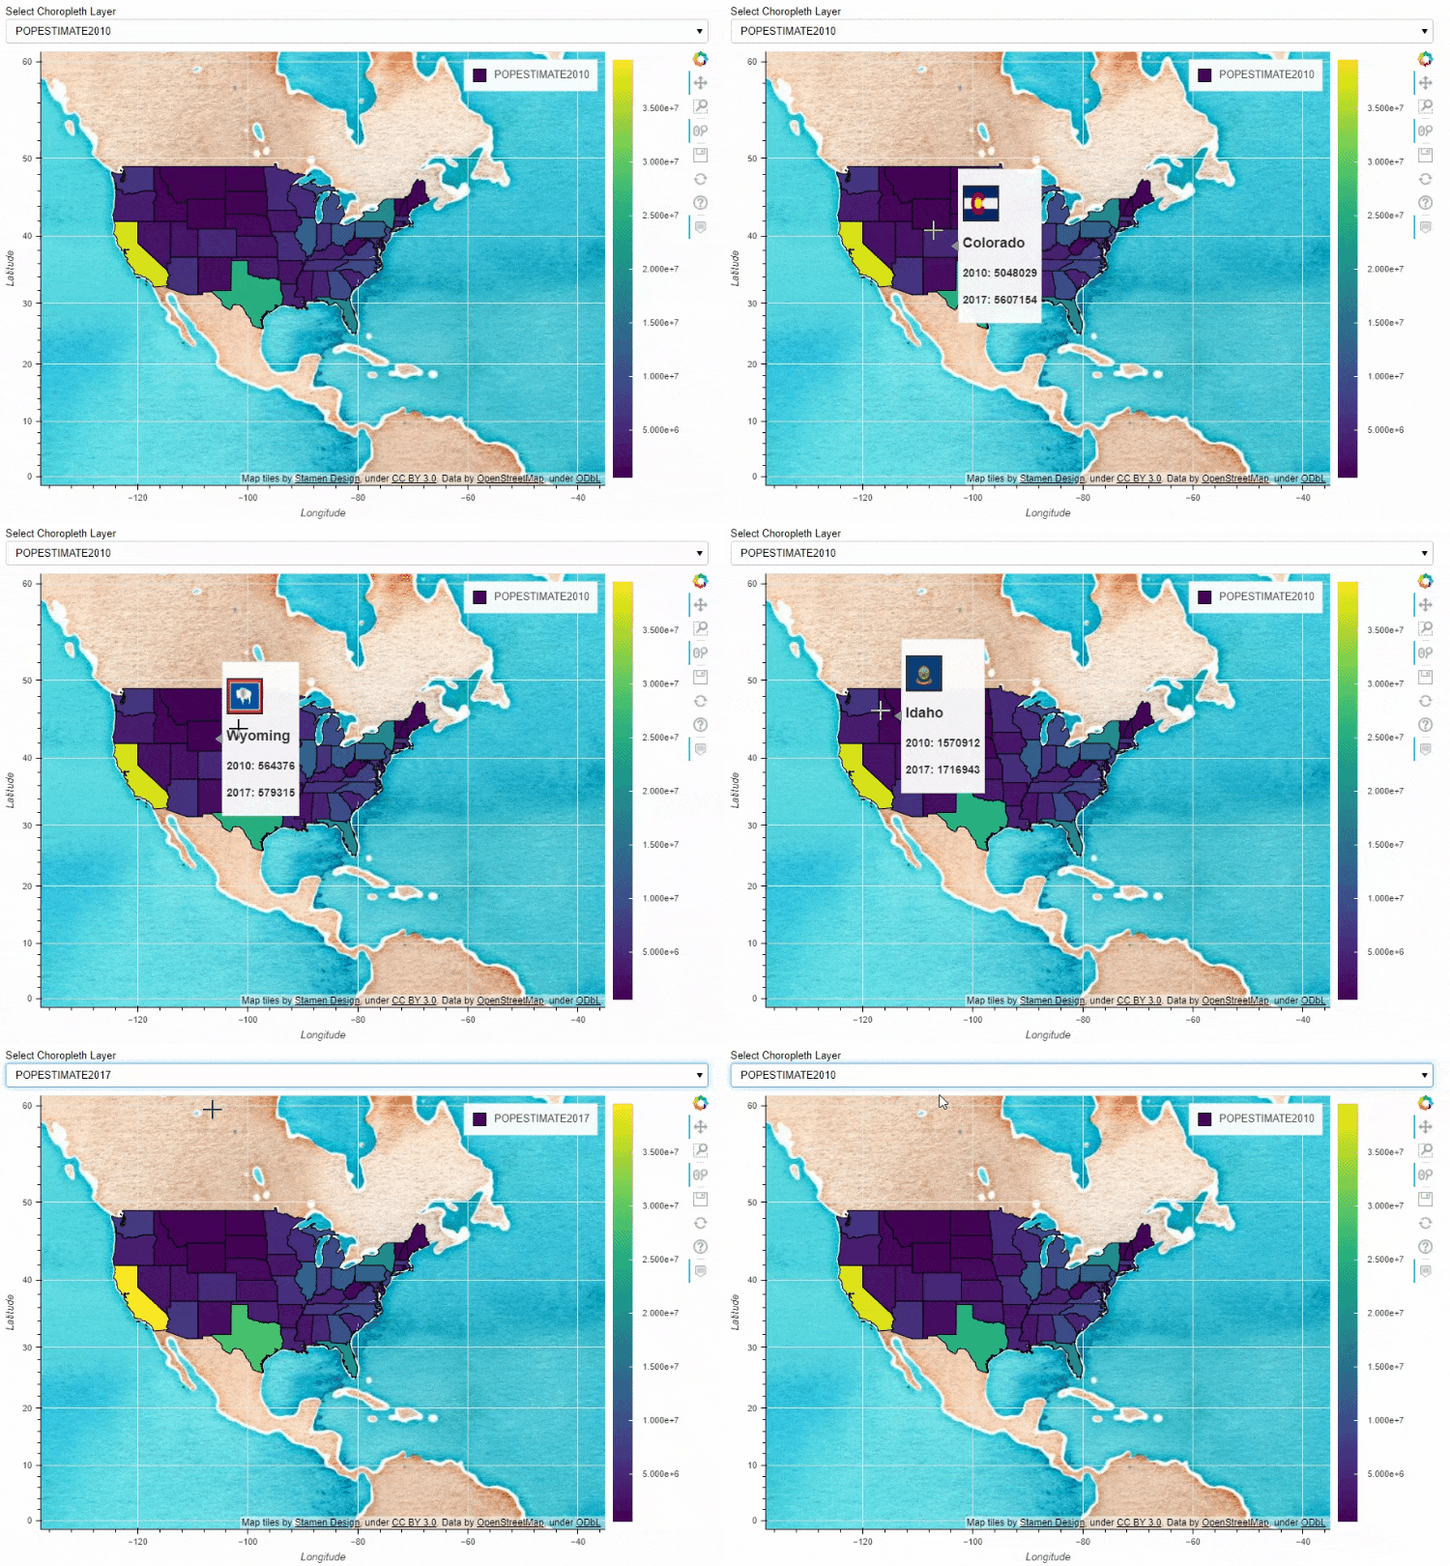
同时我们也可以在地图上面添加一个下拉框,通过点选来筛选数据的展示
df_states["STATE_NAME_SMALL"] = df_states["STATE_NAME"].str.lower()

df_states.plot_bokeh(
    figsize=(900, 600),
    simplify_shapes=5000,
    dropdown=["POPESTIMATE2010", "POPESTIMATE2017"],
    colormap="Viridis",
    hovertool_string="""
                        "
                        height="42" alt="@imgs" width="42"
                        style="float: left; margin: 0px 15px 15px 0px;"
                        border="2">

                          @STATE_NAME
                         2010: @POPESTIMATE2010
                         2017: @POPESTIMATE2017 """,
    tile_provider_url=r"http://c.tile.stamen.com/watercolor/{Z}/{X}/{Y}.jpg",
    tile_attribution='Map tiles by Stamen Design, under CC BY 3.0. Data by OpenStreetMap, under ODbL.'
    )
output
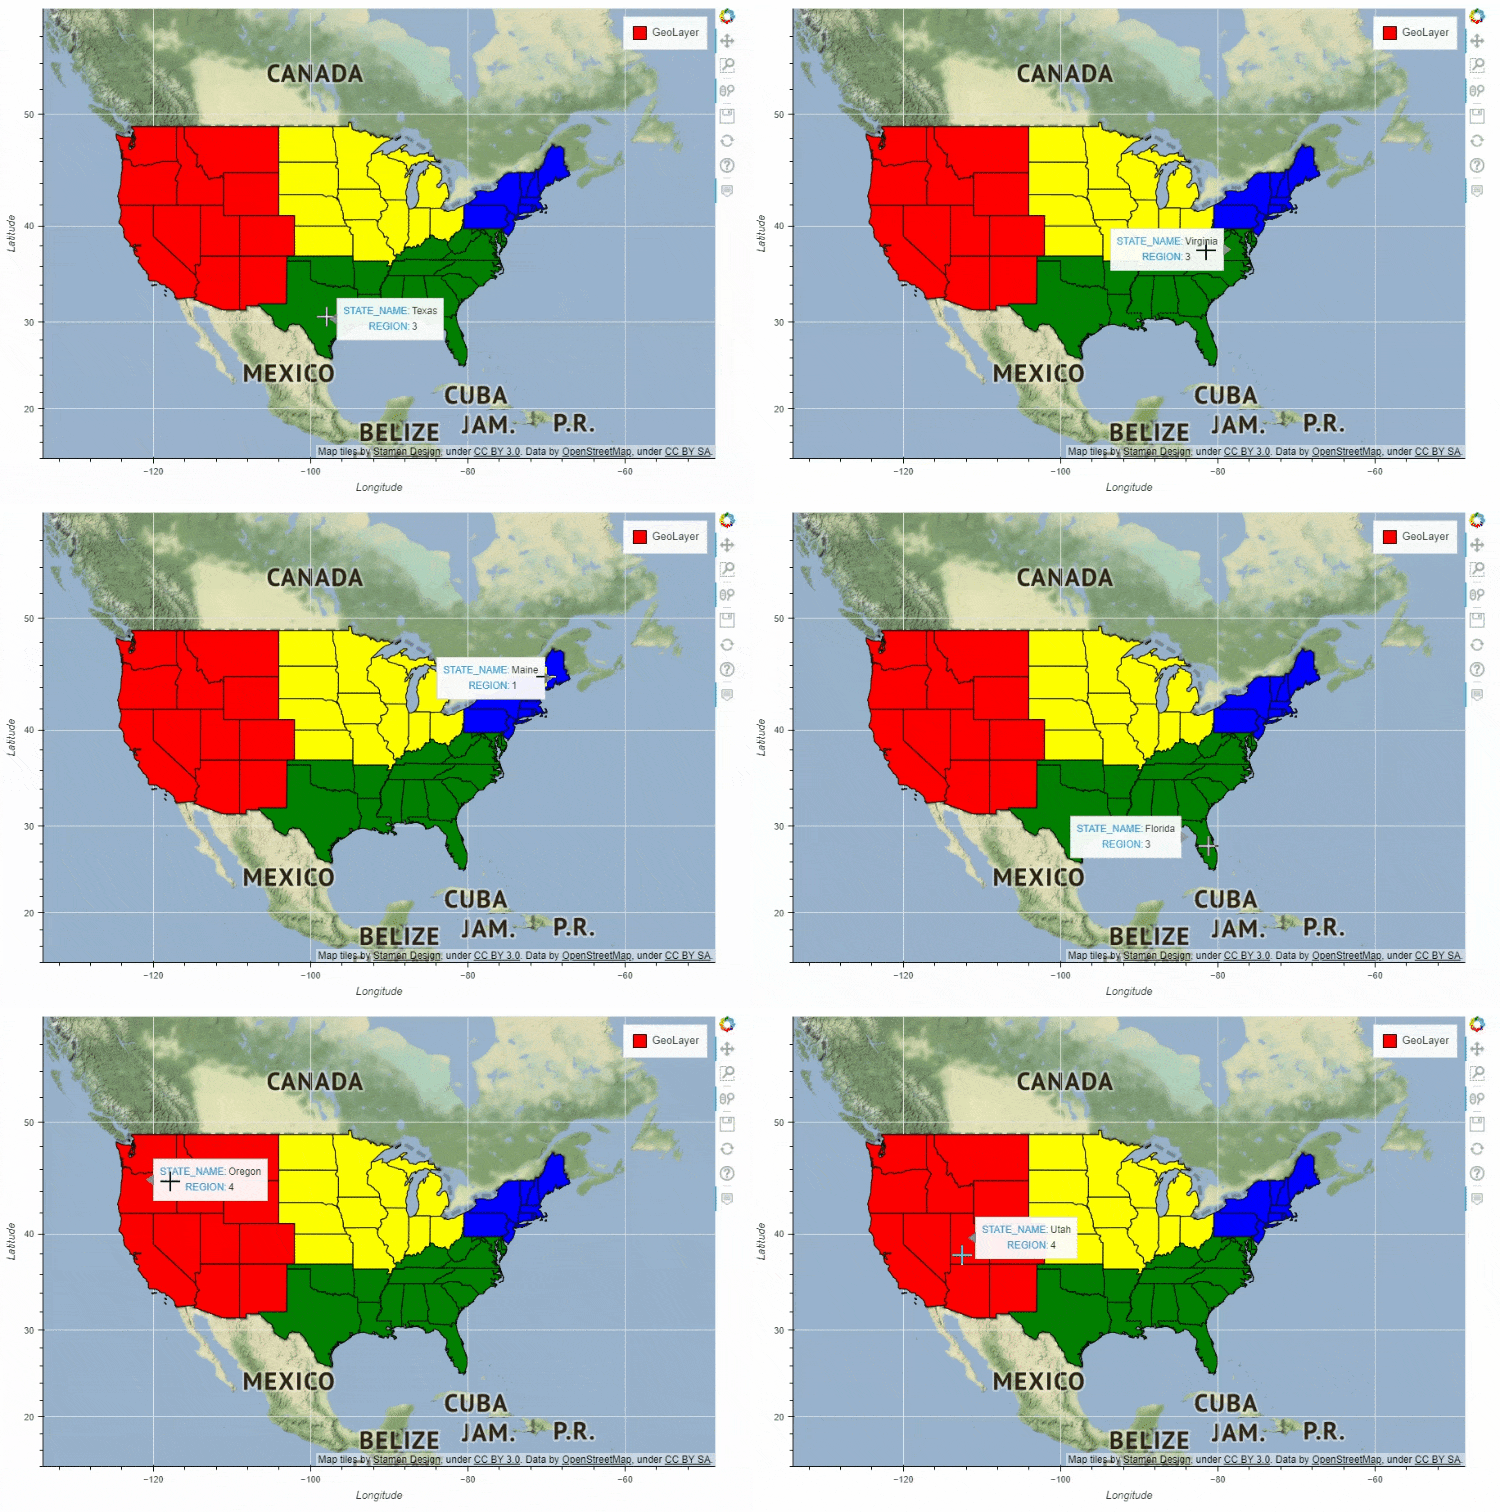
df_states.plot_bokeh(
    figsize=(900, 600),
    simplify_shapes=5000,
    category="REGION",
    show_colorbar=False,
    colormap=["blue", "yellow", "green", "red"],
    hovertool_columns=["STATE_NAME", "REGION"],
    tile_provider="STAMEN_TERRAIN_RETINA")
多图组合
pandas_bokeh模块也能够实现多张图表的组合,例如上面 人口密度的图表就可以和美国各大洲的人口总量的图表进行组合#绘制出大致的轮廓图
figure = df_states.plot_bokeh(
figsize=(800, 450),
simplify_shapes=10000,
show_figure=False,
xlim=[-170, -80],
ylim=[10, 70],
category="REGION",
colormap="Dark2",
legend="States",
show_colorbar=False,
)
#绘制人口的密度图
df_cities.plot_bokeh(
figure=figure, # <== pass figure here!
category="pop_max",
colormap="Viridis",
colormap_uselog=True,
size="size",
hovertool_string="""@name
Population: @pop_max
""",
marker="inverted_triangle",
legend="Cities",
)
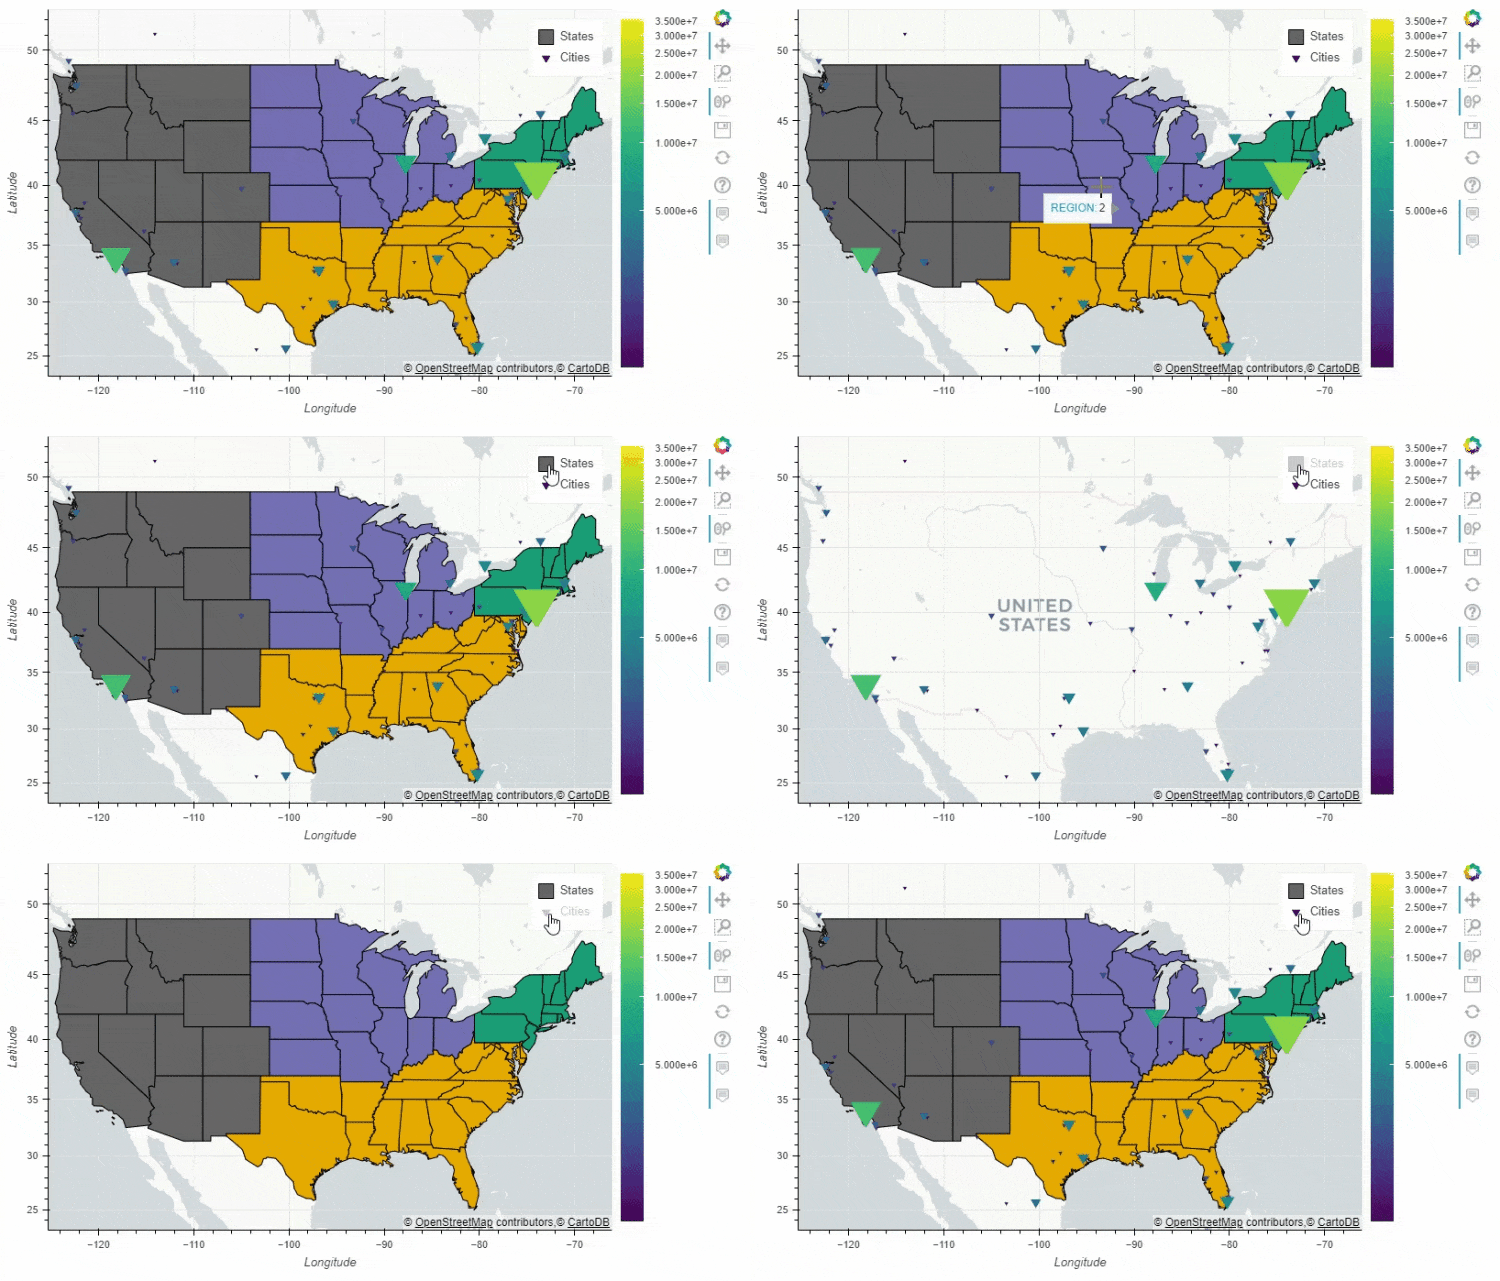
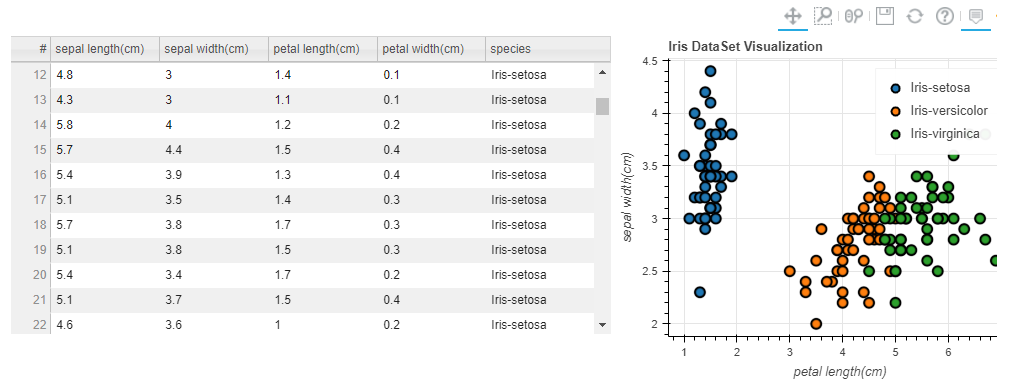
pandas_bokeh.plot_grid这个方法来将多个图结合起来,再来看几个简单的案例df = pd.read_csv("iris.csv")
from bokeh.models.widgets import DataTable, TableColumn
from bokeh.models import ColumnDataSource
data_table = DataTable(
columns=[TableColumn(field=Ci, title=Ci) for Ci in df.columns],
source=ColumnDataSource(df),
height=300,
)
# 创建散点图:
p_scatter = df.plot_bokeh.scatter(
x="petal length(cm)",
y="sepal width(cm)",
category="species",
title="Iris数据可视化",
show_figure=False,
)
# Combine Table and Scatterplot via grid layout:
pandas_bokeh.plot_grid([[data_table, p_scatter]], plot_width=400, plot_height=350)
output
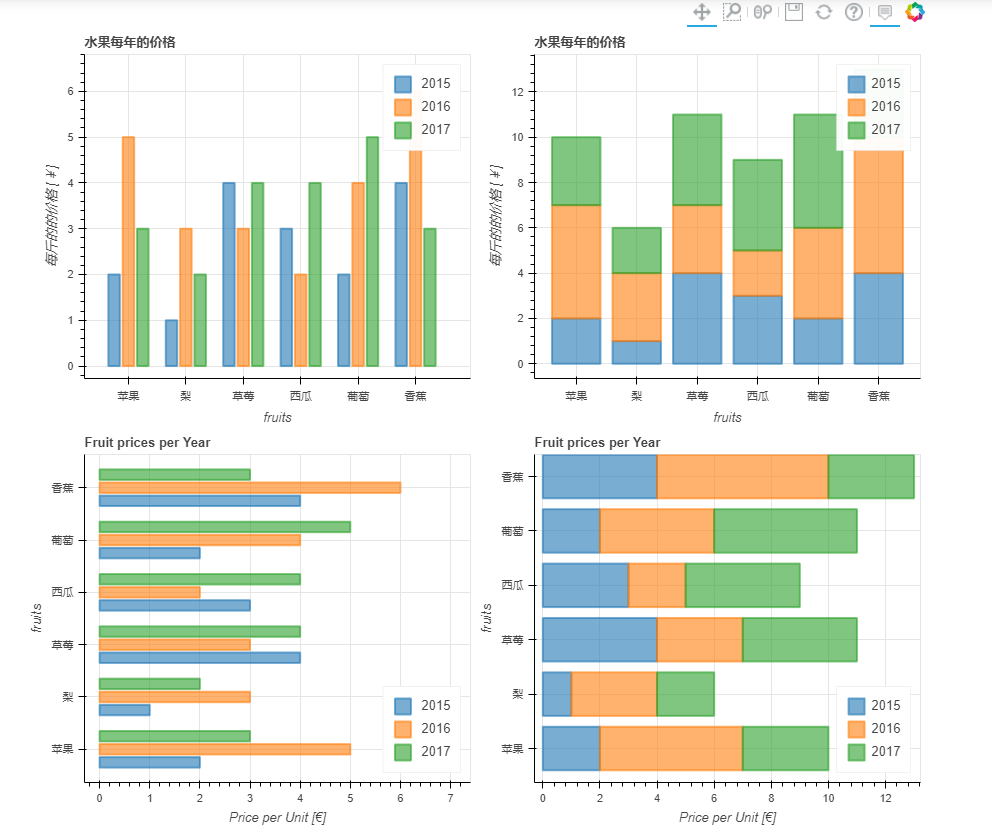
我们也可以借此多绘制几个直方图,然后组合起来
#重置表格的行索引:
df.reset_index(inplace=True)

#创建水平方向的直方图:
p_hbar = df.plot_bokeh(
    kind="barh",
    x="fruits",
    xlabel="Price per Unit [€]",
    title="Fruit prices per Year",
    alpha=0.6,
    legend = "bottom_right",
    show_figure=False)

#创建堆叠式的柱状图:
p_stacked_hbar = df.plot_bokeh.barh(
    x="fruits",
    stacked=True,
    xlabel="Price per Unit [€]",
    title="Fruit prices per Year",
    alpha=0.6,
    legend = "bottom_right",
    show_figure=False)

#Plot all barplot examples in a grid:
pandas_bokeh.plot_grid([[p_bar, p_stacked_bar],
                        [p_hbar, p_stacked_hbar]],
                       plot_width=450)
output

相关阅读:
评论
