用Plotly画出炫酷的数据可视化图表
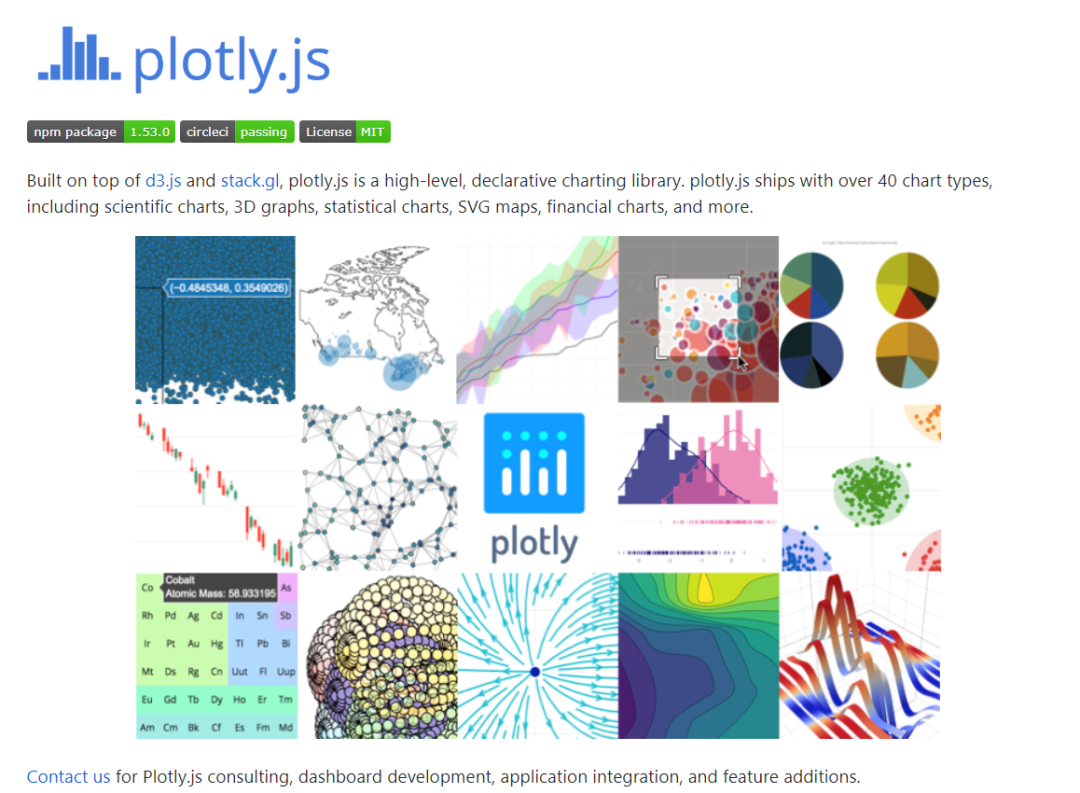
pip install plotly
import plotly.graph_objects as go
animals=['giraffes', 'orangutans', 'monkeys']

fig = go.Figure(data=[
    go.Bar(name='SF Zoo', x=animals, y=[20, 14, 23]),
    go.Bar(name='LA Zoo', x=animals, y=[12, 18, 29])
])
# Change the bar mode
fig.update_layout(barmode='group')
fig.show()
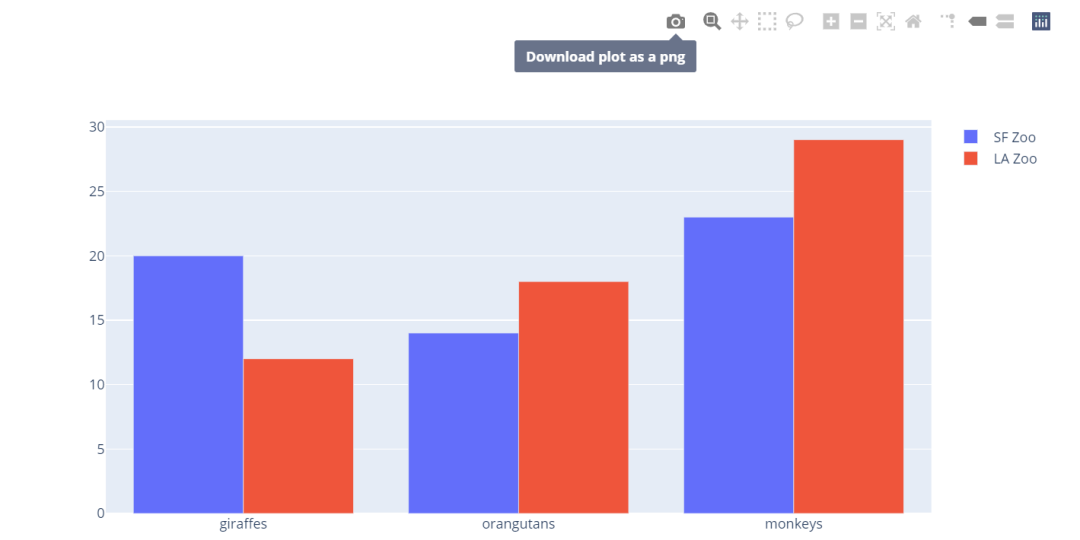
使用起来非常的方便,和matplotlylib画图步骤很像。
import plotly.express as px
data_canada = px.data.gapminder().query("country == 'Canada'")
fig = px.bar(data_canada, x='year', y='pop')
fig.show()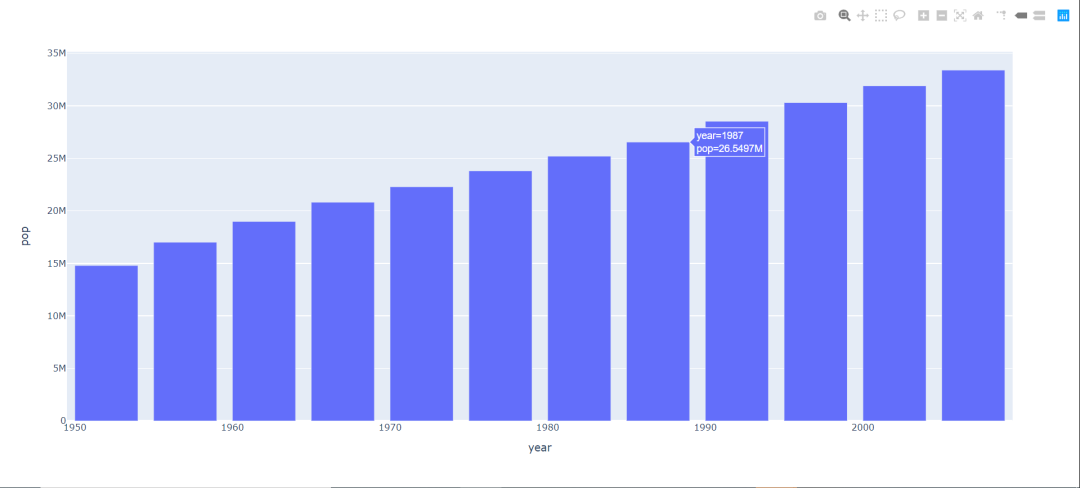
import plotly.express as px
data = px.data.gapminder()

data_canada = data[data.country == 'Canada']
fig = px.bar(data_canada, x='year', y='pop',
             hover_data=['lifeExp', 'gdpPercap'], color='lifeExp',
             labels={'pop':'population of Canada'}, height=400)
fig.show()

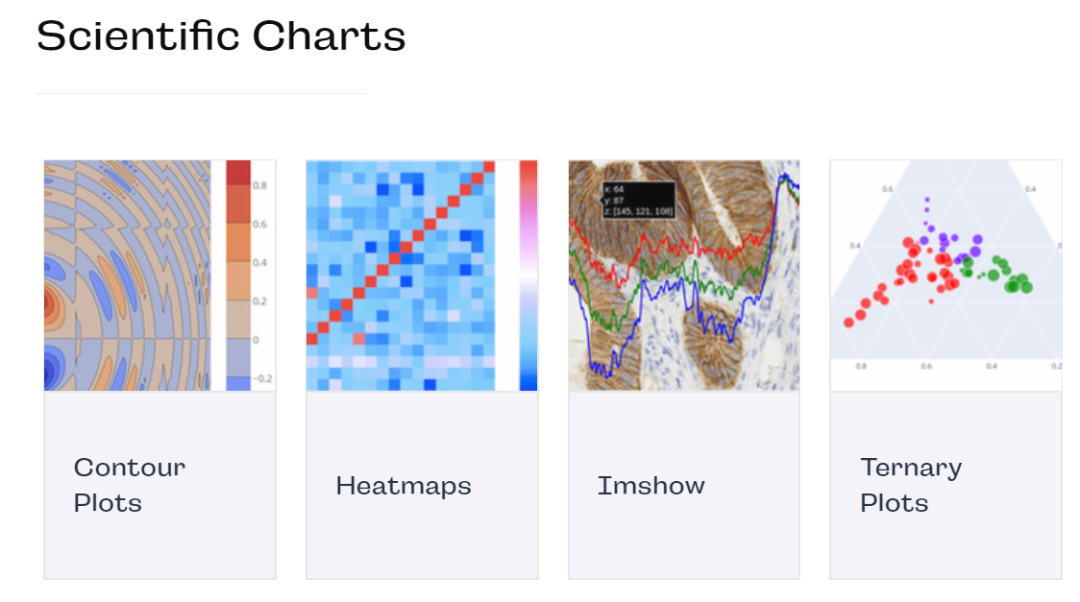
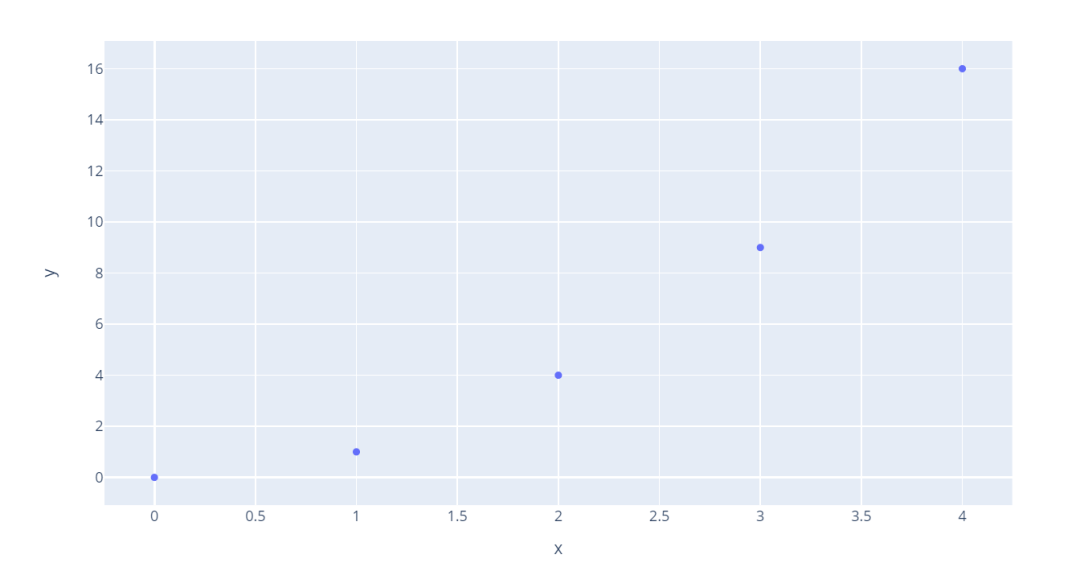
import plotly.express as px
fig = px.scatter(x=[0, 1, 2, 3, 4], y=[0, 1, 4, 9, 16])
fig.show()
import plotly.express as px
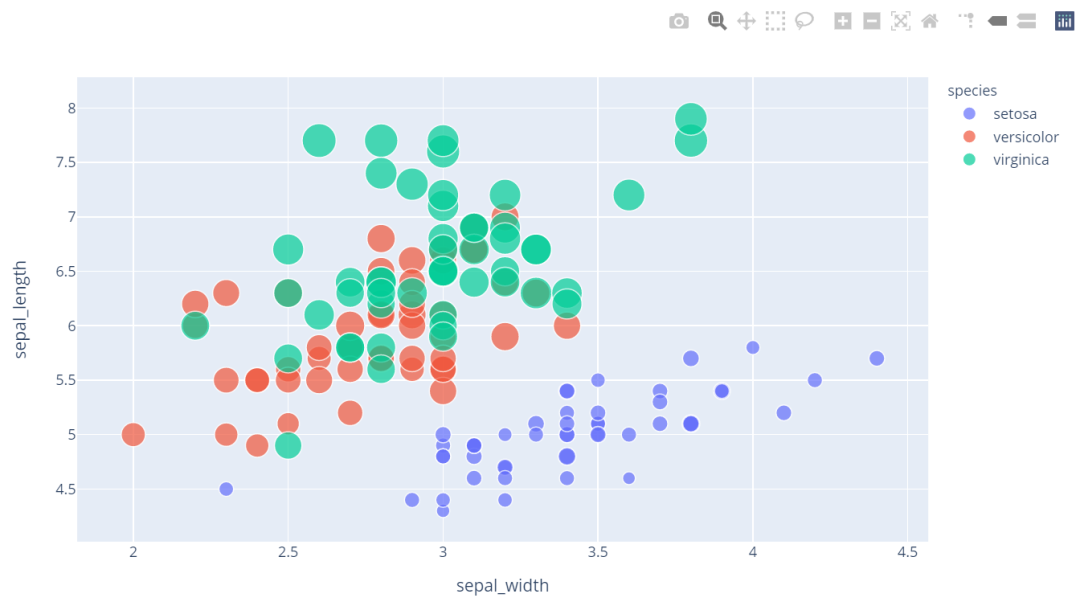
df = px.data.iris()  # px自带数据集
fig = px.scatter(df, x="sepal_width", y="sepal_length", color="species",
                 size='petal_length', hover_data=['petal_width'])
fig.show()
折线图
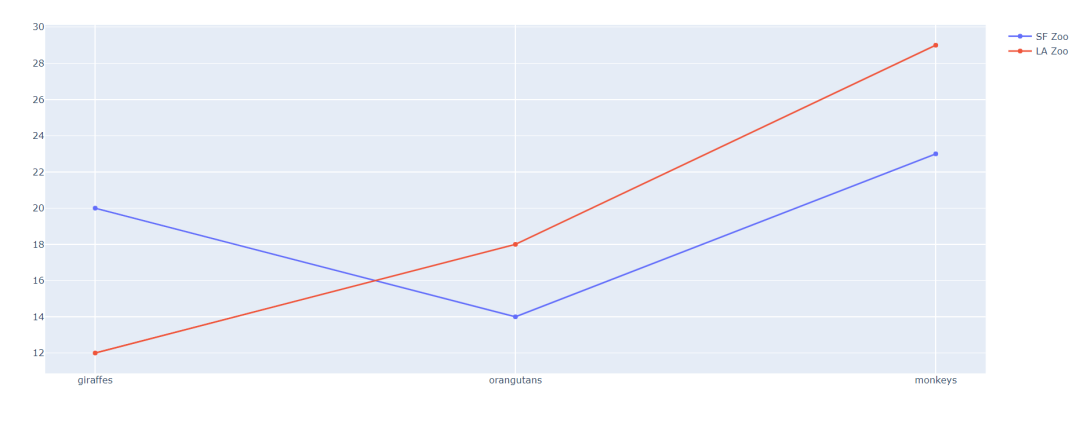
折线图可以显示随时间(根据常用比例设置)而变化的连续数据,因此非常适用于显示在相等时间间隔下数据的趋势。比如我们经常看到的监控数据图,一般都是折线图。
import plotly.graph_objects as go
animals = ['giraffes', 'orangutans', 'monkeys']

fig = go.Figure(data=[
    go.Scatter(name='SF Zoo', x=animals, y=[20, 14, 23]),
    go.Scatter(name='LA Zoo', x=animals, y=[12, 18, 29])
])
fig.show()
import plotly.graph_objects as go
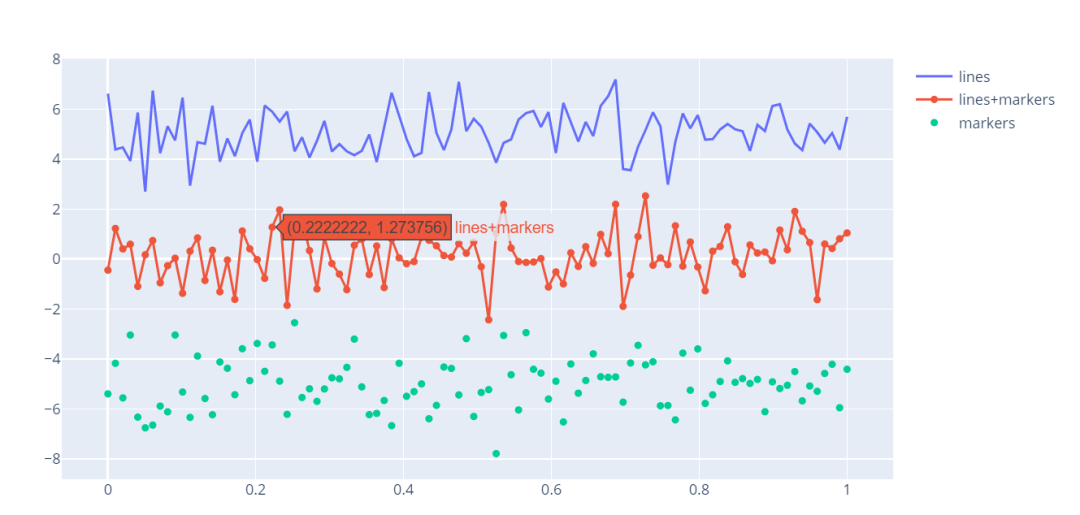
import numpy as np
np.random.seed(1)

N = 100
random_x = np.linspace(0, 1, N)
random_y0 = np.random.randn(N) + 5
random_y1 = np.random.randn(N)
random_y2 = np.random.randn(N) - 5

# Create traces
fig = go.Figure()
fig.add_trace(go.Scatter(x=random_x, y=random_y0,
                    mode='lines',
                    name='lines'))
fig.add_trace(go.Scatter(x=random_x, y=random_y1,
                    mode='lines+markers',
                    name='lines+markers'))
fig.add_trace(go.Scatter(x=random_x, y=random_y2,
                    mode='markers', name='markers'))

fig.show()
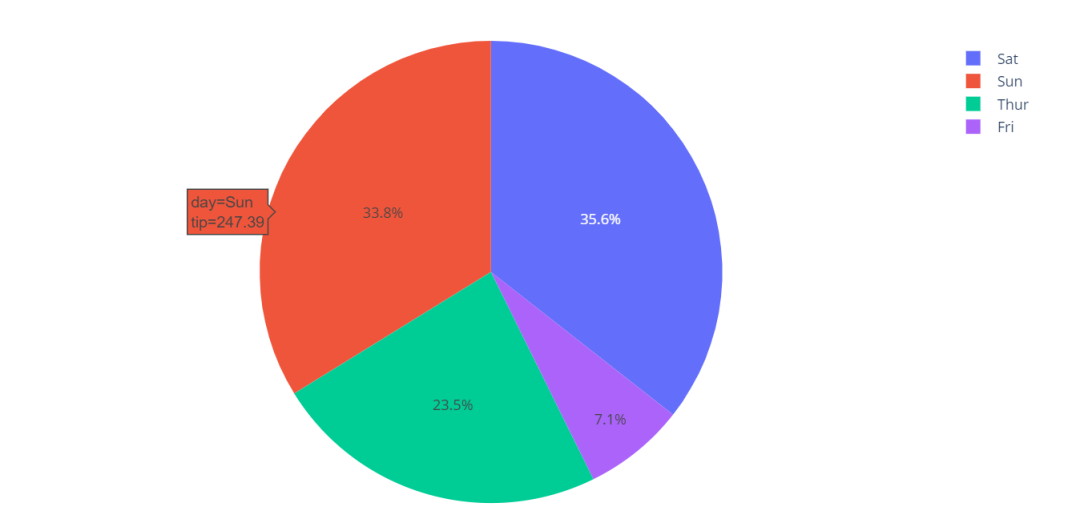
import plotly.express as px
# This dataframe has 244 lines, but 4 distinct values for `day`
df = px.data.tips()
fig = px.pie(df, values='tip', names='day')
fig.show()
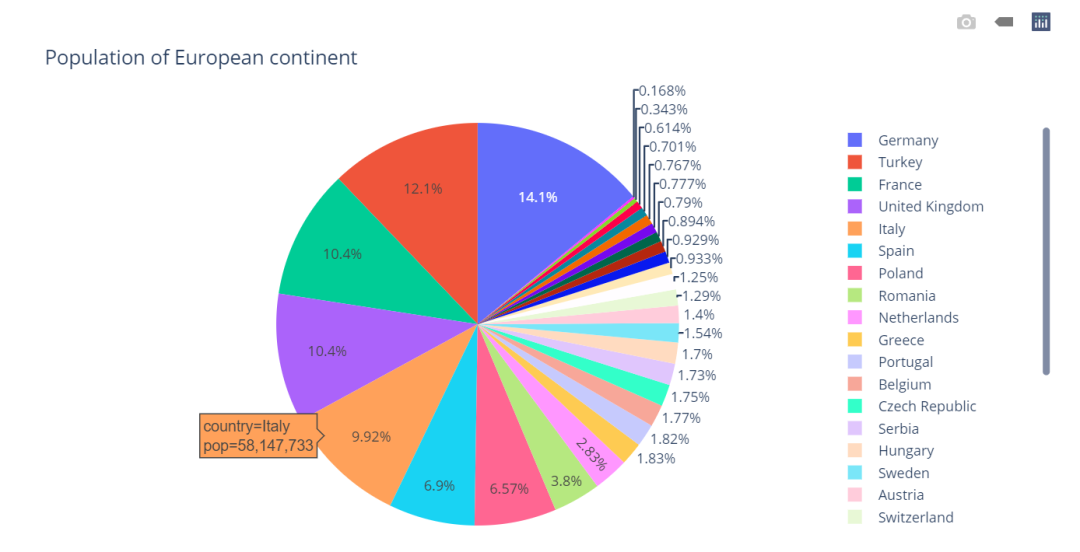
import plotly.express as px# plotly的自带数据集,类型:DataFramedf = px.data.gapminder().query("year == 2007").query("continent == 'Europe'")
df.loc[df['pop'] < 2.e6, 'country'] = 'Other countries' # Represent only large countries
fig = px.pie(df, values='pop', names='country', title='Population of European continent')
fig.show()
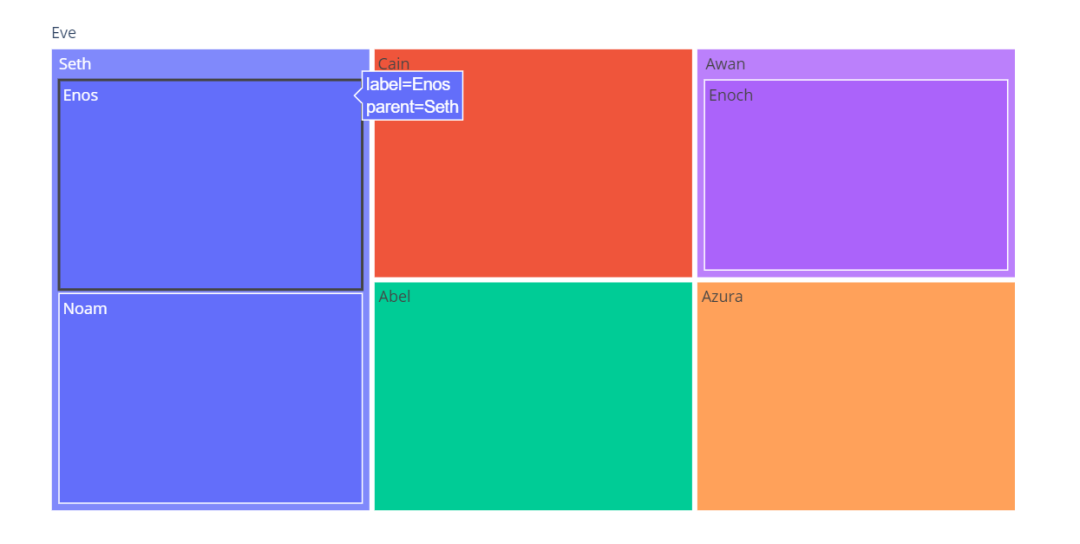
矩形树图适合展现具有层级关系的数据,能够直观体现同级之间的比较。一个Tree状结构转化为平面空间矩形的状态,就像一张地图,指引我们发现探索数据背后的故事。
矩形树图采用矩形表示层次结构里的节点,父子节点之间的层次关系用矩形之间的相互嵌套隐喻来表达。从根节点开始,屏幕空间根据相应的子节点数目被分为多个矩形,矩形的面积大小通常对应节点的属性。每个矩形又按照相应节点的子节点递归的进行分割,知道叶子节点为止。
import plotly.express as px
fig = px.treemap(
    names = ["Eve","Cain", "Seth", "Enos", "Noam", "Abel", "Awan", "Enoch", "Azura"],
    parents = ["", "Eve", "Eve", "Seth", "Seth", "Eve", "Eve", "Awan", "Eve"]
)
fig.show()
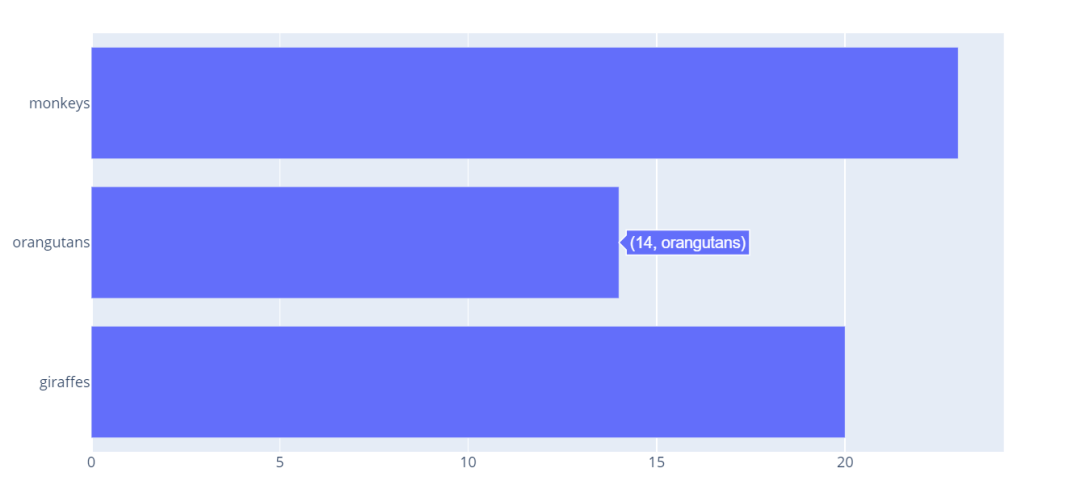
import plotly.graph_objects as go
# 修改水平参数即可
fig = go.Figure(go.Bar(
            x=[20, 14, 23],
            y=['giraffes', 'orangutans', 'monkeys'],
            orientation='h'))

fig.show()
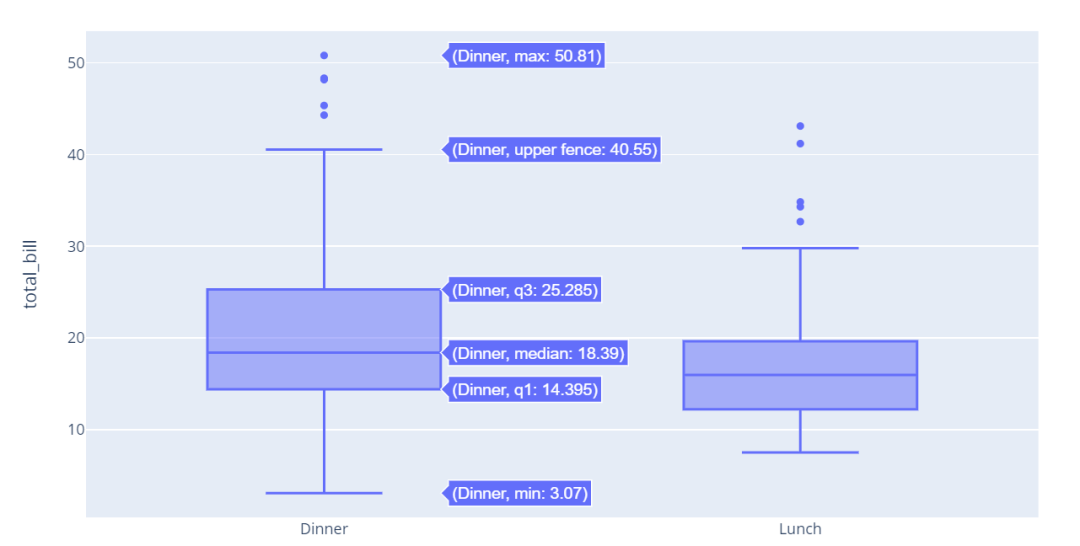
箱型图
箱形图(Box-plot)又称为盒式图或箱线图,是一种用作显示一组数据分散情况资料的统计图。因形状如箱子而得名。在各种领域也经常被使用,常见于品质管理。它主要用于反映原始数据分布的特征,还可以进行多组数据分布特征的比较。
import plotly.express as px
df = px.data.tips()
fig = px.box(df, x="time", y="total_bill")
fig.show()
import plotly.graph_objects as go

fig = go.Figure(data =
    go.Contour(
        z=[[10, 10.625, 12.5, 15.625, 20],
           [5.625, 6.25, 8.125, 11.25, 15.625],
           [2.5, 3.125, 5., 8.125, 12.5],
           [0.625, 1.25, 3.125, 6.25, 10.625],
           [0, 0.625, 2.5, 5.625, 10]]
    ))
fig.show()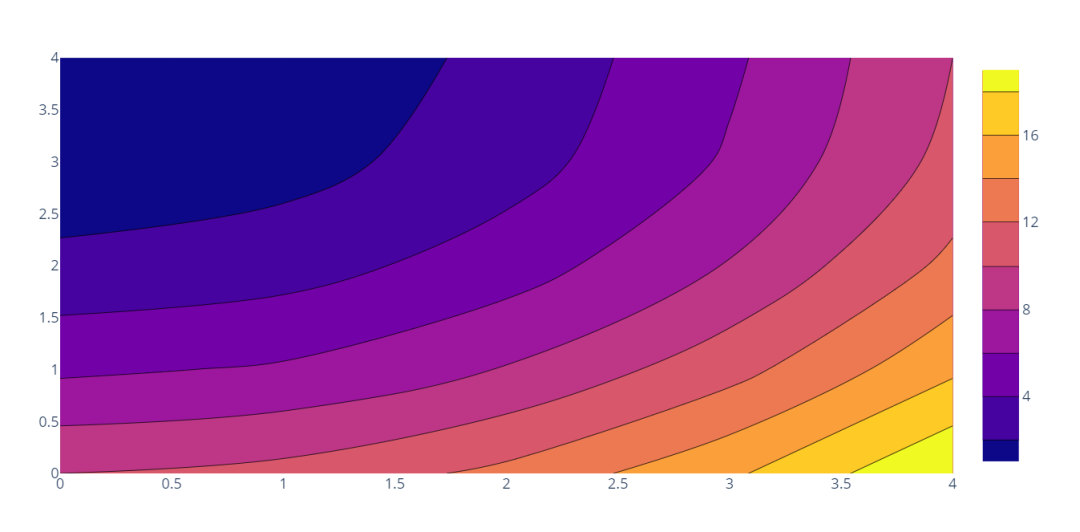
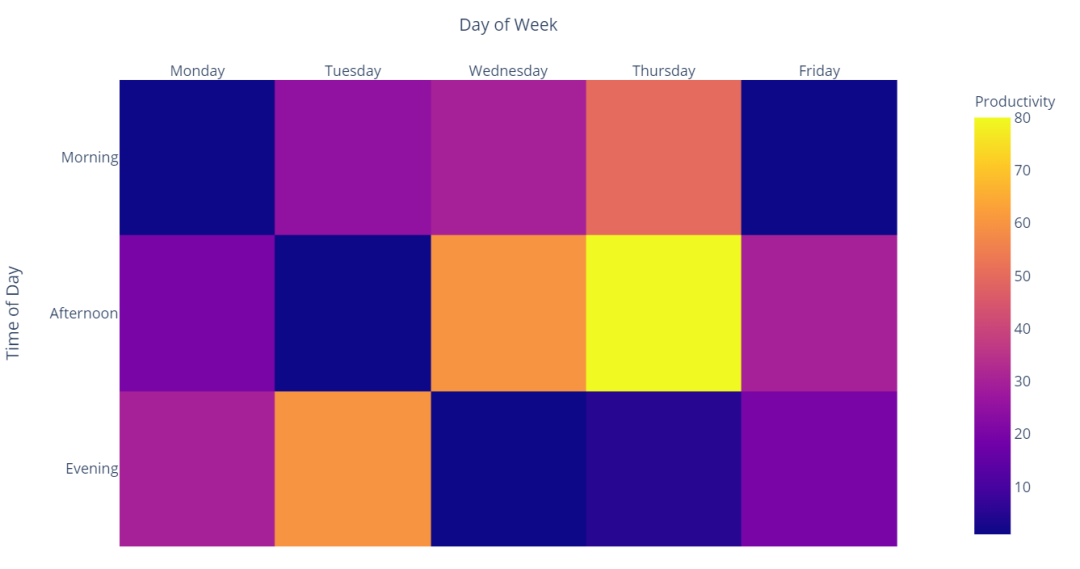
import plotly.express as px
data=[[1, 25, 30, 50, 1], [20, 1, 60, 80, 30], [30, 60, 1, 5, 20]]
fig = px.imshow(data,
                labels=dict(x="Day of Week", y="Time of Day", color="Productivity"),
                x=['Monday', 'Tuesday', 'Wednesday', 'Thursday', 'Friday'],
                y=['Morning', 'Afternoon', 'Evening']
               )
fig.update_xaxes(side="top")
fig.show()
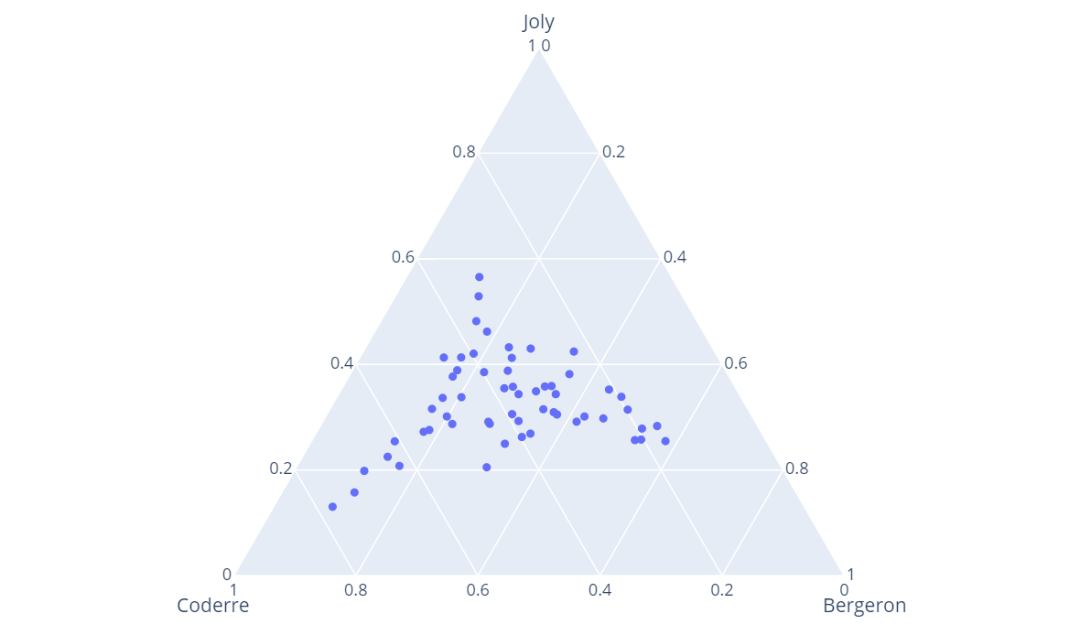
import plotly.express as px
df = px.data.election()
fig = px.scatter_ternary(df, a="Joly", b="Coderre", c="Bergeron")
fig.show()
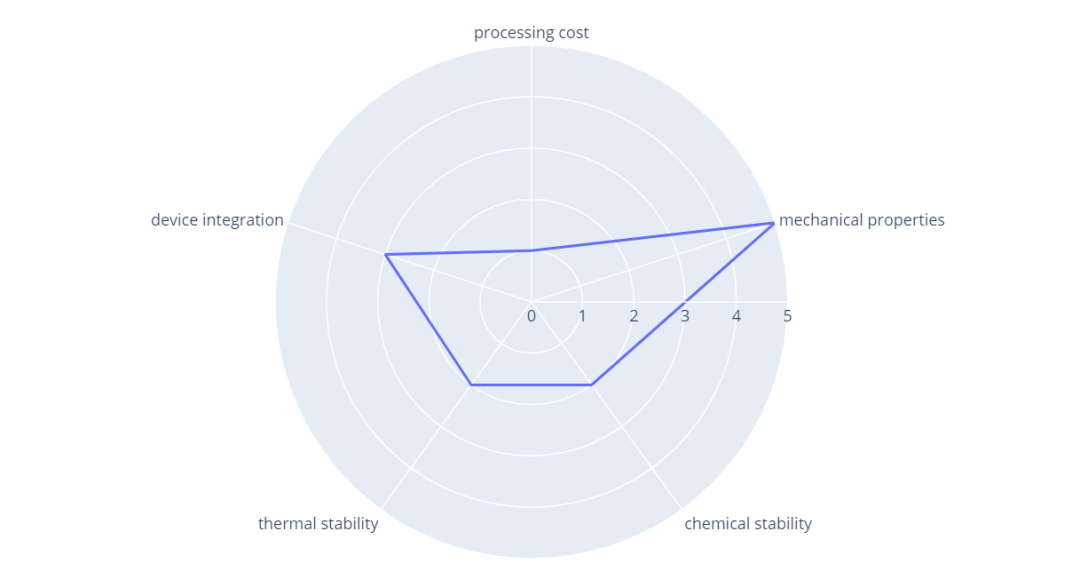
import plotly.express as px
import pandas as pd
df = pd.DataFrame(dict(
    r=[1, 5, 2, 2, 3],
    theta=['processing cost','mechanical properties','chemical stability',
           'thermal stability', 'device integration']))
fig = px.line_polar(df, r='r', theta='theta', line_close=True)
fig.show()
import plotly.express as px
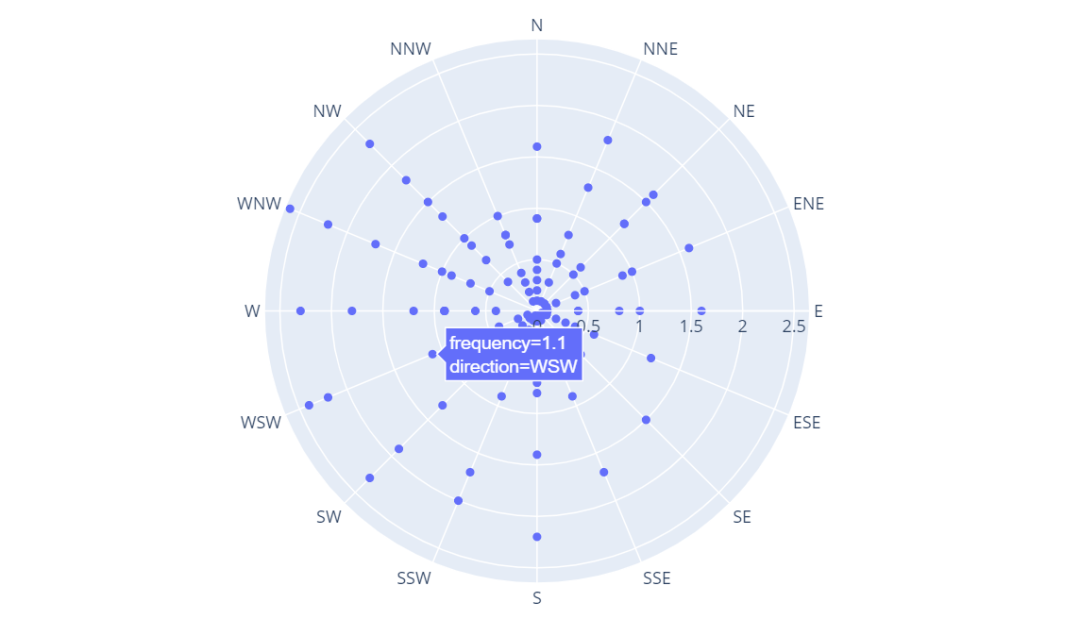
df = px.data.wind()
fig = px.scatter_polar(df, r="frequency", theta="direction")
fig.show()
import plotly.graph_objects as go

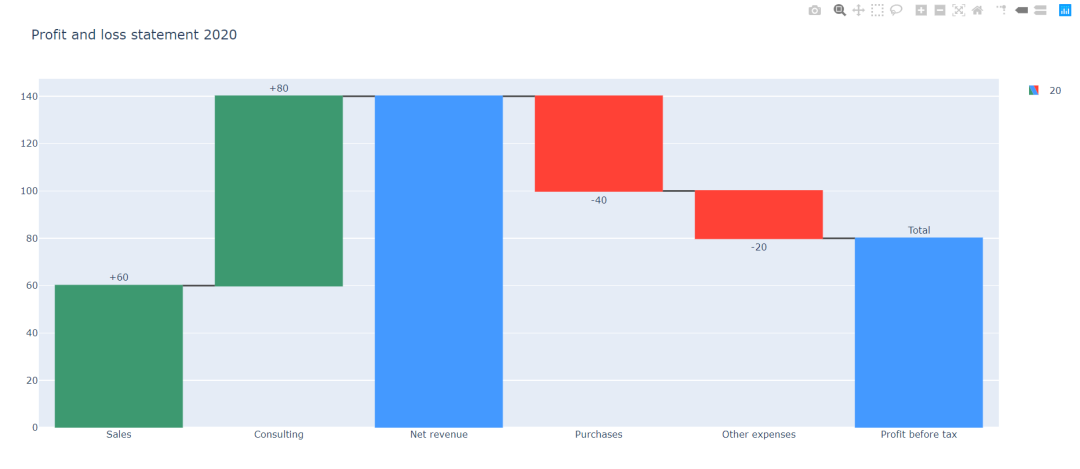
fig = go.Figure(go.Waterfall(
    name = "20", orientation = "v",
    measure = ["relative", "relative", "total", "relative", "relative", "total"],
    x = ["Sales", "Consulting", "Net revenue", "Purchases", "Other expenses", "Profit before tax"],
    textposition = "outside",
    text = ["+60", "+80", "", "-40", "-20", "Total"],
    y = [60, 80, 0, -40, -20, 0],
    connector = {"line":{"color":"rgb(63, 63, 63)"}},
))

fig.update_layout(
        title = "Profit and loss statement 2020",
        showlegend = True
)

fig.show()
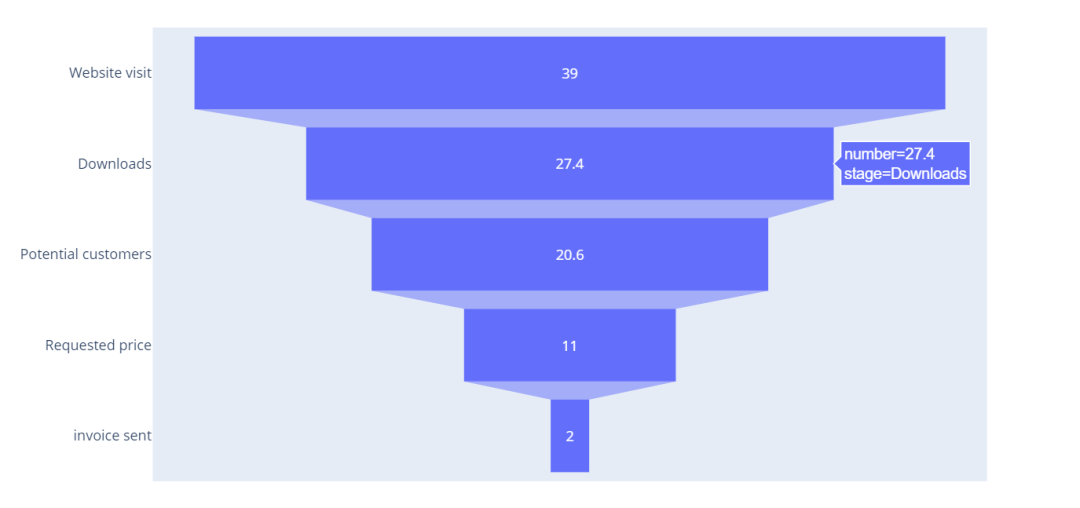
漏斗图
一般表述转化率(如营销客户转化),由上而下代表不同层级,转化率逐级降低并形成漏斗形状。
import plotly.express as px
data = dict(
    number=[39, 27.4, 20.6, 11, 2],
    stage=["Website visit", "Downloads", "Potential customers", "Requested price", "invoice sent"])
fig = px.funnel(data, x='number', y='stage')
fig.show()
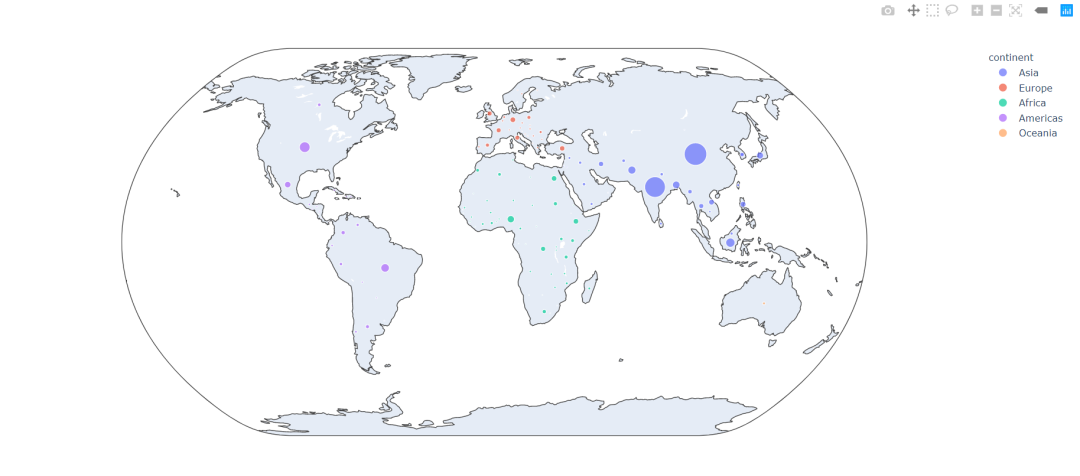
气泡分布图(含配置底图)
import plotly.express as px
df = px.data.gapminder().query("year==2007")
fig = px.scatter_geo(df, locations="iso_alpha", color="continent",
                     hover_name="country", size="pop",
                     projection="natural earth")
fig.show()
以上便是对 Plotly 的简单介绍。
如果文章对你有帮助,欢迎转发/点赞/收藏!
_往期文章推荐_
评论
