用 Python 教你画花样图

文 | 潮汐
来源:Python 技术「ID: pythonall」

在之前的一篇文章Python可视化神器-Plotly动画展示展现了可视化神器-Plotly的动画的基本应用,本文介绍如何在Python中使用 Plotly 创建地图并在地图上标相应的线。对于 Plotly的详解请参阅之前的文章。
地球仪加线
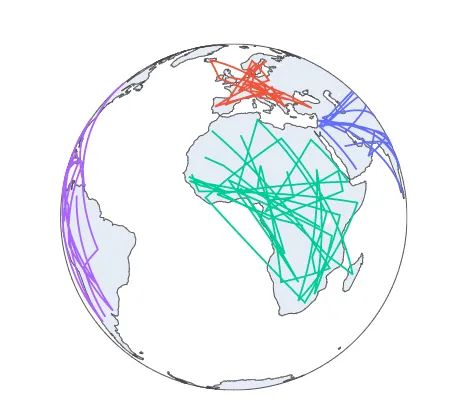
根据地球仪的区域显示在相应的位置图形上加上线条,完美的线性地球仪详细代码如下:
import plotly.express as px
df = px.data.gapminder().query("year == 2007")
fig = px.line_geo(df, locations="iso_alpha",
                  color="continent", # "continent" is one of the columns of gapminder
                  projection="orthographic")
fig.show()
显示结果为:**

地图上加线
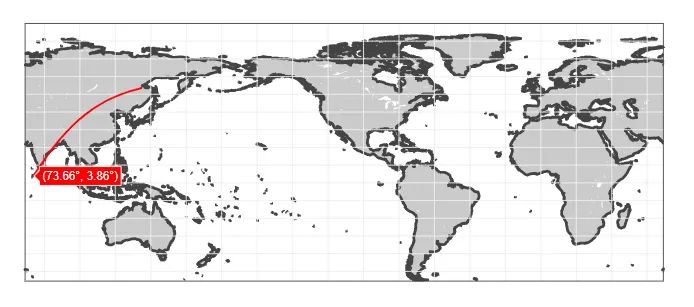
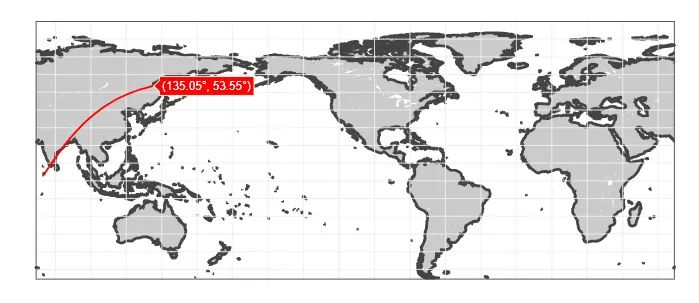
绘画出相应的地图后添加经纬度,再根据经纬度绘画出相应的线条, 详细代码如下:
import plotly.graph_objects as go

fig = go.Figure(data=go.Scattergeo(
    lat = [3.86, 53.55],
    lon = [73.66, 135.05],
    mode = 'lines',
    line = dict(width = 2, color = 'red'),
))

fig.update_layout(
    geo = dict(
        resolution = 50,
        showland = True,
        showlakes = True,
        landcolor = 'rgb(203, 203, 203)',
        countrycolor = 'rgb(204, 204, 204)',
        lakecolor = 'rgb(255, 255, 255)',
        projection_type = "equirectangular",
        coastlinewidth = 3,
        lataxis = dict(
            range = [20, 60],
            showgrid = True,
            dtick = 10
        ),
        lonaxis = dict(
            range = [-100, 20],
            showgrid = True,
            dtick = 20
        ),
    )
)

fig.show()
显示结果如下:


最后的福利-3D图鉴赏
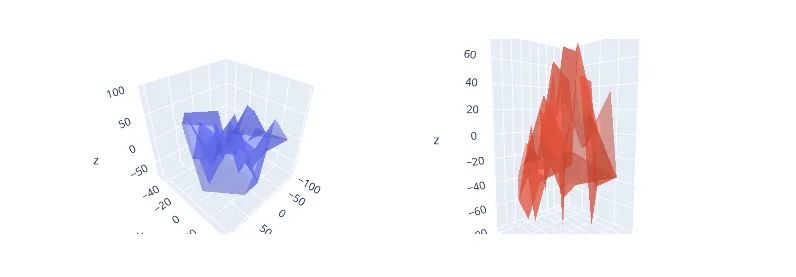
最后加入一个3D图像鉴赏,制作图像详细代码如下:
# 导入包
import plotly.graph_objects as go
from plotly.subplots import make_subplots
import numpy as np

N = 50

fig = make_subplots(rows=2, cols=2,
                    specs=[[{'is_3d': True}, {'is_3d': True}],
                           [{'is_3d': True}, {'is_3d': True}]],
                    print_grid=False)
for i in [1,2]:
    for j in [1,2]:
        fig.append_trace(
            go.Mesh3d(
                x=(50*np.random.randn(N)),
                y=(20*np.random.randn(N)),
                z=(40*np.random.randn(N)),
                opacity=0.5,
              ),
            row=i, col=j)

fig.update_layout(width=700, margin=dict(r=9, l=9, b=9, t=9))
# 将左上角子图中的比率固定为立方体
fig.update_layout(scene_aspectmode='cube')
# 手动强制z轴显示为其他两个的两倍大
fig.update_layout(scene2_aspectmode='manual',
                  scene2_aspectratio=dict(x=1, y=1, z=2))
# 绘制轴线与轴线范围的比例成比例
fig.update_layout(scene3_aspectmode='data')
# 使用“data”作为默认值自动生成比例良好的内容
fig.update_layout(scene4_aspectmode='auto')
#显示
fig.show()
显示结果如下:


总结
希望今天文章和实战对大家有所帮助,在以后的成神路上越来越顺利!
参考
https://plotly.com/python/animations/ https://plotly.com/python/maps/
PS:公号内回复「Python」即可进入Python 新手学习交流群,一起 100 天计划!
老规矩,兄弟们还记得么,右下角的 “在看” 点一下,如果感觉文章内容不错的话,记得分享朋友圈让更多的人知道!


【代码获取方式】
评论
