Python 动量交易策略分析阿里巴巴股票

你有没有注意到已经上涨的股票未来有继续上涨的趋势?同样,股票持续下跌似乎会导致更多的损失。这被称为动量,依赖于这些模式的策略是基于动量的策略。我们开发了一个基本的动量策略并在阿里巴巴(NYSE: BABA)这只股票上对其进行测试以查看回报。
动量交易策略,即Momentum Trading Strategy。在经典力学里,动量即物体质量和速度的乘积,动量一方面描述了物体的运动状态,另一方面也描述了惯性的大小。在证券市场上,我们也可以把“证券的价格”类比成运动的物体,价格上涨时,可以说价格有着上涨的动量,价格下跌时其具有下跌的动量。这种动量可能会使上涨或下跌继续维持下去,也可能该动量会越来越小,直到使之运动状态发生改变。股票资产组合的中期收益存在延续性,即中期价格具有向某一方向连续变动的动量效应。
投资者早就知道动量的影响,并发现这些影响出现在各种市场和时间范围内。在单一工具上运行这些策略也称为趋势跟踪或时间序列动量。我们将坚持使用后一个名称,并从现在开始将其缩写为 TSM。
虽然通过将其与一系列指标、风险管理因素和多样化相结合,有很多方法可以运行此策略,但我们将从简单开始展示。
首先,我们可以转向 Python 和一些标准库。
import numpy as npimport pandas as pdimport matplotlib.pyplot as pltimport yfinance as yf
从这里,我们可以构建称为 TSMStrategy 的基本策略函数。需要引入时间序列的收益对数、我们感兴趣的时期以及一个确定我们是否允许空头头寸的布尔变量。然后该函数将为我们模拟策略并返回性能的累积总和以供进一步分析。
def TSMStrategy(returns, period=1, shorts=False):if shorts:position = returns.rolling(period).mean().map(lambda x: -1 if x <= 0 else 1)else:position = returns.rolling(period).mean().map(lambda x: 0 if x <= 0 else 1)performance = position.shift(1) * returnsreturn performance
这是一个简单(但强大)策略的简单函数。下一步需要我们为它提供一些数据,看看它的表现如何。我将选择阿里巴巴的股票(NYSE: BABA)来看看我们的模型表现如何。
ticker = 'BABA'yfObj = yf.Ticker(ticker)data = yfObj.history(start='2014-01-01', end='2021-09-01')
使用 yfinance 包,我们可以获得 BABA 的全部公开历史。它于 2002 年开始交易,但将开始日期设置为 2000 年将使我们能够从头开始挑选股票而不会出现任何错误。
要将其传递给我们的策略,我们需要计算收益对数并将其提供给我们的函数。
returns = np.log(data['Close'] / data['Close'].shift(1)).dropna()我们可以实施的最简单的 TSM 策略,购买昨天上涨的股票,如果下跌则卖出(如果我们持有它,否则我们就等待)。让我们试一试。
performance = TSMStrategy(returns, period=1, shorts=False).dropna()years = (performance.max() - performance.min()).days / 365perf_cum = np.exp(performance.cumsum())tot = perf_cum[1] - 1ann = perf_cum[1] ** (1 / years) - 1vol = performance.std() * np.sqrt(252)rfr = 0.02sharpe = (ann - rfr) / volprint(f"1-day TSM Strategy yields:" +f"\n\t{tot*100:.2f}% total returns" +f"\n\t{ann*100:.2f}% annual returns" +f"\n\t{sharpe:.2f} Sharpe Ratio")baba_ret = np.exp(returns.cumsum())b_tot = baba_ret[-1] - 1b_ann = baba_ret[-1] ** (1 / years) - 1b_vol = returns.std() * np.sqrt(252)b_sharpe = (b_ann - rfr) / b_volprint(f"Baseline Buy-and-Hold Strategy yields:" +f"\n\t{b_tot*100:.2f}% total returns" +f"\n\t{b_ann*100:.2f}% annual returns" +f"\n\t{b_sharpe:.2f} Sharpe Ratio")
1-day TSM Strategy yields:225.03% total returns6.44% annual returns0.12 Sharpe RatioBaseline Buy-and-Hold Strategy yields:184.63% total returns5.70% annual returns0.07 Sharpe Ratio
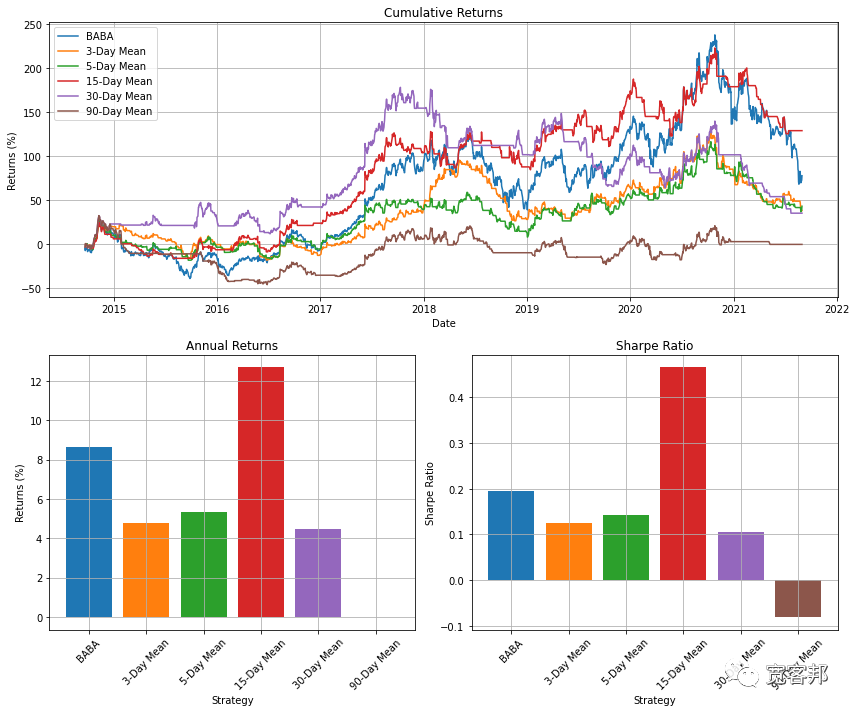
1 日 TSM 策略以合理的年度收益击败买入并持有策略(忽略交易成本,鉴于这种短期策略,交易成本可能很高)。1 天收益可能充满了许多错误趋势,因此我们可以运行各种不同的时间段来查看它们如何叠加。我们将在 3、5、15、30 和 90 天的时间段内循环运行我们的模型。
import matplotlib.gridspec as gridspecperiods = [3, 5, 15, 30, 90]fig = plt.figure(figsize=(12, 10))gs = fig.add_gridspec(4, 4)ax0 = fig.add_subplot(gs[:2, :4])ax1 = fig.add_subplot(gs[2:, :2])ax2 = fig.add_subplot(gs[2:, 2:])ax0.plot((np.exp(returns.cumsum()) - 1) * 100, label=ticker, linestyle='-')perf_dict = {'tot_ret': {'buy_and_hold': (np.exp(returns.sum()) - 1)}}perf_dict['ann_ret'] = {'buy_and_hold': b_ann}perf_dict['sharpe'] = {'buy_and_hold': b_sharpe}for p in periods:log_perf = TSMStrategy(returns, period=p, shorts=False)perf = np.exp(log_perf.cumsum())perf_dict['tot_ret'][p] = (perf[-1] - 1)ann = (perf[1] ** (1/years) - 1)perf_dict['ann_ret'][p] = annvol = log_perf.std() * np.sqrt(252)perf_dict['sharpe'] = (ann - rfr) / volax0.plot((perf - 1) * 100, label=f'{p}-Day Mean')ax0.set_ylabel('Returns (%)')ax0.set_xlabel('Date')ax0.set_title('Cumulative Returns')ax0.grid()ax0.legend()_ = [ax1.bar(i, v * 100) for i, v in enumerate(perf_dict['ann_ret'].values())]ax1.set_xticks([i for i, k in enumerate(perf_dict['ann_ret'])])ax1.set_xticklabels([f'{k}-Day Mean'if type(k) is int else ticker fork in perf_dict['ann_ret'].keys()],rotation=45)ax1.grid()ax1.set_ylabel('Returns (%)')ax1.set_xlabel('Strategy')ax1.set_title('Annual Returns')_ = [ax2.bar(i, v) for i, v in enumerate(perf_dict['sharpe'].values())]ax2.set_xticks([i for i, k in enumerate(perf_dict['sharpe'])])ax2.set_xticklabels([f'{k}-Day Mean'if type(k) is int else ticker fork in perf_dict['sharpe'].keys()],rotation=45)ax2.grid()ax2.set_ylabel('Sharpe Ratio')ax2.set_xlabel('Strategy')ax2.set_title('Sharpe Ratio')plt.tight_layout()plt.show()

从上图可知,15 天动量指标为我们提供了最佳的风险收益。但是,这些结果存在很大差异。这表明我们没有非常稳健的策略。我们可以在这个基本策略的基础上结合其他指标,例如移动平均线或指数加权移动平均线来表示动量。我们可以通过结合止损或追踪止损来更好地管理我们的风险,而不是在我们有 15 天下跌或持平时退出更接近顶部的交易。我们还可以在多种证券之间分配资本,从而从多样化中受益,并在趋势出现时跟随。其中一些改进需要更复杂的、事件驱动的回测系统来进行模拟。
