基于Python|“数据分析岗位”招聘情况分析!
统计与数据分析实战
共 7192字,需浏览 15分钟
·
2020-09-12 15:27

数据处理
数据分析
分析报告
import pandas as pdimport warningsimport numpy as npwarnings.simplefilter(action='ignore', category=FutureWarning)warnings.simplefilter(action='ignore', category=UserWarning)import matplotlib as mltimport matplotlib.pyplot as plt%matplotlib inline# 读取txt格式的数据dataset = pd.read_table(r'C:/Users/Administrator/Desktop/recruits.txt',low_memory = False)dataset.info()# 全览数据可以发现:数据缺少字段名RangeIndex: 1193846 entries, 0 to 1193845Data columns (total 13 columns):940864 1193846 non-null int64UI 1193846 non-null object用户界面(UI)设计 1193846 non-null object8001-10000 1193846 non-null object3-5 1193846 non-null object本科 1193846 non-null object全职 1193846 non-null object2017-11-15 1193846 non-null object1 1193846 non-null object杭州****技术有限公司 1193846 non-null object计算机软件 1193690 non-null object20-99 1193669 non-null object杭州 1193801 non-null objectdtypes: int64(1), object(12)memory usage: 118.4+ MB# 自定义字段名data = pd.read_table(r'C:/Users/Administrator/Desktop/recruits.txt',header = None,index_col = '序号',low_memory = False,names =['序号','岗位职责','岗位名称','薪资','工作时长','学历','职业类型','发布时间','招聘人数','公司名称','所处行业','公司规模','工作地点'])data.head()

# 自定义字段名添加成功data.info()# resultInt64Index: 1193847 entries, 940864 to 926760Data columns (total 12 columns):岗位职责 1193847 non-null object岗位名称 1193847 non-null object薪资 1193847 non-null object工作时长 1193847 non-null object学历 1193847 non-null object职业类型 1193847 non-null object发布时间 1193847 non-null object招聘人数 1193847 non-null object公司名称 1193847 non-null object所处行业 1193691 non-null object公司规模 1193670 non-null object工作地点 1193802 non-null objectdtypes: object(12)memory usage: 118.4+ MBNone# 重置索引data = data.reset_index()data.tail()

# 获取数据集的列名data.columns# resultIndex(['岗位职责', '岗位名称', '薪资', '工作时长', '学历', '职业类型', '发布时间', '招聘人数', '所处行业', '公司规模', '工作地点'],dtype='object')
# 转换数据集,去掉序号,去掉公司名称(脱敏)data = data[['岗位职责', '岗位名称', '薪资', '工作时长', '学历', '职业类型', '发布时间', '招聘人数','所处行业', '公司规模', '工作地点']]data.info()# resultdata = data[['岗位职责', '岗位名称', '薪资', '工作时长', '学历', '职业类型', '发布时间', '招聘人数','所处行业', '公司规模', '工作地点']]data.info()RangeIndex: 1193847 entries, 0 to 1193846Data columns (total 11 columns):岗位职责 1193847 non-null object岗位名称 1193847 non-null object薪资 1193847 non-null object工作时长 1193847 non-null object学历 1193847 non-null object职业类型 1193847 non-null object发布时间 1193847 non-null object招聘人数 1193847 non-null object所处行业 1193691 non-null object公司规模 1193670 non-null object工作地点 1193802 non-null objectdtypes: object(11)memory usage: 100.2+ MBdata.head(10)

# 查看数据集是否存在异常值print('最早发布时间:',data['发布时间'].unique().min(),',最晚发布时间:',data['发布时间'].unique().max())# 可以发现:发布时间异常最早发布时间:1970-01-01 ,最晚发布时间:2017-11-23# 查看异常数据data[(data['发布时间']<'2017-01-01')]

# 仅保留17年及以后的招聘信息data = data[(data['发布时间']>='2017-01-01')]# 重复值统计data.duplicated().sum()# result35950# 去重data.drop_duplicates(inplace=True)# 再次查看数据集情况,发现存在空值data.info()# resultInt64Index: 1157827 entries, 0 to 1193846Data columns (total 11 columns):岗位职责 1157827 non-null object岗位名称 1157827 non-null object薪资 1157827 non-null object工作时长 1157827 non-null object学历 1157827 non-null object职业类型 1157827 non-null object发布时间 1157827 non-null object招聘人数 1157827 non-null object所处行业 1157674 non-null object公司规模 1157667 non-null object工作地点 1157796 non-null objectdtypes: object(11)memory usage: 106.0+ MB# 空值处理:统计空值数量data.isnull().sum()# result岗位职责 0岗位名称 0薪资 0工作时长 0学历 0职业类型 0发布时间 0招聘人数 0所处行业 153公司规模 160工作地点 31dtype: int64# 公司规模列空值较多,可具体查看data[data['公司规模'].isnull()]

# 删除空值data.dropna(inplace=True)# 再次查看,发现所有数据都处理完毕data.info()# resultInt64Index: 1157647 entries, 0 to 1193846Data columns (total 11 columns):岗位职责 1157647 non-null object岗位名称 1157647 non-null object薪资 1157647 non-null object工作时长 1157647 non-null object学历 1157647 non-null object职业类型 1157647 non-null object发布时间 1157647 non-null object招聘人数 1157647 non-null object所处行业 1157647 non-null object公司规模 1157647 non-null object工作地点 1157647 non-null objectdtypes: object(11)memory usage: 106.0+ MB
# 仅选择数据分析师岗位进行分析,大家还可以进行数据分析专员等分析data_da = data[data['岗位名称']=='数据分析师'].copy() # 不加copy()容易警告:SettingWithCopyWarningdata_da[ data_da['招聘人数']=='若干'] # 为了分析的方便,去掉“若干”情况

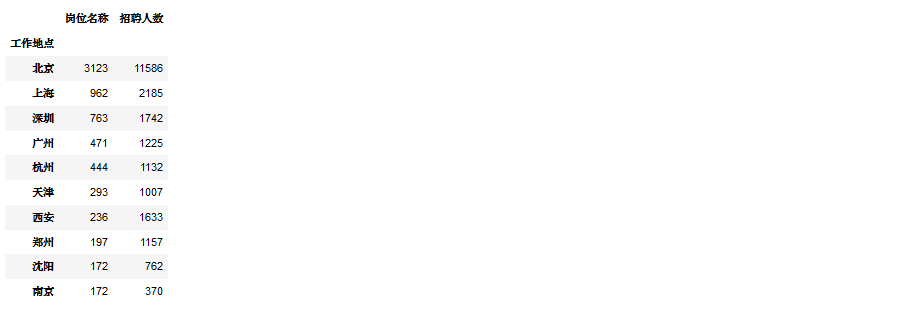
# 数据处理,重新赋值data_da.loc[ data_da['招聘人数']=='若干','招聘人数'] = 0data_da['招聘人数'].value_counts()# result135313 95759492 93467224 43282427 1621014512 7830719 29201518 1415760 40225 116113 1Name: 招聘人数, dtype: int64# 查看招聘人数data_da['招聘人数'] = data_da['招聘人数'].astype(int)grb = data_da.groupby(['工作地点']).agg({'岗位名称':'count','招聘人数':sum}).sort_values(by = '岗位名称',ascending = False).head(10)grb

# 绘图说明不同城市对数据分析师的需求数量grb.plot(kind = 'bar',figsize=(10,5),fontsize=12)plt.legend(['岗位数量','招聘人数'])plt.xlabel('工作地点',fontsize=15)plt.show()

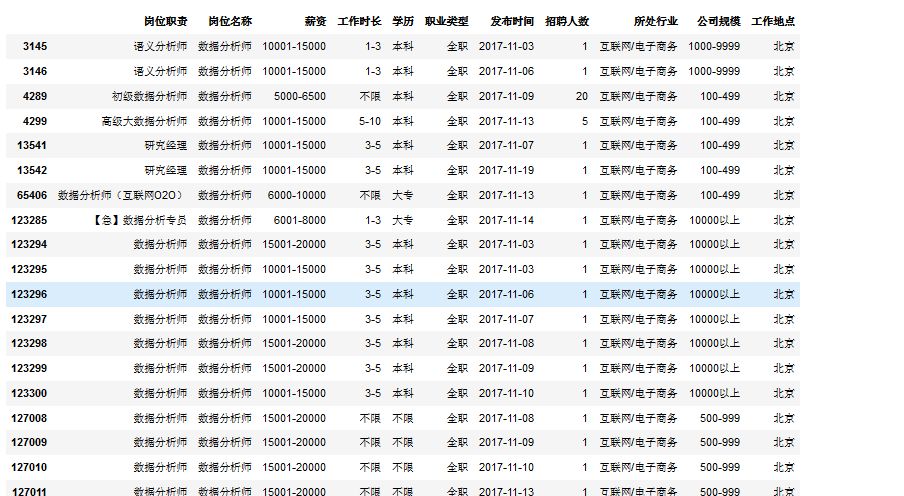
# 查看所处行业情况data['所处行业'].value_counts().head(10)# result互联网/电子商务 267519计算机软件 261188IT服务(系统/数据/维护) 95320教育/培训/院校 94988专业服务/咨询(财会/法律/力资源等) 52931媒体/出版/影视/文化传播 49300基金/证券/期货/投资 32005电子技术/半导体/集成电路 28652房地产/建筑/建材/工程 25118通信/电信/网络设备 24828Name: 所处行业, dtype: int64# 筛选出北京地区互联网公司数据分析师招聘数据subdata = data[data['所处行业'].isin(['互联网/电子商务'])][(data['岗位名称']=='数据分析师')&(data['工作地点']=='北京')]subdata.iloc[:20,:]

# 学历因素subdata['学历'].value_counts(normalize = True)# result本科 0.568910硕士 0.174679大专 0.142628不限 0.113782Name: 学历, dtype: float64# 其他城市可能会用到-- subdata[subdata['学历'].isin(['中专','中技'])]-- subdata.loc[(subdata['学历']=='中专')|(subdata['学历']=='中技'),'学历'] = '不限'# 绘图说明数据分析师对学历的要求subdata['学历'].value_counts(normalize = True)plt.pie(subdata['学历'].value_counts(normalize = True),labels = ['本科','硕士','大专','不限'],autopct='%.1f%%',startangle=180)plt.show()plt.close()

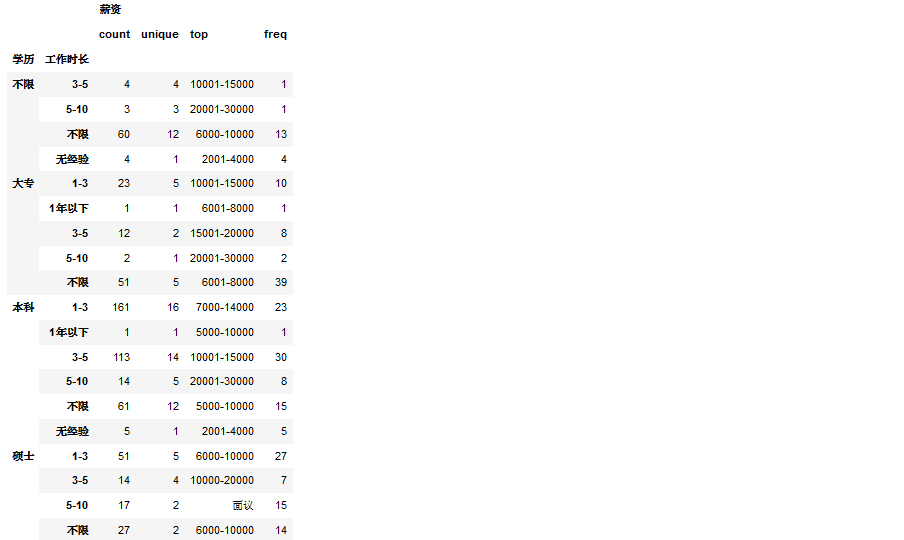
# 薪资情况subdata.groupby(['学历','工作时长'])[['薪资']].describe()


评论
