这40个Python可视化图表案例,强烈建议收藏!

导读:Python图表大全,40个种类,总计约400个示例图表。
import seaborn as sns
import matplotlib.pyplot as plt

# 加载数据
df = sns.load_dataset('iris', data_home='seaborn-data', cache=True)

# 绘图显示
sns.violinplot(x=df["species"], y=df["sepal_length"])
plt.show()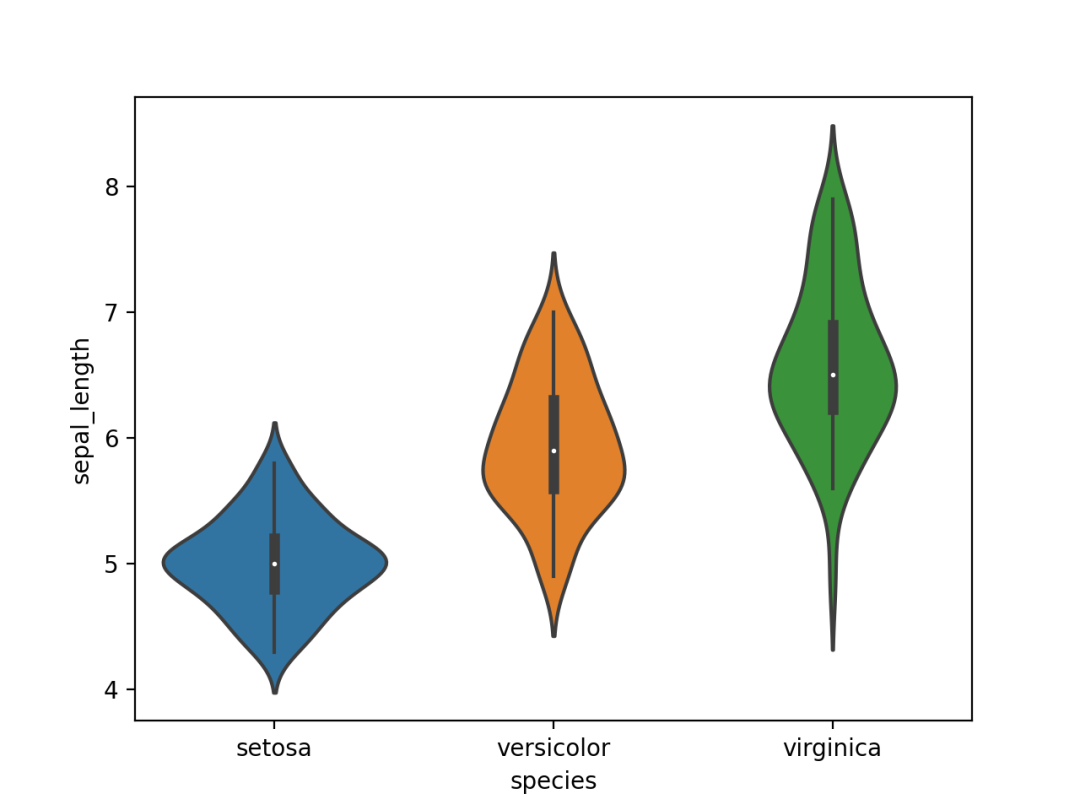
import seaborn as sns
import matplotlib.pyplot as plt

# 加载数据
df = sns.load_dataset('iris', data_home='seaborn-data', cache=True)

# 绘图显示
sns.kdeplot(df['sepal_width'])
plt.show()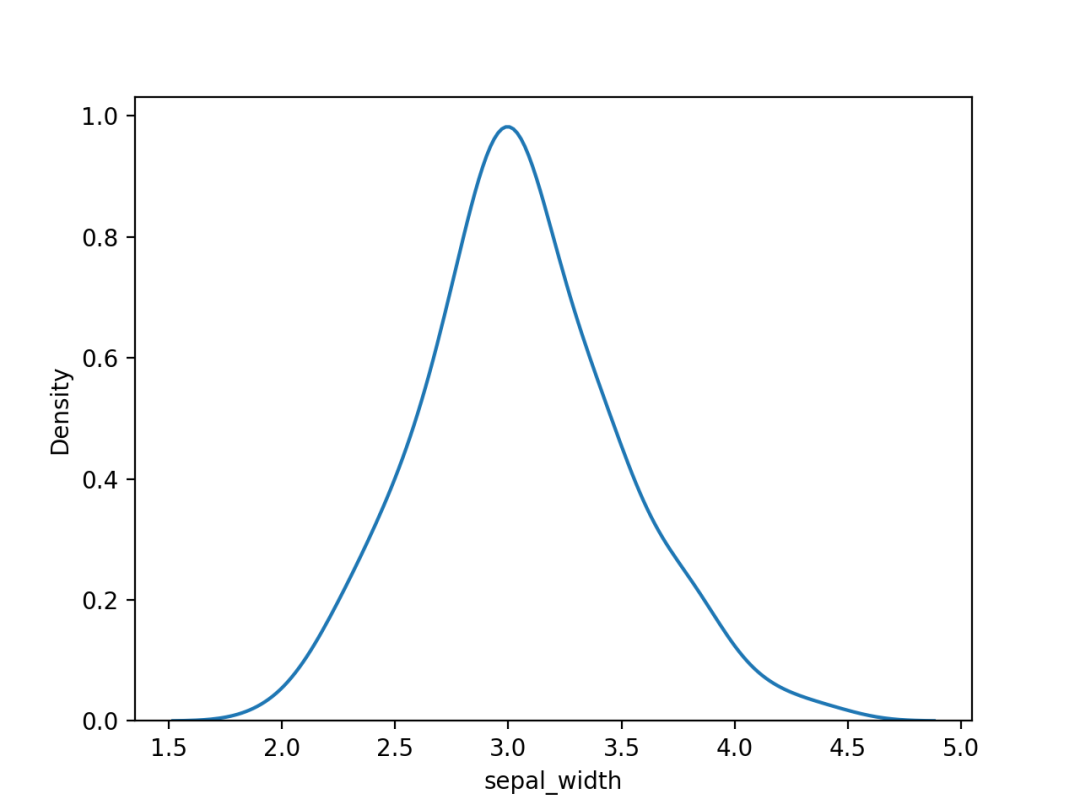
import seaborn as sns
import matplotlib.pyplot as plt

# 加载数据
df = sns.load_dataset('iris', data_home='seaborn-data', cache=True)

# 绘图显示
sns.distplot(a=df["sepal_length"], hist=True, kde=False, rug=False)
plt.show()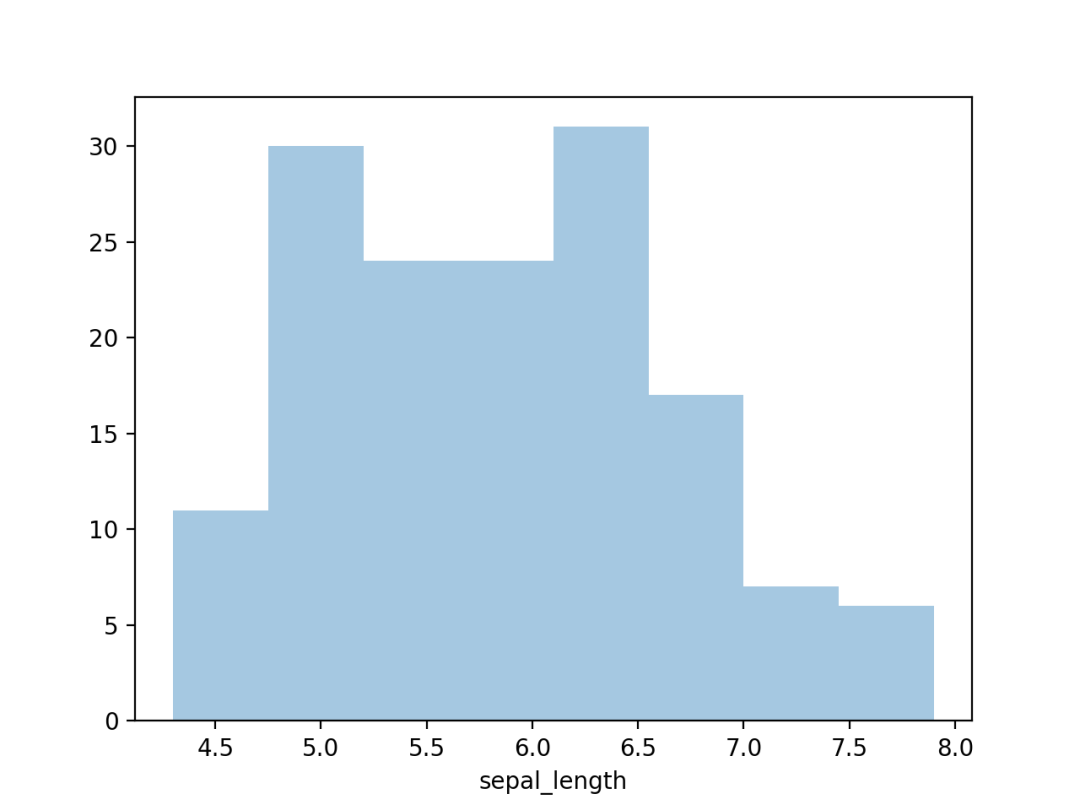
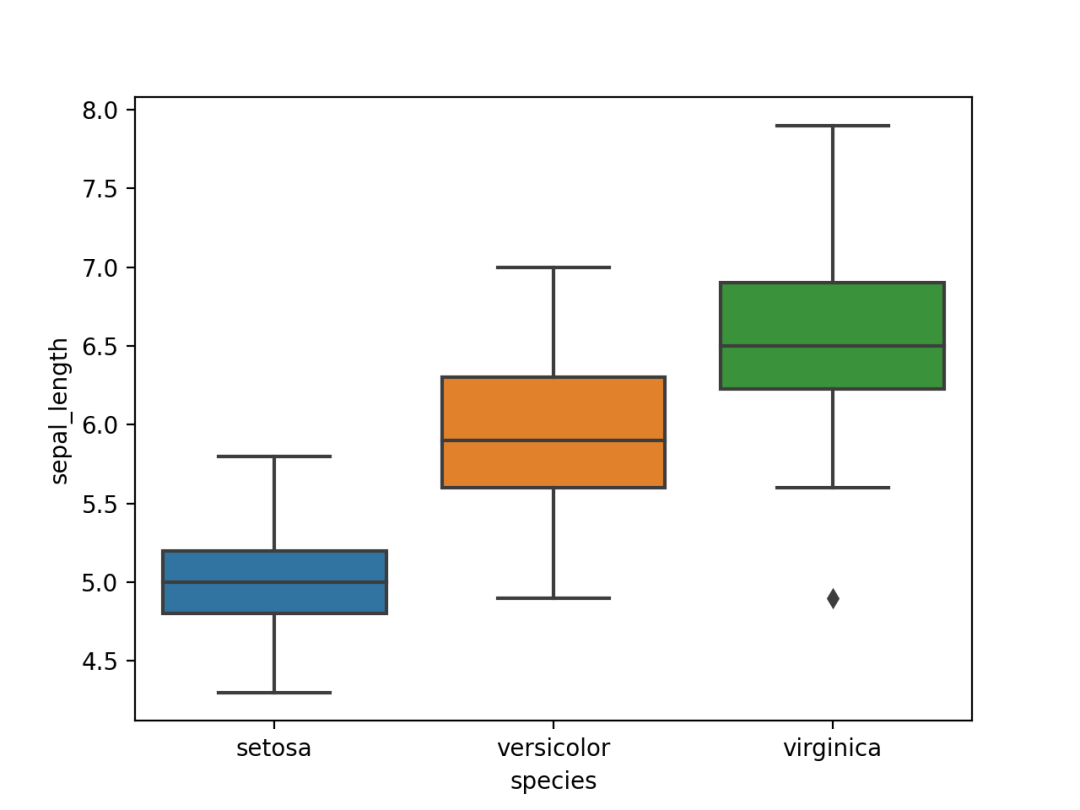
import seaborn as sns
import matplotlib.pyplot as plt

# 加载数据
df = sns.load_dataset('iris', data_home='seaborn-data', cache=True)

# 绘图显示
sns.boxplot(x=df["species"], y=df["sepal_length"])
plt.show()
import plotly.graph_objects as go
import numpy as np
import pandas as pd

# 读取数据
temp = pd.read_csv('2016-weather-data-seattle.csv')
# 数据处理, 时间格式转换
temp['year'] = pd.to_datetime(temp['Date']).dt.year

# 选择几年的数据展示即可
year_list = [1950, 1960, 1970, 1980, 1990, 2000, 2010]
temp = temp[temp['year'].isin(year_list)]

# 绘制每年的直方图,以年和平均温度分组,并使用'count'函数进行汇总
temp = temp.groupby(['year', 'Mean_TemperatureC']).agg({'Mean_TemperatureC': 'count'}).rename(columns={'Mean_TemperatureC': 'count'}).reset_index()

# 使用Plotly绘制脊线图,每个轨迹对应于特定年份的温度分布
# 将每年的数据(温度和它们各自的计数)存储在单独的数组,并将其存储在字典中以方便检索
array_dict = {}
for year in year_list:
    # 每年平均温度
    array_dict[f'x_{year}'] = temp[temp['year'] == year]['Mean_TemperatureC']
    # 每年温度计数
    array_dict[f'y_{year}'] = temp[temp['year'] == year]['count']
    array_dict[f'y_{year}'] = (array_dict[f'y_{year}'] - array_dict[f'y_{year}'].min()) \
                              / (array_dict[f'y_{year}'].max() - array_dict[f'y_{year}'].min())

# 创建一个图像对象
fig = go.Figure()
for index, year in enumerate(year_list):
    # 使用add_trace()绘制轨迹
    fig.add_trace(go.Scatter(
        x=[-20, 40], y=np.full(2, len(year_list) - index),
        mode='lines',
        line_color='white'))

    fig.add_trace(go.Scatter(
        x=array_dict[f'x_{year}'],
        y=array_dict[f'y_{year}'] + (len(year_list) - index) + 0.4,
        fill='tonexty',
        name=f'{year}'))

    # 添加文本
    fig.add_annotation(
        x=-20,
        y=len(year_list) - index,
        text=f'{year}',
        showarrow=False,
        yshift=10)

# 添加标题、图例、xy轴参数
fig.update_layout(
    title='1950年~2010年西雅图平均温度',
    showlegend=False,
    xaxis=dict(title='单位: 摄氏度'),
    yaxis=dict(showticklabels=False)
)

# 跳转网页显示
fig.show()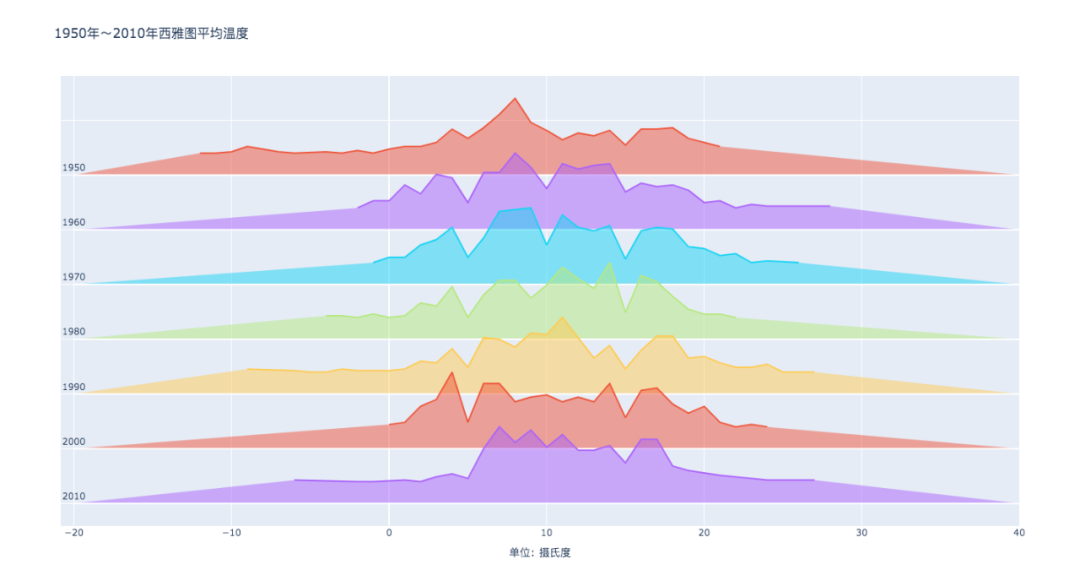
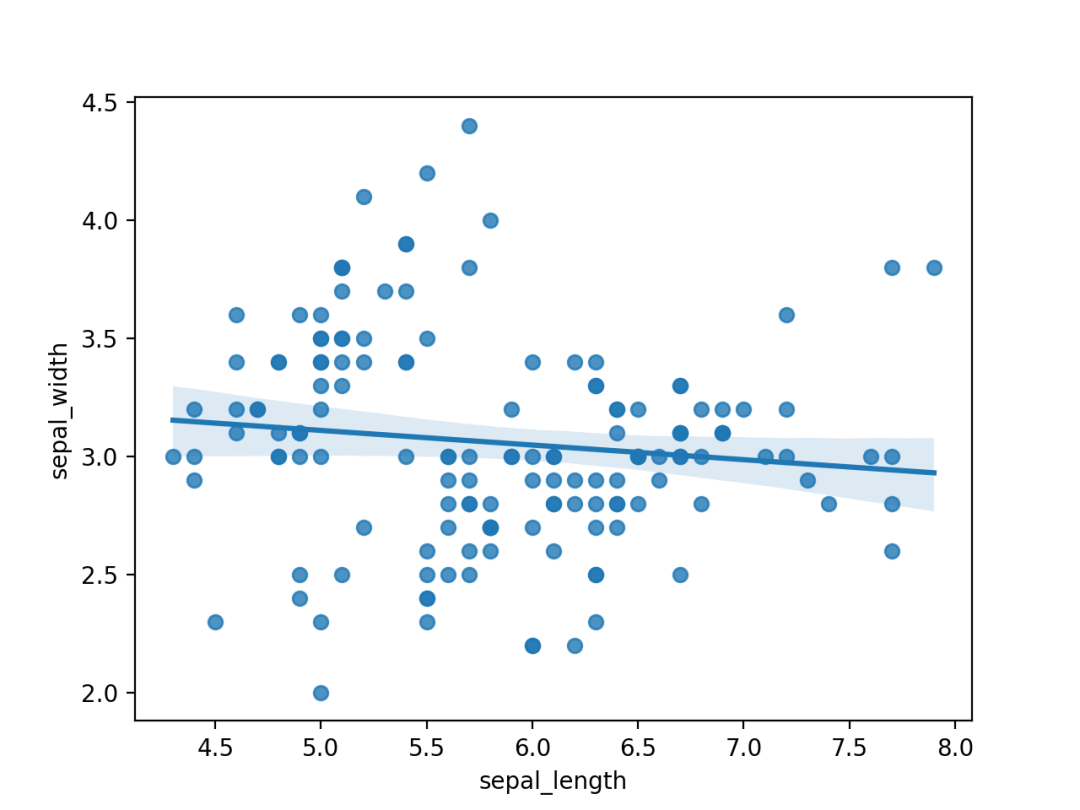
import seaborn as sns
import matplotlib.pyplot as plt

# 加载数据
df = sns.load_dataset('iris', data_home='seaborn-data', cache=True)

# 绘图显示
sns.regplot(x=df["sepal_length"], y=df["sepal_width"])
plt.show()
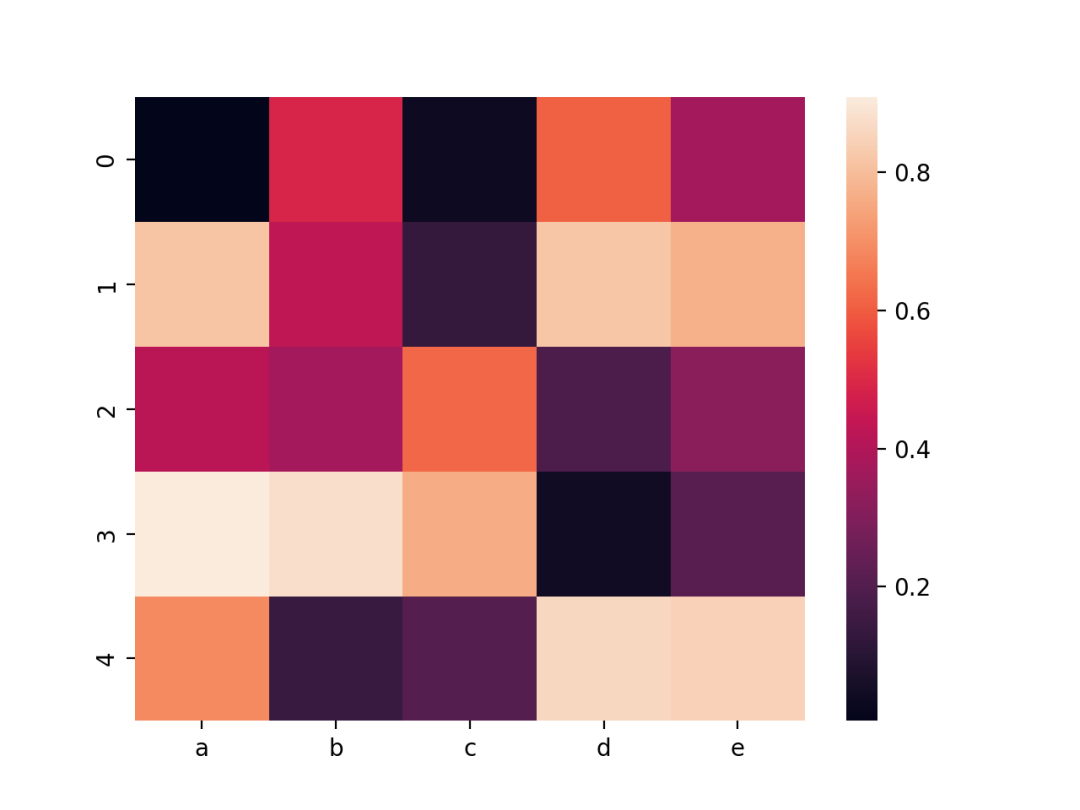
import seaborn as sns
import pandas as pd
import numpy as np

# Create a dataset
df = pd.DataFrame(np.random.random((5,5)), columns=["a","b","c","d","e"])

# Default heatmap
p1 = sns.heatmap(df)
import seaborn as sns
import matplotlib.pyplot as plt

# 加载数据
df = sns.load_dataset('iris', data_home='seaborn-data', cache=True)

# 绘图显示
sns.pairplot(df)
plt.show()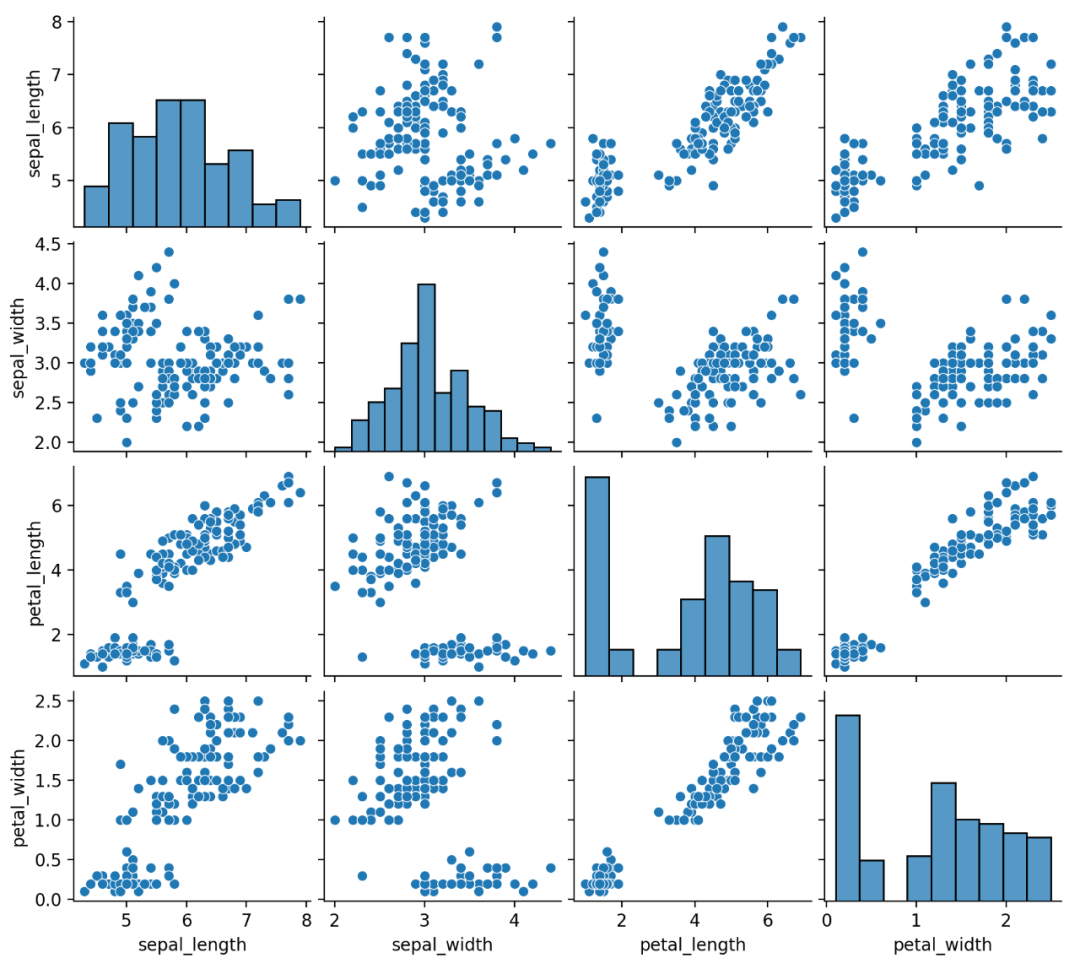
import matplotlib.pyplot as plt
import seaborn as sns
from gapminder import gapminder

# 导入数据
data = gapminder.loc[gapminder.year == 2007]

# 使用scatterplot创建气泡图
sns.scatterplot(data=data, x="gdpPercap", y="lifeExp", size="pop", legend=False, sizes=(20, 2000))

# 显示
plt.show()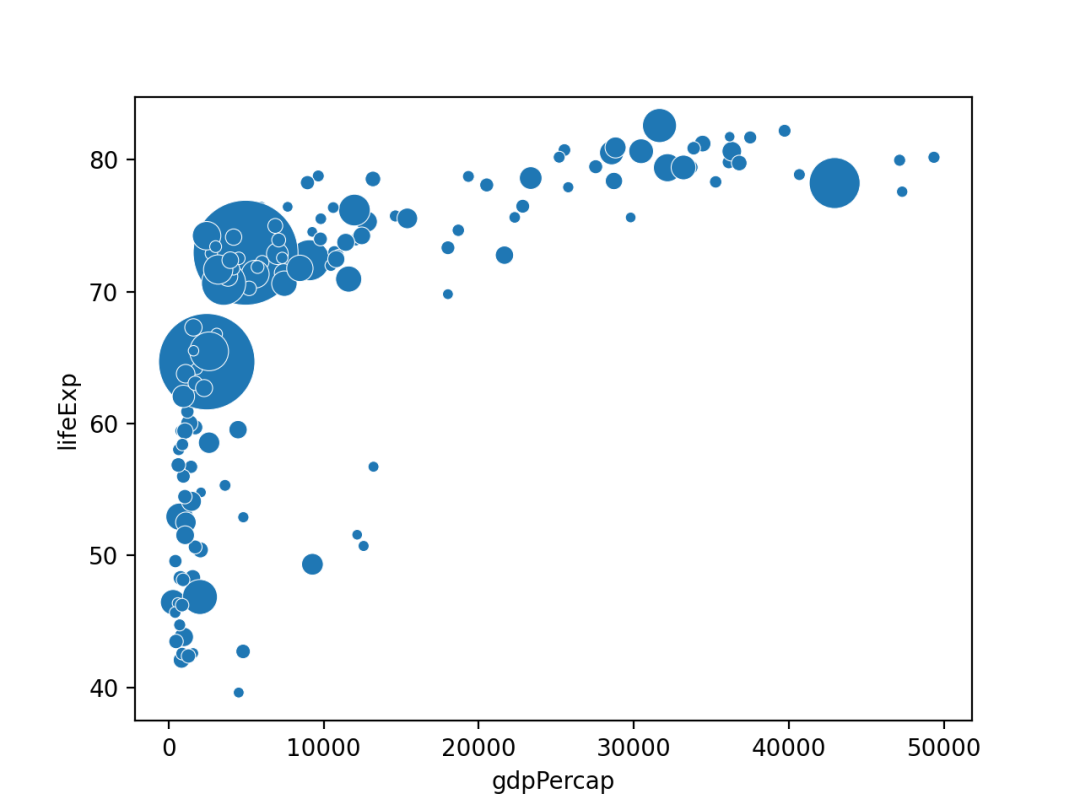
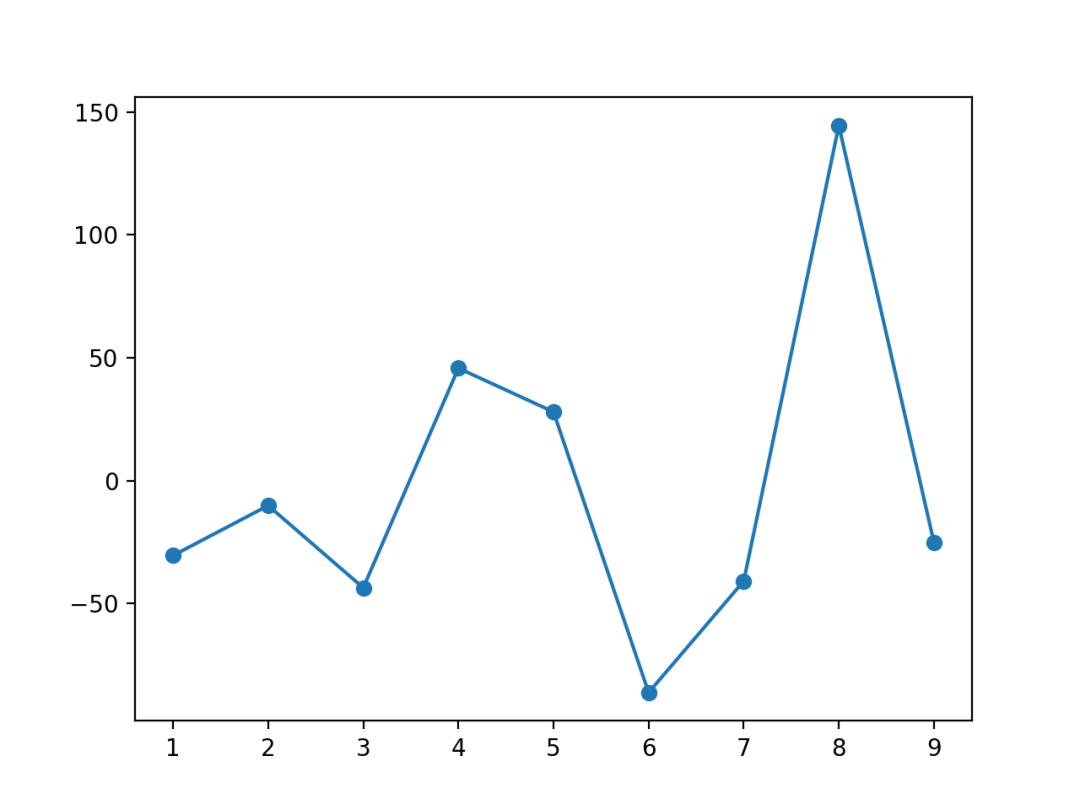
import matplotlib.pyplot as plt
import numpy as np
import pandas as pd

# 创建数据
df = pd.DataFrame({'x_axis': range(1, 10), 'y_axis': np.random.randn(9) * 80 + range(1, 10)})

# 绘制显示
plt.plot('x_axis', 'y_axis', data=df, linestyle='-', marker='o')
plt.show()
import numpy as np
import matplotlib.pyplot as plt
from scipy.stats import kde

# 创建数据, 200个点
data = np.random.multivariate_normal([0, 0], [[1, 0.5], [0.5, 3]], 200)
x, y = data.T

# 创建画布, 6个子图
fig, axes = plt.subplots(ncols=6, nrows=1, figsize=(21, 5))

# 第一个子图, 散点图
axes[0].set_title('Scatterplot')
axes[0].plot(x, y, 'ko')

# 第二个子图, 六边形
nbins = 20
axes[1].set_title('Hexbin')
axes[1].hexbin(x, y, gridsize=nbins, cmap=plt.cm.BuGn_r)

# 2D 直方图
axes[2].set_title('2D Histogram')
axes[2].hist2d(x, y, bins=nbins, cmap=plt.cm.BuGn_r)

# 高斯kde
k = kde.gaussian_kde(data.T)
xi, yi = np.mgrid[x.min():x.max():nbins * 1j, y.min():y.max():nbins * 1j]
zi = k(np.vstack([xi.flatten(), yi.flatten()]))

# 密度图
axes[3].set_title('Calculate Gaussian KDE')
axes[3].pcolormesh(xi, yi, zi.reshape(xi.shape), shading='auto', cmap=plt.cm.BuGn_r)

# 添加阴影
axes[4].set_title('2D Density with shading')
axes[4].pcolormesh(xi, yi, zi.reshape(xi.shape), shading='gouraud', cmap=plt.cm.BuGn_r)

# 添加轮廓
axes[5].set_title('Contour')
axes[5].pcolormesh(xi, yi, zi.reshape(xi.shape), shading='gouraud', cmap=plt.cm.BuGn_r)
axes[5].contour(xi, yi, zi.reshape(xi.shape))

plt.show()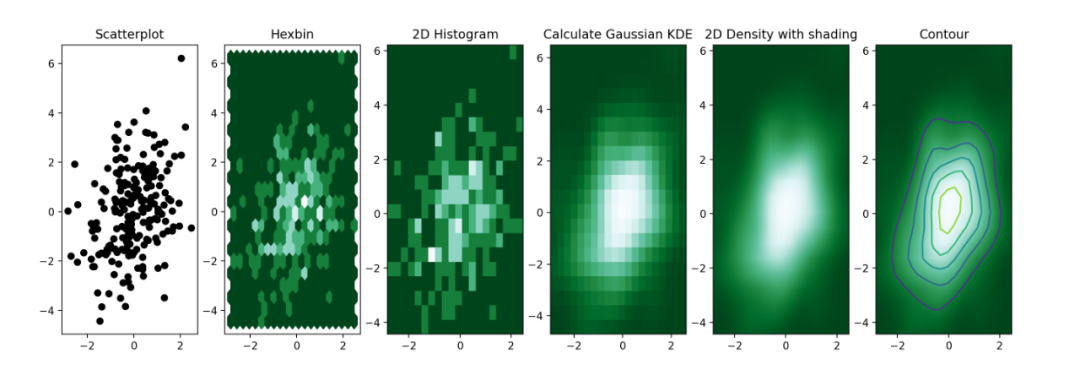
import numpy as np
import matplotlib.pyplot as plt

# 生成随机数据
height = [3, 12, 5, 18, 45]
bars = ('A', 'B', 'C', 'D', 'E')
y_pos = np.arange(len(bars))

# 创建条形图
plt.bar(y_pos, height)

# x轴标签
plt.xticks(y_pos, bars)

# 显示
plt.show()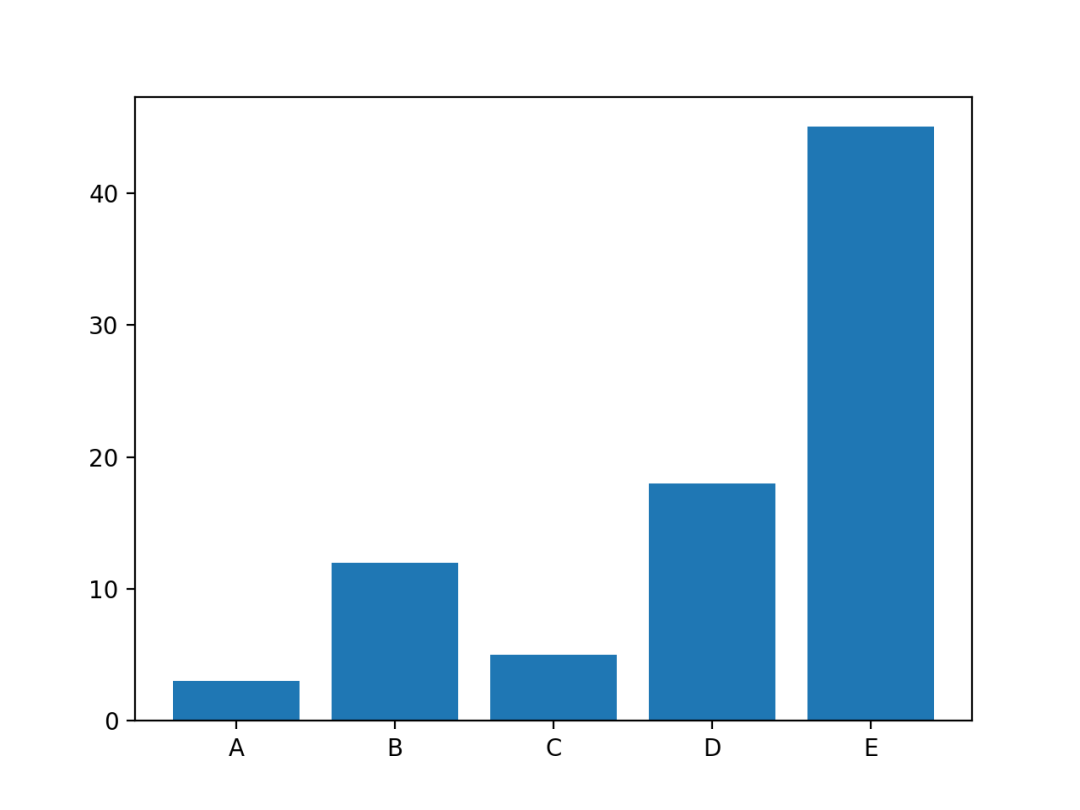
import matplotlib.pyplot as plt
import pandas as pd
from math import pi

# 设置数据
df = pd.DataFrame({
    'group': ['A', 'B', 'C', 'D'],
    'var1': [38, 1.5, 30, 4],
    'var2': [29, 10, 9, 34],
    'var3': [8, 39, 23, 24],
    'var4': [7, 31, 33, 14],
    'var5': [28, 15, 32, 14]
})

# 目标数量
categories = list(df)[1:]
N = len(categories)

# 角度
angles = [n / float(N) * 2 * pi for n in range(N)]
angles += angles[:1]

# 初始化
ax = plt.subplot(111, polar=True)

# 设置第一处
ax.set_theta_offset(pi / 2)
ax.set_theta_direction(-1)

# 添加背景信息
plt.xticks(angles[:-1], categories)
ax.set_rlabel_position(0)
plt.yticks([10, 20, 30], ["10", "20", "30"], color="grey", size=7)
plt.ylim(0, 40)

# 添加数据图

# 第一个
values = df.loc[0].drop('group').values.flatten().tolist()
values += values[:1]
ax.plot(angles, values, linewidth=1, linestyle='solid', label="group A")
ax.fill(angles, values, 'b', alpha=0.1)

# 第二个
values = df.loc[1].drop('group').values.flatten().tolist()
values += values[:1]
ax.plot(angles, values, linewidth=1, linestyle='solid', label="group B")
ax.fill(angles, values, 'r', alpha=0.1)

# 添加图例
plt.legend(loc='upper right', bbox_to_anchor=(0.1, 0.1))

# 显示
plt.show()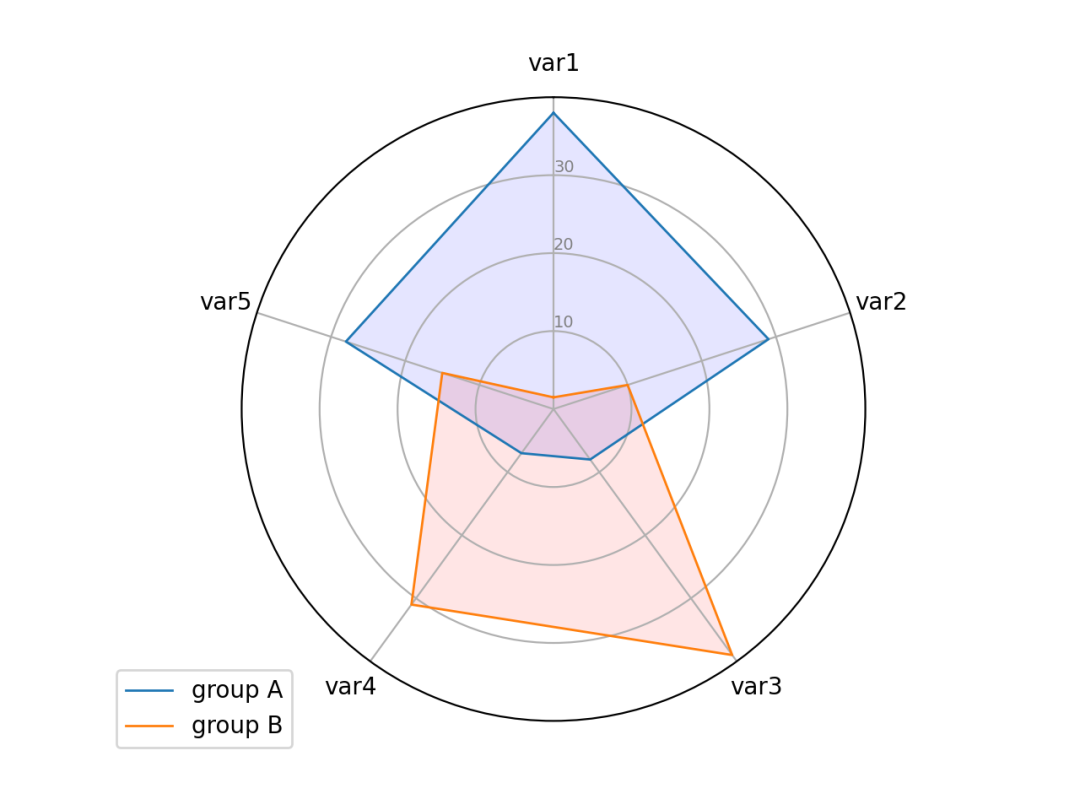
from wordcloud import WordCloud
import matplotlib.pyplot as plt

# 添加词语
text=("Python Python Python Matplotlib Chart Wordcloud Boxplot")

# 创建词云对象
wordcloud = WordCloud(width=480, height=480, margin=0).generate(text)

# 显示词云图
plt.imshow(wordcloud, interpolation='bilinear')
plt.axis("off")
plt.margins(x=0, y=0)
plt.show()
import seaborn as sns
import matplotlib.pyplot as plt
from pandas.plotting import parallel_coordinates

# 读取数据
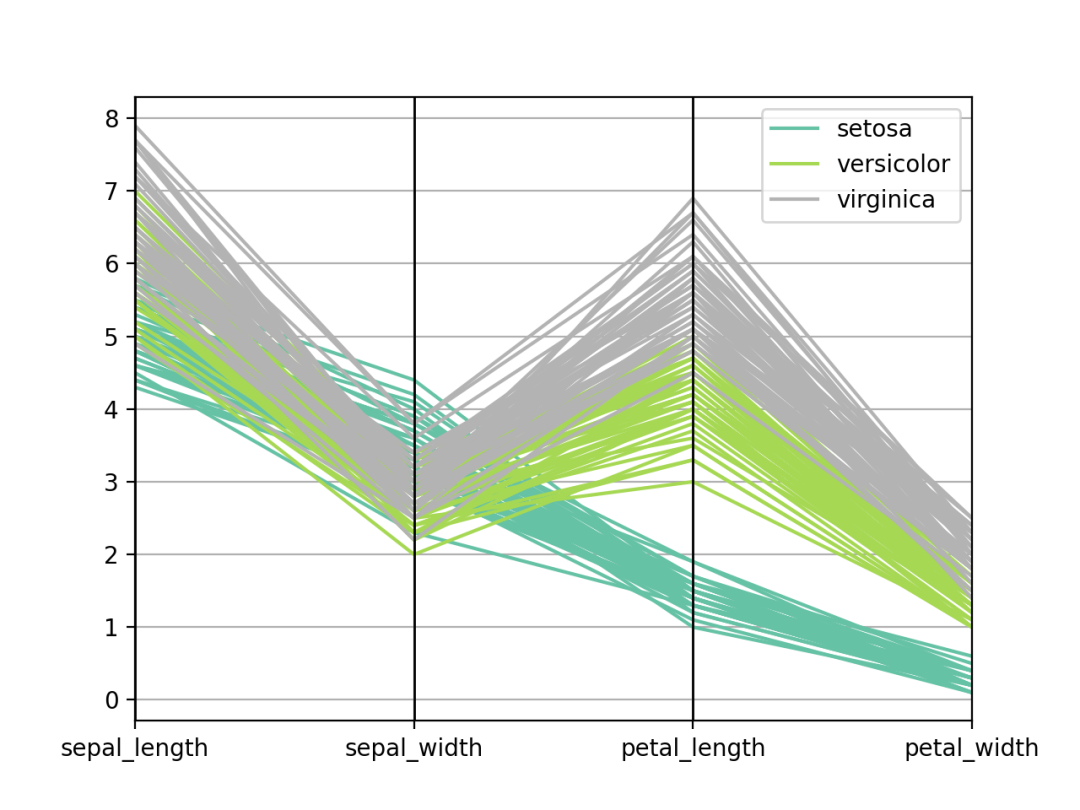
data = sns.load_dataset('iris', data_home='seaborn-data', cache=True)

# 创建图表
parallel_coordinates(data, 'species', colormap=plt.get_cmap("Set2"))

# 显示
plt.show()
import matplotlib.pyplot as plt
import pandas as pd
import numpy as np

# 创建数据
df = pd.DataFrame({'group': list(map(chr, range(65, 85))), 'values': np.random.uniform(size=20) })

# 排序取值
ordered_df = df.sort_values(by='values')
my_range = range(1, len(df.index)+1)

# 创建图表
plt.stem(ordered_df['values'])
plt.xticks(my_range, ordered_df['group'])

# 显示
plt.show()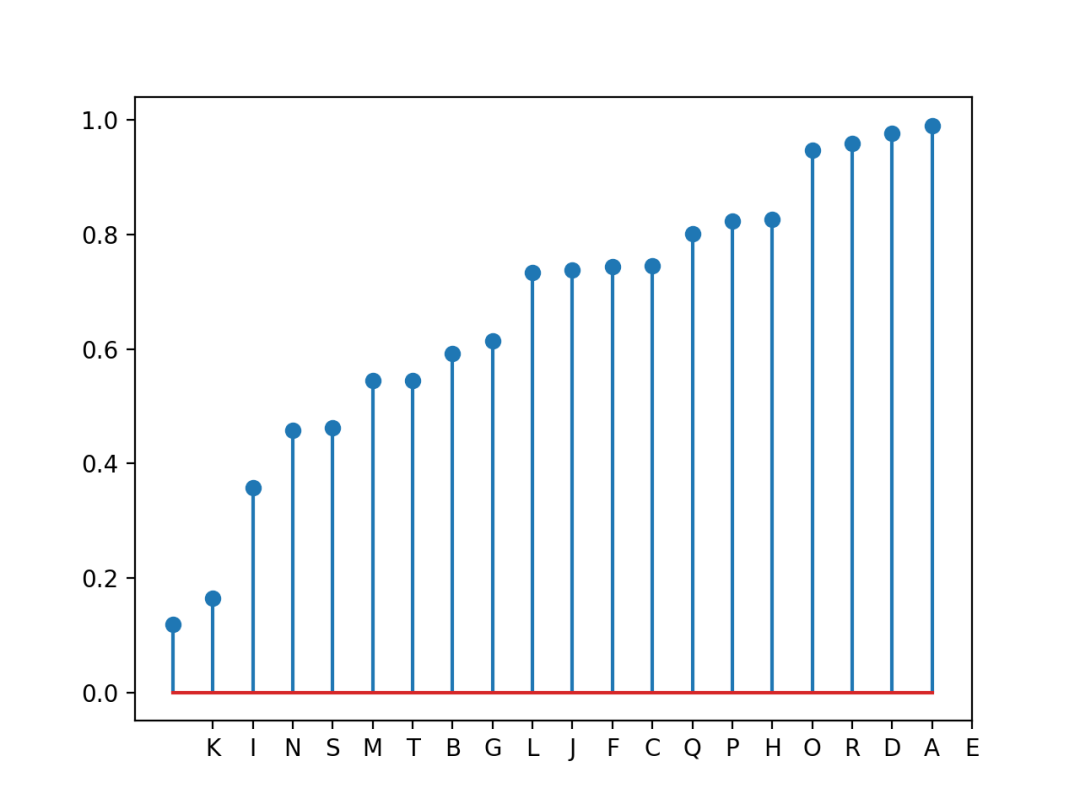
import pandas as pd
import matplotlib.pyplot as plt
import numpy as np

# 生成数据
df = pd.DataFrame(
        {
            'Name': ['item ' + str(i) for i in list(range(1, 51)) ],
            'Value': np.random.randint(low=10, high=100, size=50)
        })

# 排序
df = df.sort_values(by=['Value'])

# 初始化画布
plt.figure(figsize=(20, 10))
ax = plt.subplot(111, polar=True)
plt.axis('off')

# 设置图表参数
upperLimit = 100
lowerLimit = 30
labelPadding = 4

# 计算最大值
max = df['Value'].max()

# 数据下限10, 上限100
slope = (max - lowerLimit) / max
heights = slope * df.Value + lowerLimit

# 计算条形图的宽度
width = 2*np.pi / len(df.index)

# 计算角度
indexes = list(range(1, len(df.index)+1))
angles = [element * width for element in indexes]

# 绘制条形图
bars = ax.bar(
    x=angles,
    height=heights,
    width=width,
    bottom=lowerLimit,
    linewidth=2,
    edgecolor="white",
    color="#61a4b2",
)

# 添加标签
for bar, angle, height, label in zip(bars,angles, heights, df["Name"]):

    # 旋转
    rotation = np.rad2deg(angle)

    # 翻转
    alignment = ""
    if angle >= np.pi/2 and angle < 3*np.pi/2:
        alignment = "right"
        rotation = rotation + 180
    else:
        alignment = "left"

    # 最后添加标签
    ax.text(
        x=angle,
        y=lowerLimit + bar.get_height() + labelPadding,
        s=label,
        ha=alignment,
        va='center',
        rotation=rotation,
        rotation_mode="anchor")

plt.show()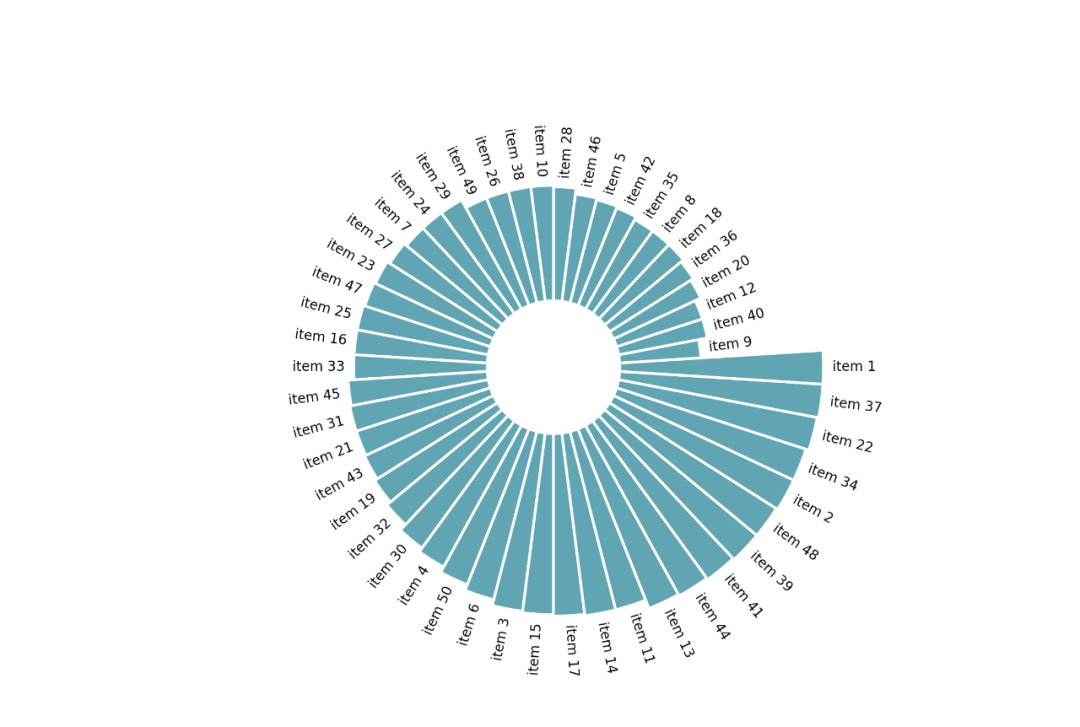
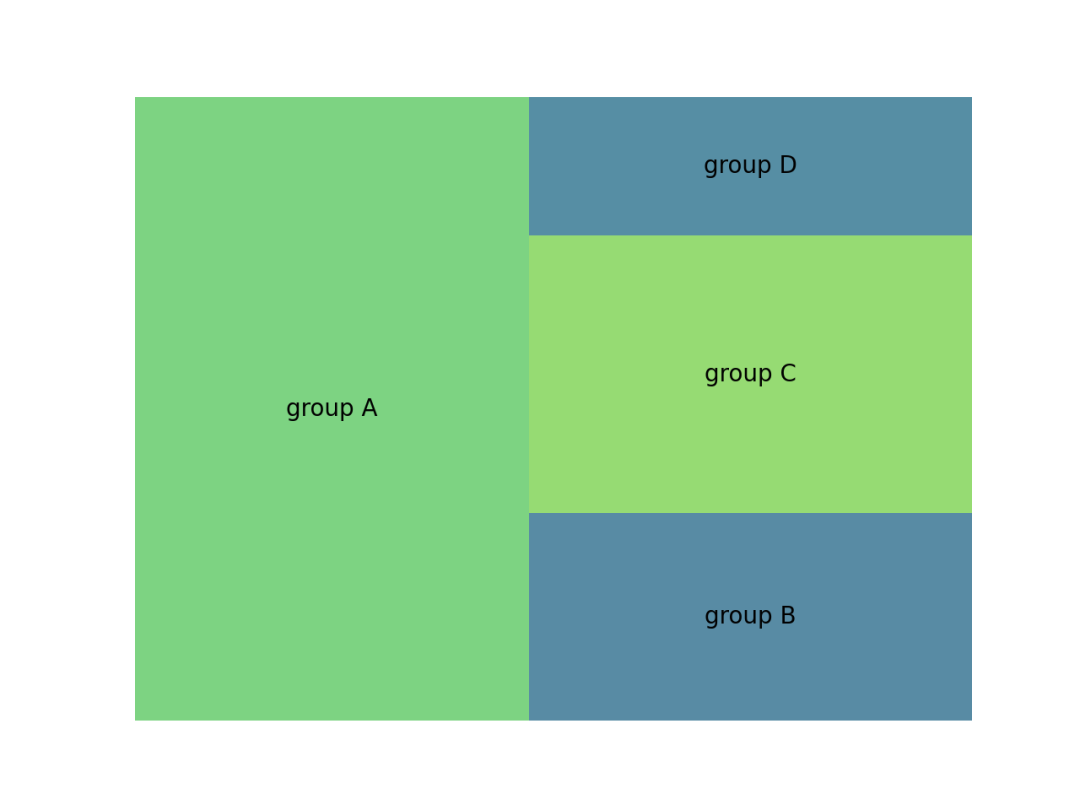
import matplotlib.pyplot as plt
import squarify
import pandas as pd

# 创建数据
df = pd.DataFrame({'nb_people': [8, 3, 4, 2], 'group': ["group A", "group B", "group C", "group D"]})

# 绘图显示
squarify.plot(sizes=df['nb_people'], label=df['group'], alpha=.8 )
plt.axis('off')
plt.show()
plt.show()
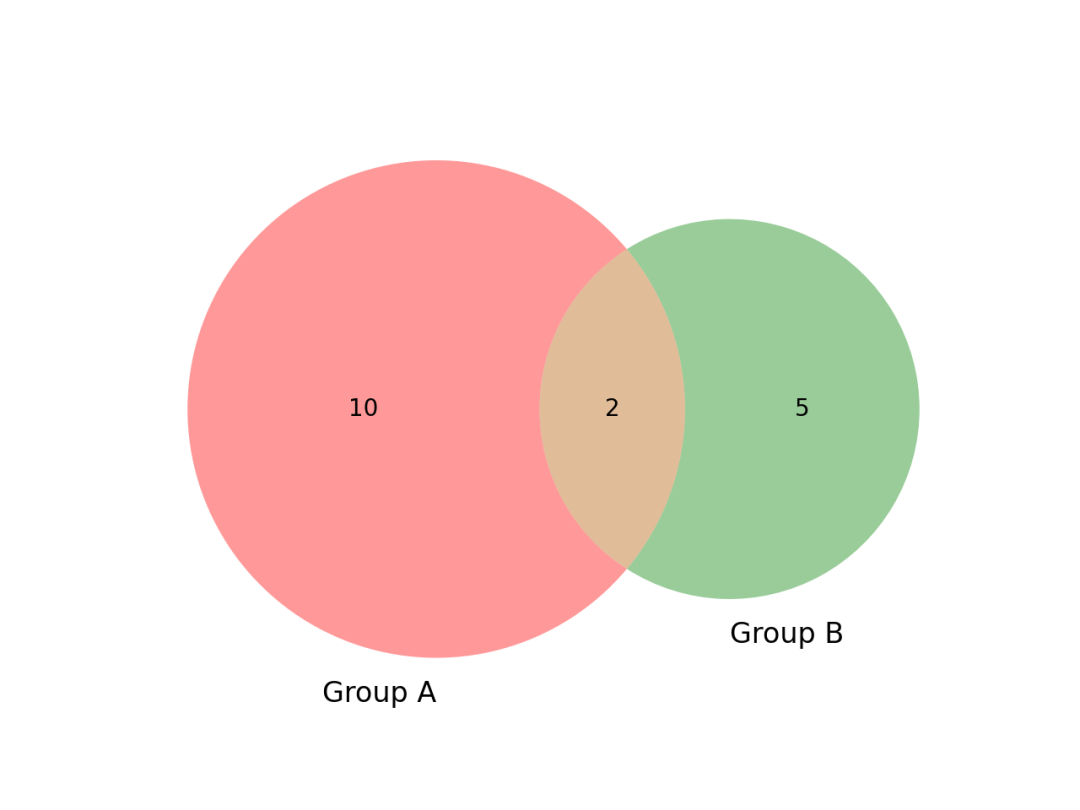
import matplotlib.pyplot as plt
from matplotlib_venn import venn2

# 创建图表
venn2(subsets=(10, 5, 2), set_labels=('Group A', 'Group B'))

# 显示
plt.show()
import matplotlib.pyplot as plt

# 创建数据
size_of_groups = [12, 11, 3, 30]

# 生成饼图
plt.pie(size_of_groups)

# 在中心添加一个圆, 生成环形图
my_circle = plt.Circle((0, 0), 0.7, color='white')
p = plt.gcf()
p.gca().add_artist(my_circle)

plt.show()
import matplotlib.pyplot as plt

# 创建数据
size_of_groups = [12, 11, 3, 30]

# 生成饼图
plt.pie(size_of_groups)
plt.show()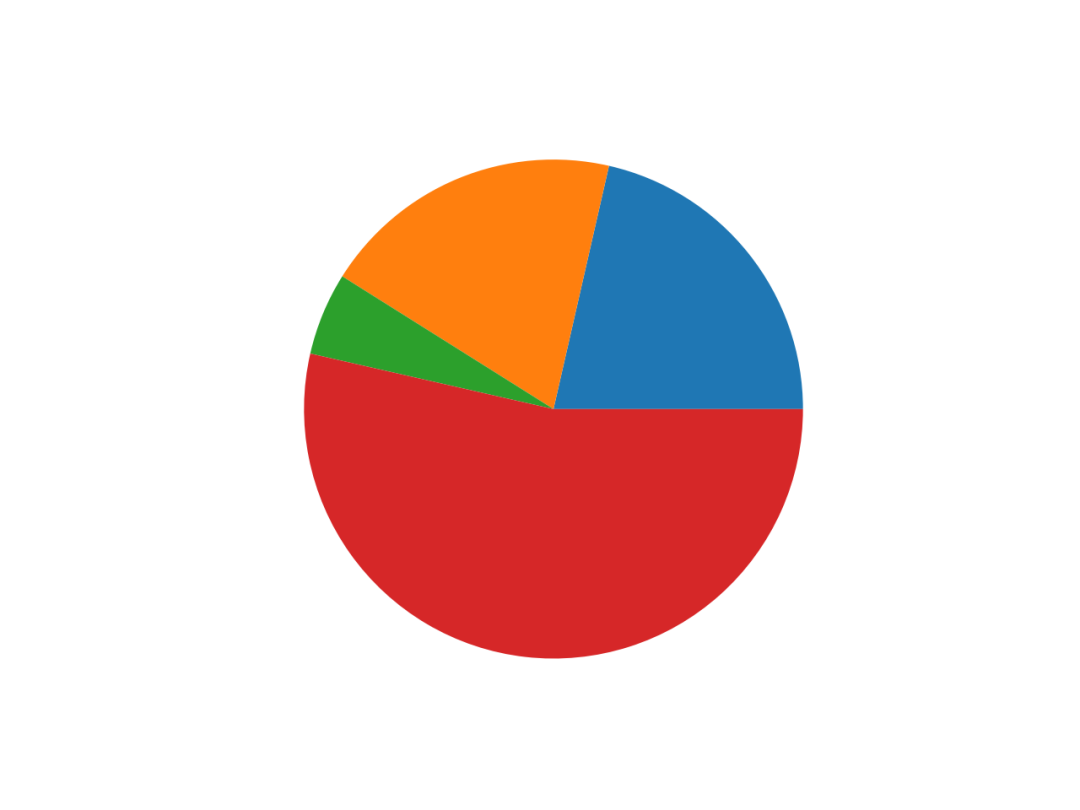
import pandas as pd
from matplotlib import pyplot as plt
from scipy.cluster.hierarchy import dendrogram, linkage

# 读取数据
df = pd.read_csv('mtcars.csv')
df = df.set_index('model')

# 计算每个样本之间的距离
Z = linkage(df, 'ward')

# 绘图
dendrogram(Z, leaf_rotation=90, leaf_font_size=8, labels=df.index)

# 显示
plt.show()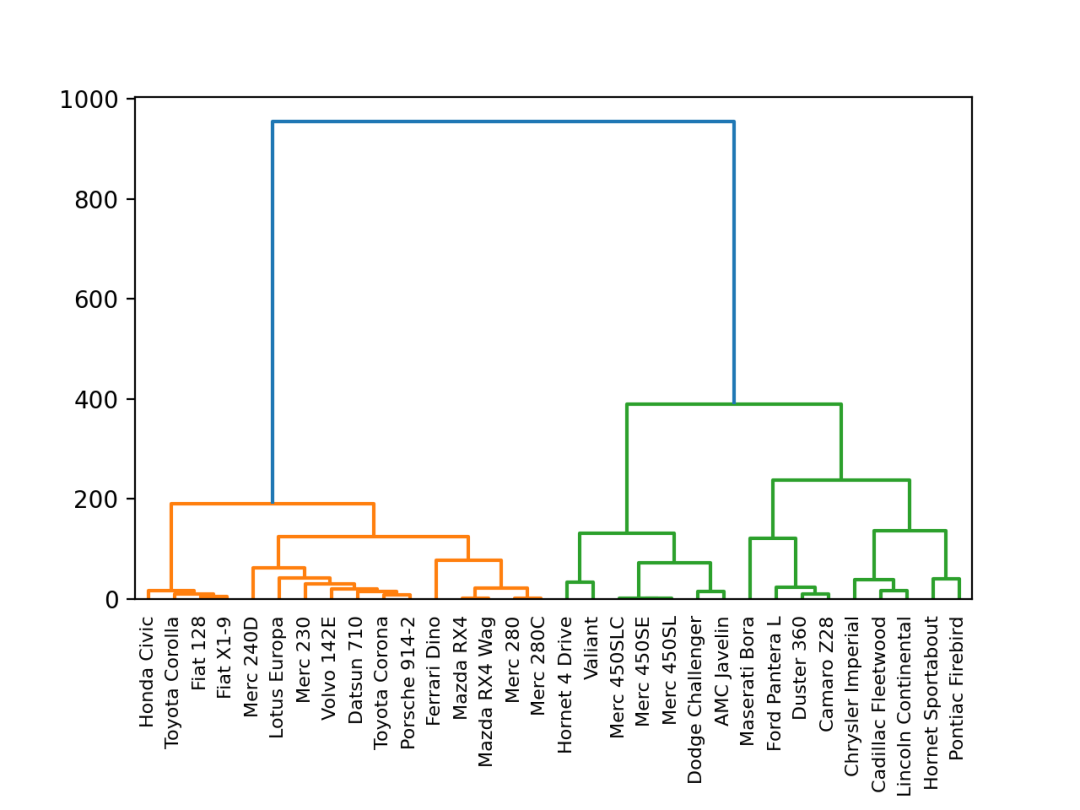
import circlify
import matplotlib.pyplot as plt

# 创建画布, 包含一个子图
fig, ax = plt.subplots(figsize=(14, 14))

# 标题
ax.set_title('Repartition of the world population')

# 移除坐标轴
ax.axis('off')

# 人口数据
data = [{'id': 'World', 'datum': 6964195249, 'children': [
              {'id': "North America", 'datum': 450448697,
                  'children': [
                     {'id': "United States", 'datum': 308865000},
                     {'id': "Mexico", 'datum': 107550697},
                     {'id': "Canada", 'datum': 34033000}
                   ]},
              {'id': "South America", 'datum': 278095425,
                  'children': [
                     {'id': "Brazil", 'datum': 192612000},
                     {'id': "Colombia", 'datum': 45349000},
                     {'id': "Argentina", 'datum': 40134425}
                   ]},
              {'id': "Europe", 'datum': 209246682,
                  'children': [
                     {'id': "Germany", 'datum': 81757600},
                     {'id': "France", 'datum': 65447374},
                     {'id': "United Kingdom", 'datum': 62041708}
                   ]},
              {'id': "Africa", 'datum': 311929000,
                  'children': [
                     {'id': "Nigeria", 'datum': 154729000},
                     {'id': "Ethiopia", 'datum': 79221000},
                     {'id': "Egypt", 'datum': 77979000}
                   ]},
              {'id': "Asia", 'datum': 2745929500,
                  'children': [
                     {'id': "China", 'datum': 1336335000},
                     {'id': "India", 'datum': 1178225000},
                     {'id': "Indonesia", 'datum': 231369500}
                   ]}
    ]}]

# 使用circlify()计算, 获取圆的大小, 位置
circles = circlify.circlify(
    data,
    show_enclosure=False,
    target_enclosure=circlify.Circle(x=0, y=0, r=1)
)


lim = max(
    max(
        abs(circle.x) + circle.r,
        abs(circle.y) + circle.r,
    )
    for circle in circles
)
plt.xlim(-lim, lim)
plt.ylim(-lim, lim)

for circle in circles:
    if circle.level != 2:
        continue
    x, y, r = circle
    ax.add_patch(plt.Circle((x, y), r, alpha=0.5, linewidth=2, color="lightblue"))

for circle in circles:
    if circle.level != 3:
        continue
    x, y, r = circle
    label = circle.ex["id"]
    ax.add_patch(plt.Circle((x, y), r, alpha=0.5, linewidth=2, color="#69b3a2"))
    plt.annotate(label, (x, y), ha='center', color="white")

for circle in circles:
    if circle.level != 2:
        continue
    x, y, r = circle
    label = circle.ex["id"]
    plt.annotate(label, (x, y), va='center', ha='center', bbox=dict(facecolor='white', edgecolor='black', boxstyle='round', pad=.5))

plt.show()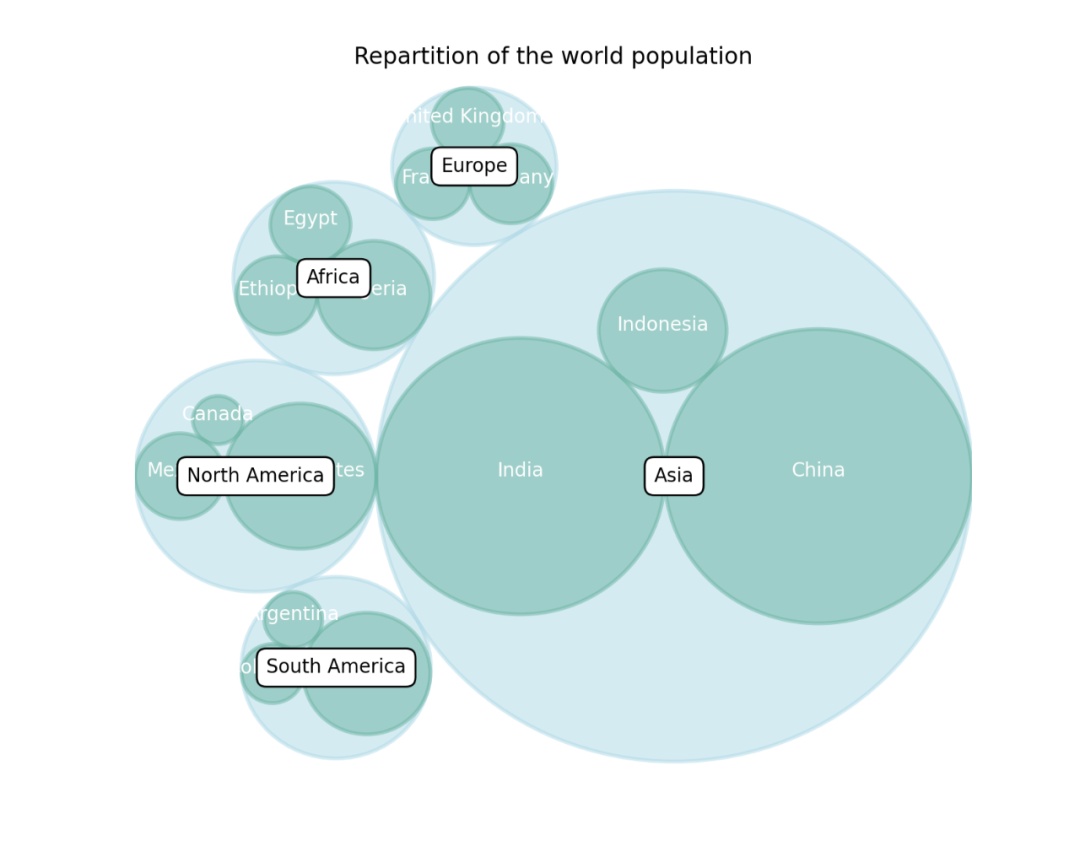
import matplotlib.pyplot as plt
import numpy as np

# 创建数据
values = np.cumsum(np.random.randn(1000, 1))

# 绘制图表
plt.plot(values)
plt.show()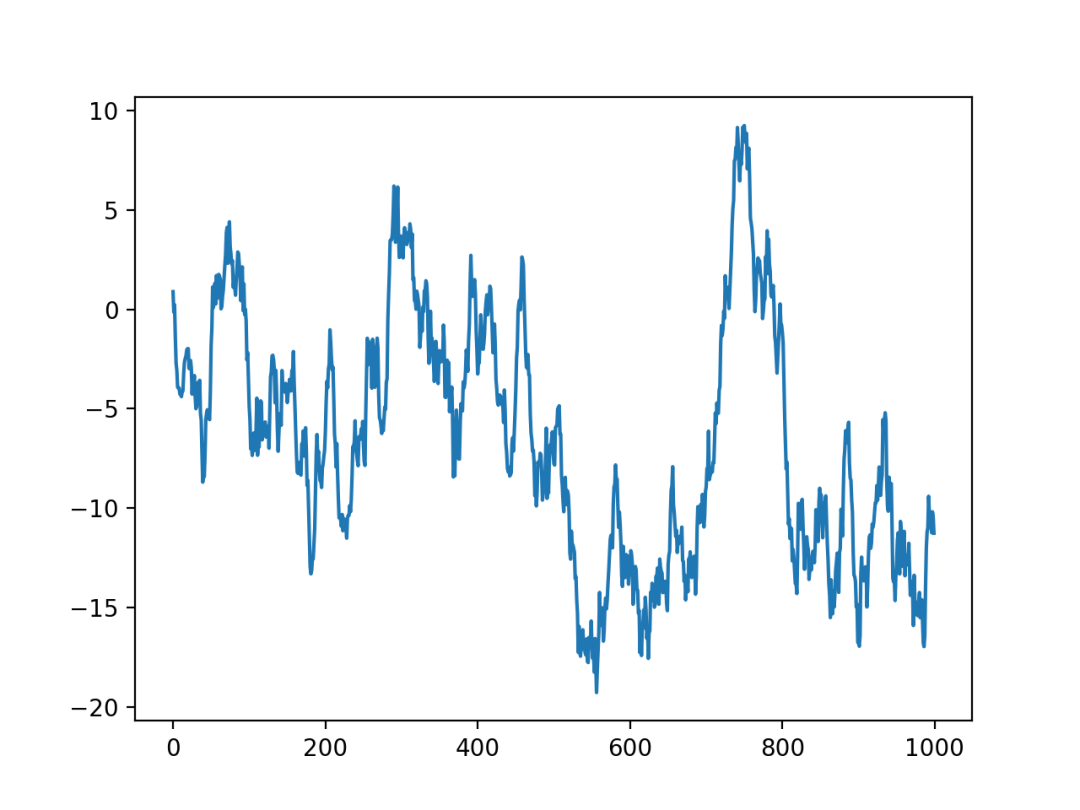
import matplotlib.pyplot as plt

# 创建数据
x = range(1, 6)
y = [1, 4, 6, 8, 4]

# 生成图表
plt.fill_between(x, y)
plt.show()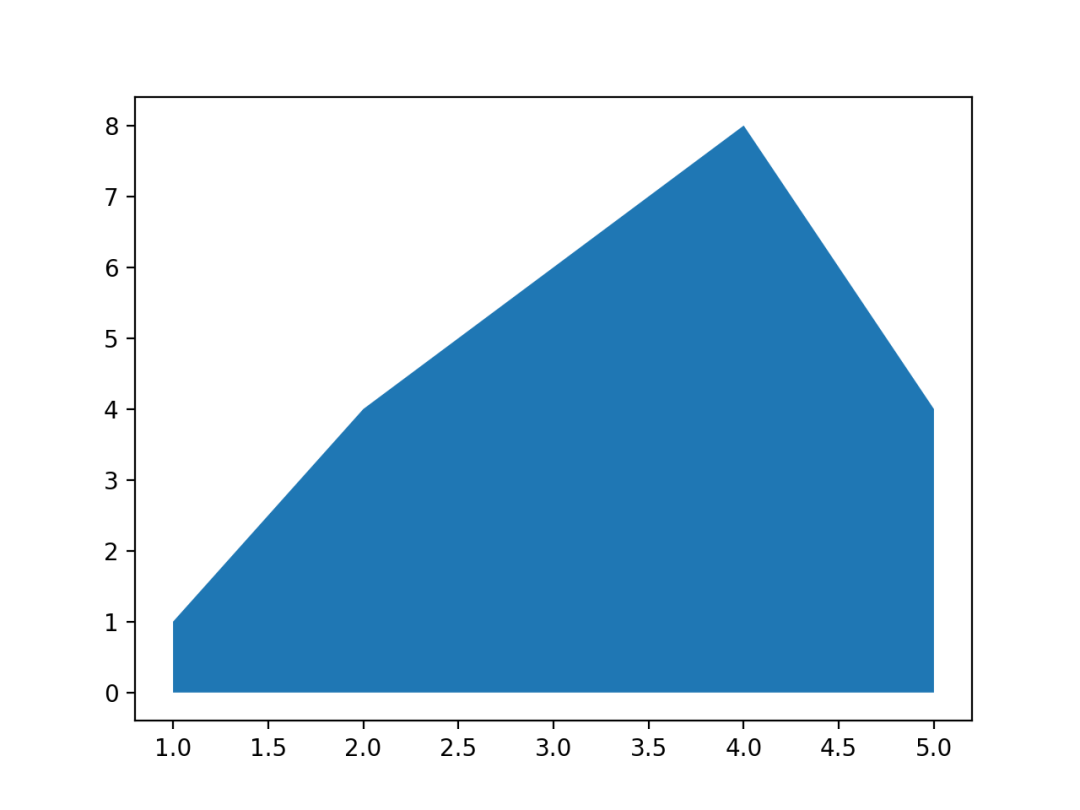
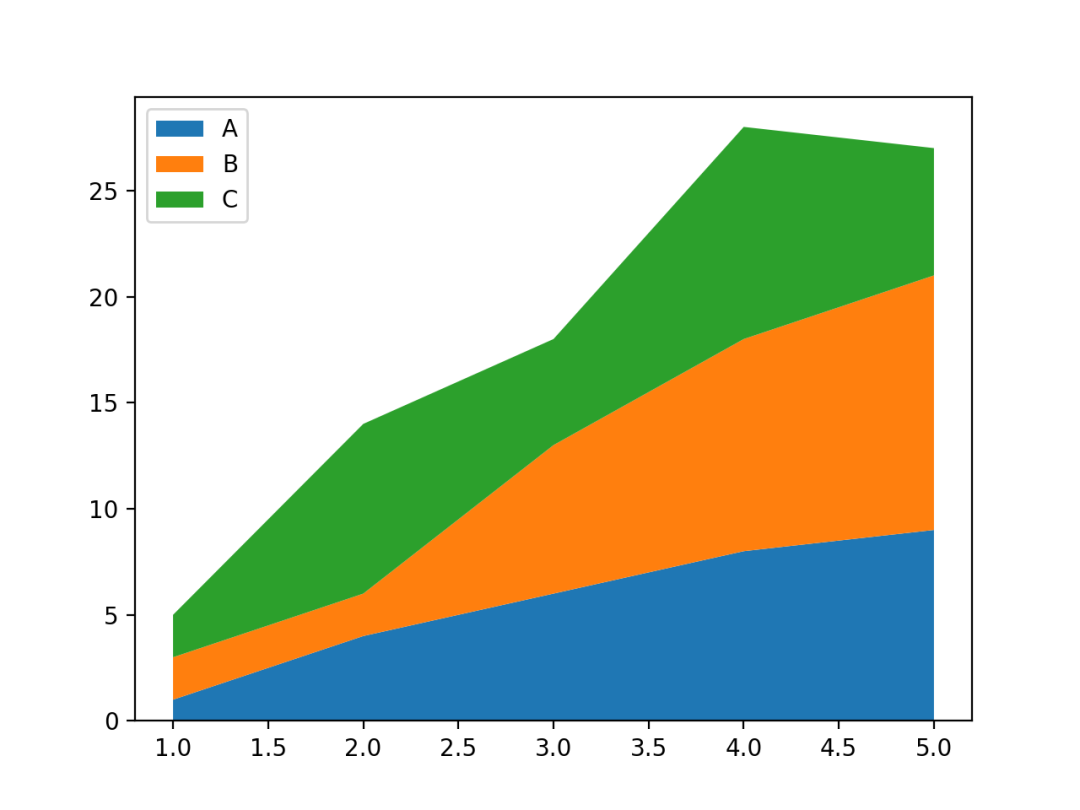
import matplotlib.pyplot as plt

# 创建数据
x = range(1, 6)
y1 = [1, 4, 6, 8, 9]
y2 = [2, 2, 7, 10, 12]
y3 = [2, 8, 5, 10, 6]

# 生成图表
plt.stackplot(x, y1, y2, y3, labels=['A', 'B', 'C'])
plt.legend(loc='upper left')
plt.show()
import matplotlib.pyplot as plt
import numpy as np
from scipy import stats

# 添加数据
x = np.arange(1990, 2020)
y = [np.random.randint(0, 5, size=30) for _ in range(5)]


def gaussian_smooth(x, y, grid, sd):
    """平滑曲线"""
    weights = np.transpose([stats.norm.pdf(grid, m, sd) for m in x])
    weights = weights / weights.sum(0)
    return (weights * y).sum(1)


# 自定义颜色
COLORS = ["#D0D1E6", "#A6BDDB", "#74A9CF", "#2B8CBE", "#045A8D"]

# 创建画布
fig, ax = plt.subplots(figsize=(10, 7))

# 生成图表
grid = np.linspace(1985, 2025, num=500)
y_smoothed = [gaussian_smooth(x, y_, grid, 1) for y_ in y]
ax.stackplot(grid, y_smoothed, colors=COLORS, baseline="sym")

# 显示
plt.show()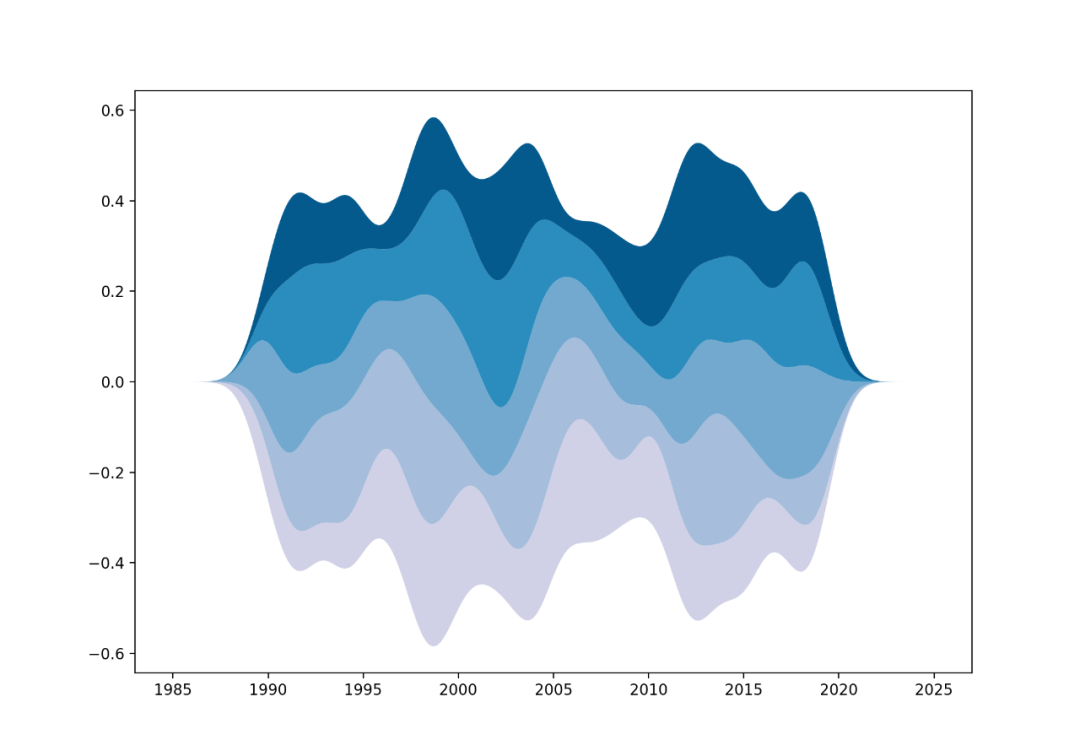
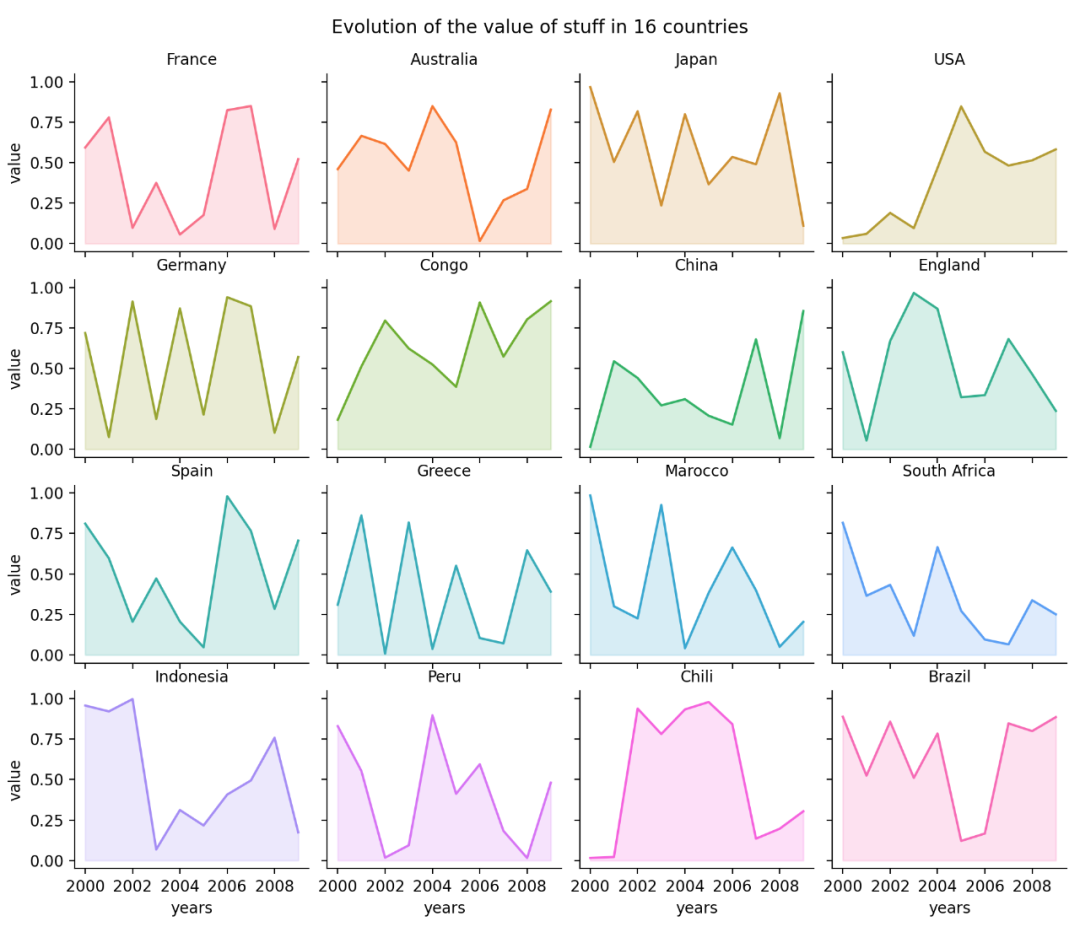
import numpy as np
import seaborn as sns
import pandas as pd
import matplotlib.pyplot as plt

# 创建数据
my_count = ["France", "Australia", "Japan", "USA", "Germany", "Congo", "China", "England", "Spain", "Greece", "Marocco",
            "South Africa", "Indonesia", "Peru", "Chili", "Brazil"]
df = pd.DataFrame({
    "country": np.repeat(my_count, 10),
    "years": list(range(2000, 2010)) * 16,
    "value": np.random.rand(160)
})

# 创建网格
g = sns.FacetGrid(df, col='country', hue='country', col_wrap=4, )

# 添加曲线图
g = g.map(plt.plot, 'years', 'value')

# 面积图
g = g.map(plt.fill_between, 'years', 'value', alpha=0.2).set_titles("{col_name} country")

# 标题
g = g.set_titles("{col_name}")

# 总标题
plt.subplots_adjust(top=0.92)
g = g.fig.suptitle('Evolution of the value of stuff in 16 countries')

# 显示
plt.show()
import pandas as pd
import folium

# 创建地图对象
m = folium.Map(location=[20, 0], tiles="OpenStreetMap", zoom_start=2)

# 创建图标数据
data = pd.DataFrame({
   'lon': [-58, 2, 145, 30.32, -4.03, -73.57, 36.82, -38.5],
   'lat': [-34, 49, -38, 59.93, 5.33, 45.52, -1.29, -12.97],
   'name': ['Buenos Aires', 'Paris', 'melbourne', 'St Petersbourg', 'Abidjan', 'Montreal', 'Nairobi', 'Salvador'],
   'value': [10, 12, 40, 70, 23, 43, 100, 43]
}, dtype=str)

# 添加信息
for i in range(0,len(data)):
    folium.Marker(
      location=[data.iloc[i]['lat'], data.iloc[i]['lon']],
      popup=data.iloc[i]['name'],
    ).add_to(m)

# 保存
m.save('map.html')import pandas as pd
import folium
# 创建地图对象
m = folium.Map(location=[40, -95], zoom_start=4)
# 读取数据
state_geo = f"us-states.json"
state_unemployment = f"US_Unemployment_Oct2012.csv"
state_data = pd.read_csv(state_unemployment)
folium.Choropleth(
geo_data=state_geo,
name="choropleth",
data=state_data,
columns=["State", "Unemployment"],
key_on="feature.id",
fill_color="YlGn",
fill_opacity=0.7,
line_opacity=.1,
legend_name="Unemployment Rate (%)",
).add_to(m)
folium.LayerControl().add_to(m)
# 保存
m.save('choropleth-map.html')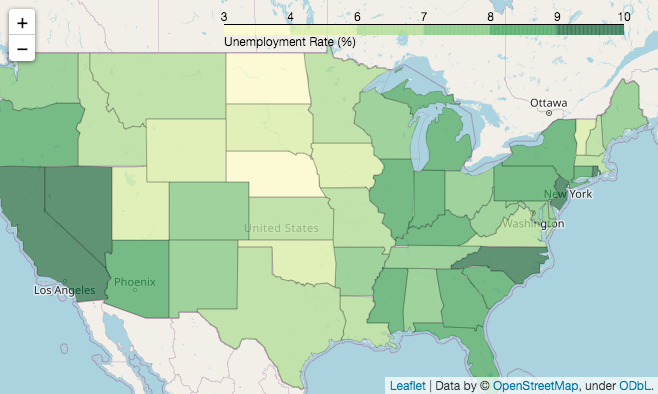
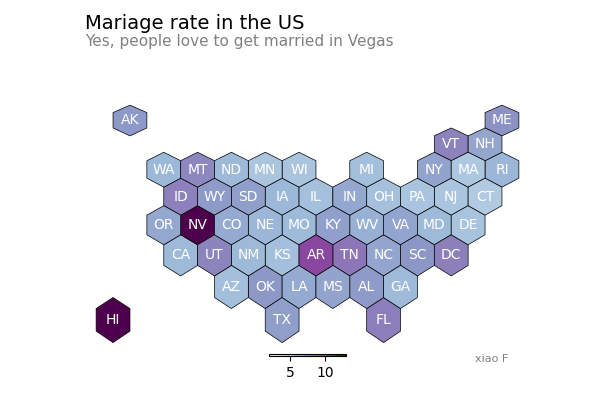
import pandas as pd
import geopandas as gpd
import matplotlib.pyplot as plt

# 读取数据
file = "us_states_hexgrid.geojson.json"
geoData = gpd.read_file(file)
geoData['centroid'] = geoData['geometry'].apply(lambda x: x.centroid)

mariageData = pd.read_csv("State_mariage_rate.csv")
geoData['state'] = geoData['google_name'].str.replace(' \(United States\)','')

geoData = geoData.set_index('state').join(mariageData.set_index('state'))


# 初始化
fig, ax = plt.subplots(1, figsize=(6, 4))

# 绘图
geoData.plot(
    ax=ax,
    column="y_2015",
    cmap="BuPu",
    norm=plt.Normalize(vmin=2, vmax=13),
    edgecolor='black',
    linewidth=.5
);

# 不显示坐标轴
ax.axis('off')

# 标题, 副标题,作者
ax.annotate('Mariage rate in the US', xy=(10, 340),  xycoords='axes pixels', horizontalalignment='left', verticalalignment='top', fontsize=14, color='black')
ax.annotate('Yes, people love to get married in Vegas', xy=(10, 320),  xycoords='axes pixels', horizontalalignment='left', verticalalignment='top', fontsize=11, color='#808080')
ax.annotate('xiao F', xy=(400, 0),  xycoords='axes pixels', horizontalalignment='left', verticalalignment='top', fontsize=8, color='#808080')

# 每个网格
for idx, row in geoData.iterrows():
    ax.annotate(
        s=row['iso3166_2'],
        xy=row['centroid'].coords[0],
        horizontalalignment='center',
        va='center',
        color="white"
    )

# 添加颜色
sm = plt.cm.ScalarMappable(cmap='BuPu', norm=plt.Normalize(vmin=2, vmax=13))
fig.colorbar(sm, orientation="horizontal", aspect=50, fraction=0.005, pad=0 );

# 显示
plt.show()
from mpl_toolkits.basemap import Basemap
import matplotlib.pyplot as plt
import pandas as pd

# 数据
cities = {
    'city': ["Paris", "Melbourne", "Saint.Petersburg", "Abidjan", "Montreal", "Nairobi", "Salvador"],
    'lon': [2, 145, 30.32, -4.03, -73.57, 36.82, -38.5],
    'lat': [49, -38, 59.93, 5.33, 45.52, -1.29, -12.97]
}
df = pd.DataFrame(cities, columns=['city', 'lon', 'lat'])

# 创建地图
m = Basemap(llcrnrlon=-179, llcrnrlat=-60, urcrnrlon=179, urcrnrlat=70, projection='merc')
m.drawmapboundary(fill_color='white', linewidth=0)
m.fillcontinents(color='#f2f2f2', alpha=0.7)
m.drawcoastlines(linewidth=0.1, color="white")

# 循环建立连接
for startIndex, startRow in df.iterrows():
    for endIndex in range(startIndex, len(df.index)):
        endRow = df.iloc[endIndex]
        m.drawgreatcircle(startRow.lon, startRow.lat, endRow.lon, endRow.lat, linewidth=1, color='#69b3a2');

# 添加城市名称
for i, row in df.iterrows():
    plt.annotate(row.city, xy=m(row.lon + 3, row.lat), verticalalignment='center')

plt.show()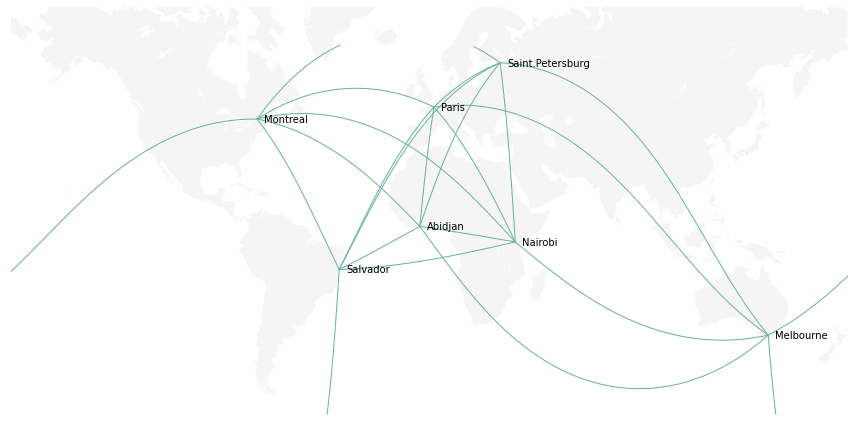
import folium
import pandas as pd

# 创建地图对象
m = folium.Map(location=[20,0], tiles="OpenStreetMap", zoom_start=2)

# 坐标点数据
data = pd.DataFrame({
   'lon': [-58, 2, 145, 30.32, -4.03, -73.57, 36.82, -38.5],
   'lat': [-34, 49, -38, 59.93, 5.33, 45.52, -1.29, -12.97],
   'name': ['Buenos Aires', 'Paris', 'melbourne', 'St Petersbourg', 'Abidjan', 'Montreal', 'Nairobi', 'Salvador'],
   'value': [10, 12, 40, 70, 23, 43, 100, 43]
}, dtype=str)

# 添加气泡
for i in range(0, len(data)):
    folium.Circle(
      location=[data.iloc[i]['lat'], data.iloc[i]['lon']],
      popup=data.iloc[i]['name'],
      radius=float(data.iloc[i]['value'])*20000,
      color='crimson',
      fill=True,
      fill_color='crimson'
    ).add_to(m)

# 保存
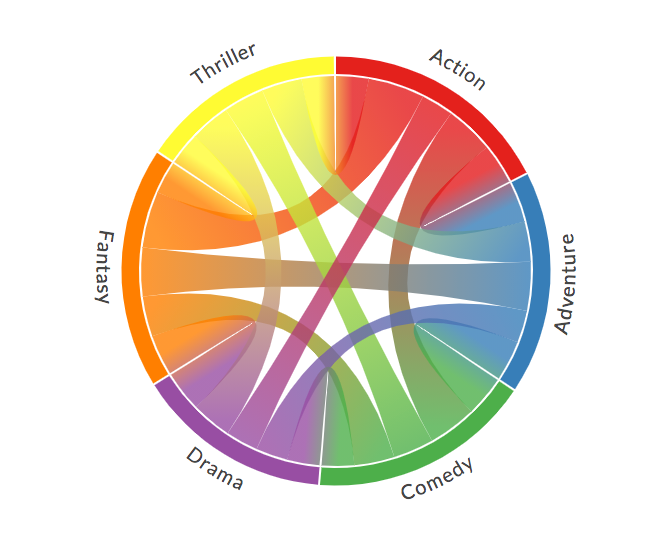
m.save('bubble-map.html')from chord import Chord
matrix = [
[0, 5, 6, 4, 7, 4],
[5, 0, 5, 4, 6, 5],
[6, 5, 0, 4, 5, 5],
[4, 4, 4, 0, 5, 5],
[7, 6, 5, 5, 0, 4],
[4, 5, 5, 5, 4, 0],
]
names = ["Action", "Adventure", "Comedy", "Drama", "Fantasy", "Thriller"]
# 保存
Chord(matrix, names).to_html("chord-diagram.html")
import pandas as pd
import numpy as np
import networkx as nx
import matplotlib.pyplot as plt

# 创建数据
ind1 = [5, 10, 3, 4, 8, 10, 12, 1, 9, 4]
ind5 = [1, 1, 13, 4, 18, 5, 2, 11, 3, 8]
df = pd.DataFrame(
    {'A': ind1, 'B': ind1 + np.random.randint(10, size=(10)), 'C': ind1 + np.random.randint(10, size=(10)),
     'D': ind1 + np.random.randint(5, size=(10)), 'E': ind1 + np.random.randint(5, size=(10)), 'F': ind5,
     'G': ind5 + np.random.randint(5, size=(10)), 'H': ind5 + np.random.randint(5, size=(10)),
     'I': ind5 + np.random.randint(5, size=(10)), 'J': ind5 + np.random.randint(5, size=(10))})

# 计算相关性
corr = df.corr()

# 转换
links = corr.stack().reset_index()
links.columns = ['var1', 'var2', 'value']

# 保持相关性超过一个阈值, 删除自相关性
links_filtered = links.loc[(links['value'] > 0.8) & (links['var1'] != links['var2'])]

# 生成图
G = nx.from_pandas_edgelist(links_filtered, 'var1', 'var2')

# 绘制网络
nx.draw(G, with_labels=True, node_color='orange', node_size=400, edge_color='black', linewidths=1, font_size=15)

# 显示
plt.show()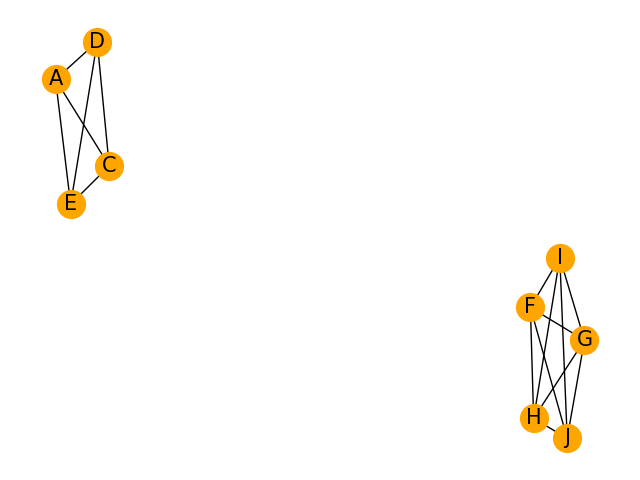
import plotly.graph_objects as go
import json
# 读取数据
with open('sankey_energy.json') as f:
data = json.load(f)
# 透明度
opacity = 0.4
# 颜色
data['data'][0]['node']['color'] = ['rgba(255,0,255, 0.8)' if color == "magenta" else color for color in data['data'][0]['node']['color']]
data['data'][0]['link']['color'] = [data['data'][0]['node']['color'][src].replace("0.8", str(opacity))
for src in data['data'][0]['link']['source']]
fig = go.Figure(data=[go.Sankey(
valueformat=".0f",
valuesuffix="TWh",
# 点
node=dict(
pad=15,
thickness=15,
line=dict(color = "black", width = 0.5),
label=data['data'][0]['node']['label'],
color=data['data'][0]['node']['color']
),
# 线
link=dict(
source=data['data'][0]['link']['source'],
target=data['data'][0]['link']['target'],
value=data['data'][0]['link']['value'],
label=data['data'][0]['link']['label'],
color=data['data'][0]['link']['color']
))])
fig.update_layout(title_text="Energy forecast for 2050
Source: Department of Energy & Climate Change, Tom Counsell via Mike Bostock" ,
font_size=10)
# 保持
fig.write_html("sankey-diagram.html")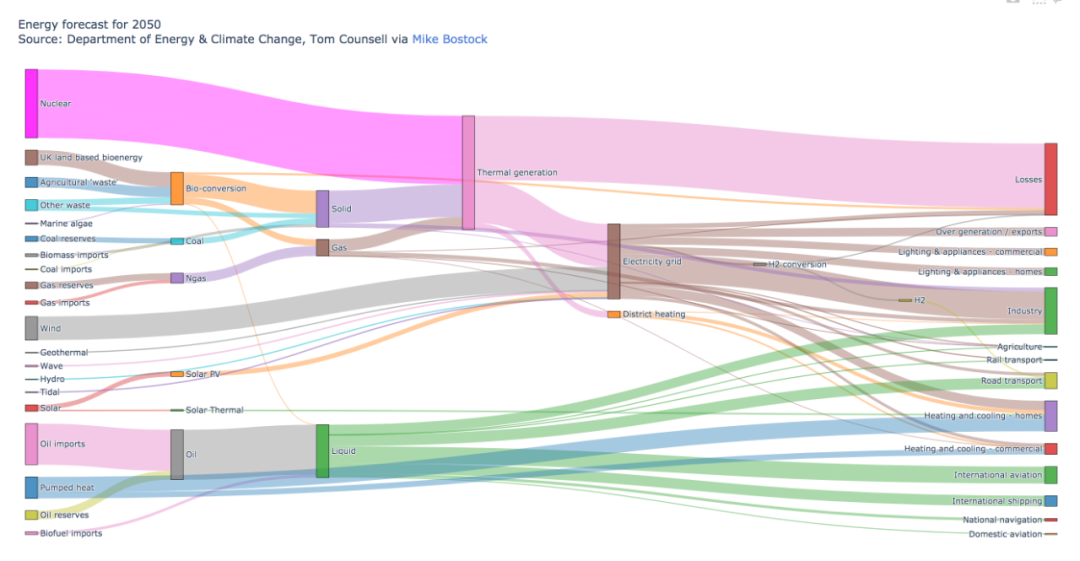
import imageio
import pandas as pd
import matplotlib.pyplot as plt

# 读取数据
data = pd.read_csv('gapminderData.csv')
# 更改格式
data['continent'] = pd.Categorical(data['continent'])

# 分辨率
dpi = 96

filenames = []
# 每年的数据
for i in data.year.unique():
    # 关闭交互式绘图
    plt.ioff()

    # 初始化
    fig = plt.figure(figsize=(680 / dpi, 480 / dpi), dpi=dpi)

    # 筛选数据
    subsetData = data[data.year == i]

    # 生成散点气泡图
    plt.scatter(
        x=subsetData['lifeExp'],
        y=subsetData['gdpPercap'],
        s=subsetData['pop'] / 200000,
        c=subsetData['continent'].cat.codes,
        cmap="Accent", alpha=0.6, edgecolors="white", linewidth=2)

    # 添加相关信息
    plt.yscale('log')
    plt.xlabel("Life Expectancy")
    plt.ylabel("GDP per Capita")
    plt.title("Year: " + str(i))
    plt.ylim(0, 100000)
    plt.xlim(30, 90)

    # 保存
    filename = './images/' + str(i) + '.png'
    filenames.append(filename)
    plt.savefig(fname=filename, dpi=96)
    plt.gca()
    plt.close(fig)


# 生成GIF动态图表
with imageio.get_writer('result.gif', mode='I', fps=5) as writer:
    for filename in filenames:
        image = imageio.imread(filename)
        writer.append_data(image)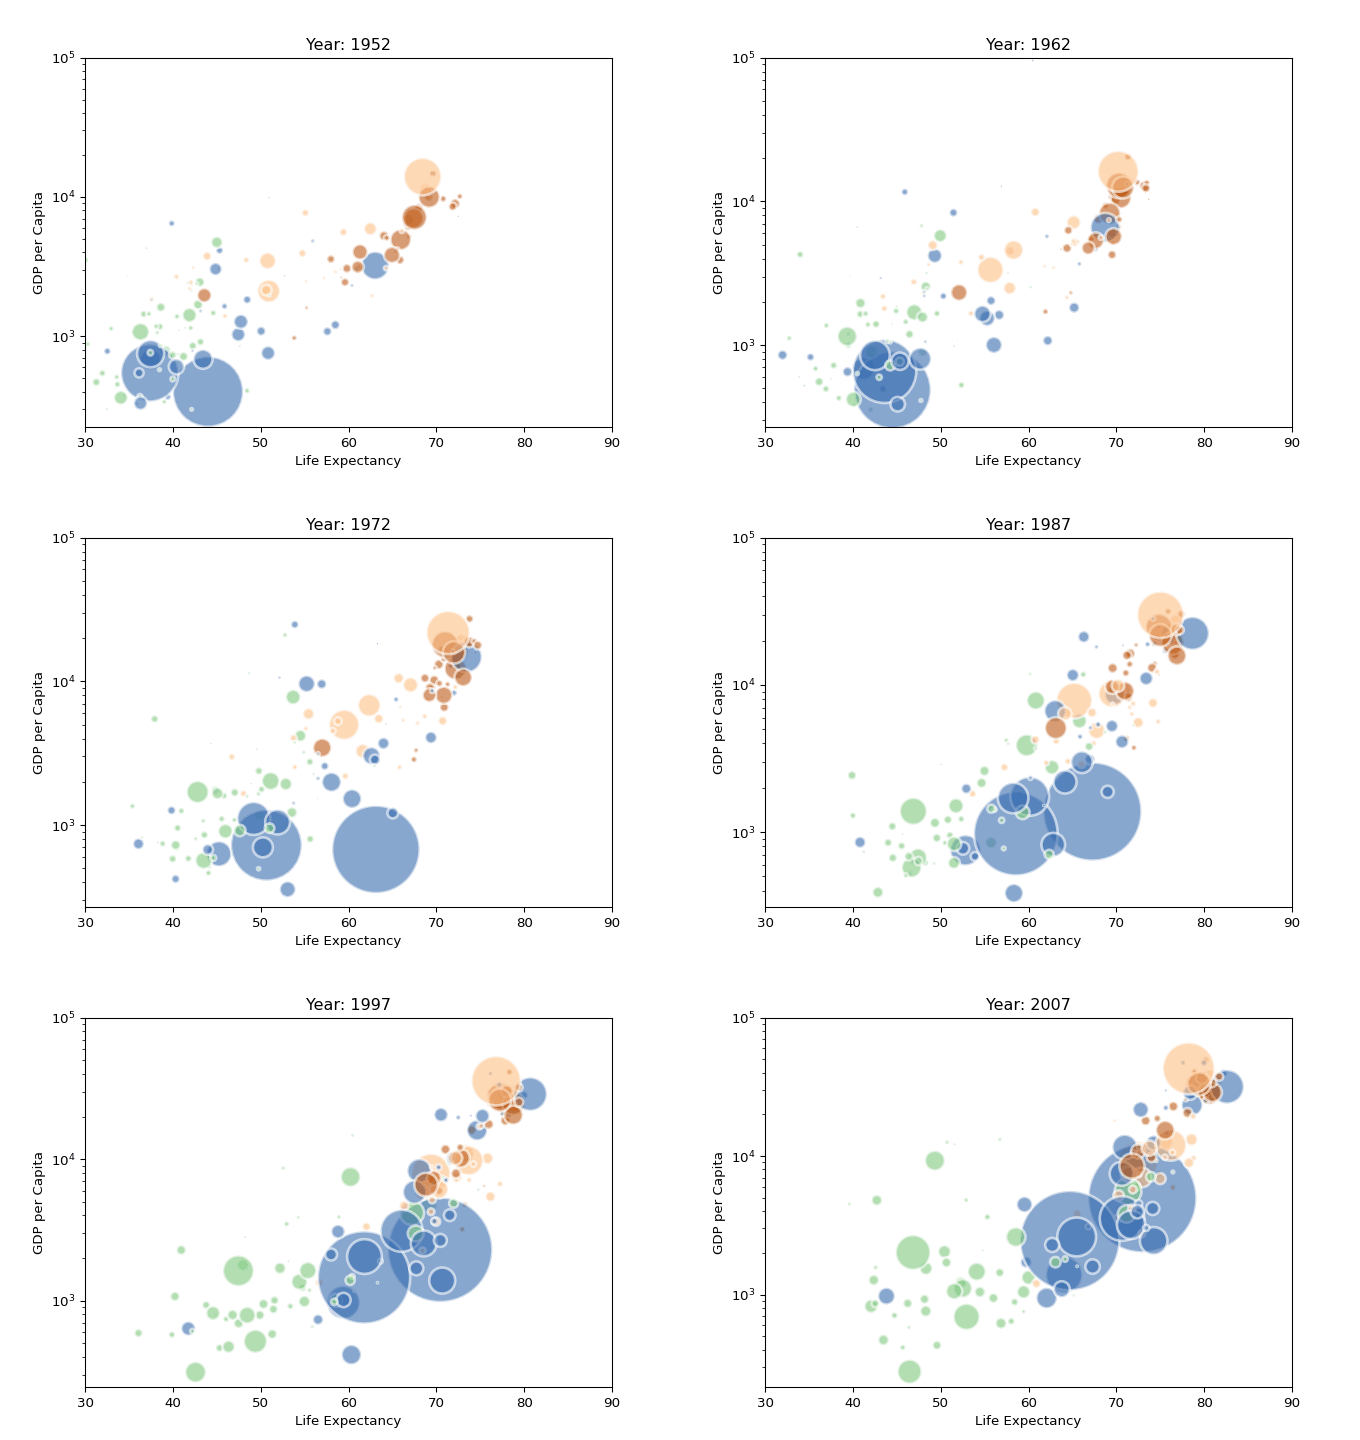


推荐语:一部ECharts的实战手册,内容系统而全面,由浅入深,能带领读者快速从新人晋级为高手,做出漂亮的商业级数据图表。
评论
