画图神器pyecharts-桑基图

Echarts是一个由百度开源的数据可视化,凭借着良好的交互性,精巧的图表设计,得到了众多开发者的认可。而 Python 是一门富有表达力的语言,很适合用于数据处理。当数据分析遇上数据可视化时,pyecharts 诞生了。
上周画的旭日图:画图神器pyecharts-旭日图,阅读比较多,看来比较受欢迎,今天再介绍个桑基图,也是非常好用的图。
桑基图(Sankey diagram),即桑基能量分流图,也叫桑基能量平衡图。它是一种特定类型的流程图,图中延伸的分支的宽度对应数据流量的大小,通常应用于能源、材料成分、金融等数据的可视化分析。
一、基本绘图
from pyecharts import options as opts
from pyecharts.charts import Sankey

nodes = [
    {"name": "category1"},
    {"name": "category2"},
    {"name": "category3"},
    {"name": "category4"},
    {"name": "category5"},
    {"name": "category6"},
]

links = [
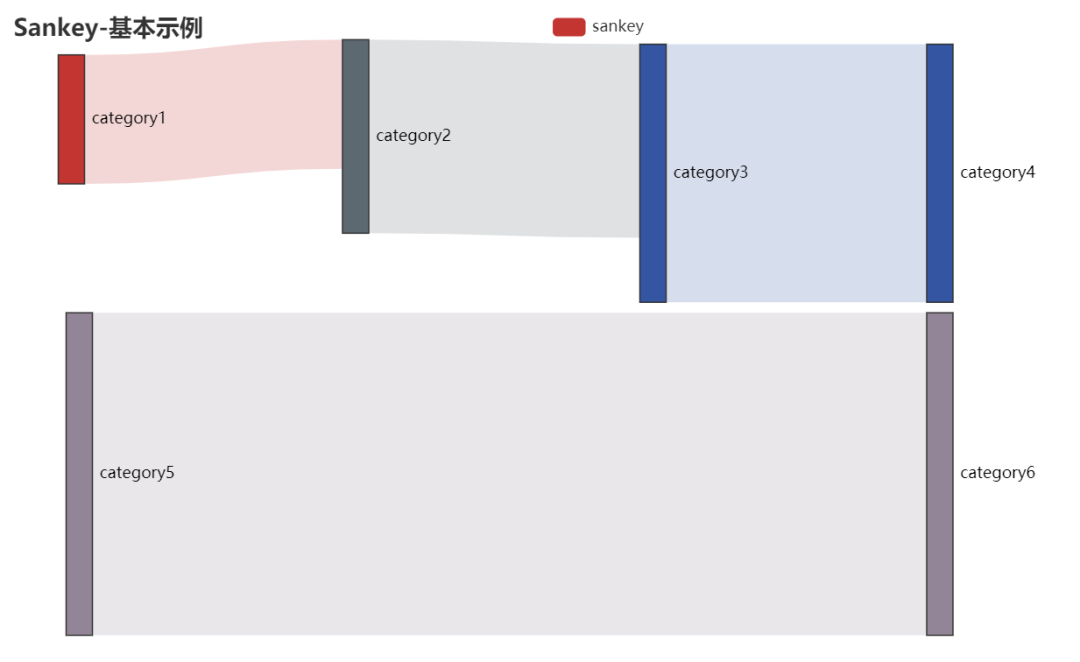
    {"source": "category1", "target": "category2", "value": 10},
    {"source": "category2", "target": "category3", "value": 15},
    {"source": "category3", "target": "category4", "value": 20},
    {"source": "category5", "target": "category6", "value": 25},
]
c = (
    Sankey()
    .add(
        "sankey",
        nodes,
        links,
        linestyle_opt=opts.LineStyleOpts(opacity=0.2, curve=0.5, color="source"),
        label_opts=opts.LabelOpts(position="right"),
    )
    .set_global_opts(title_opts=opts.TitleOpts(title="Sankey-基本示例"))
    .render("sankey_base.html")
)
二、复杂绘图
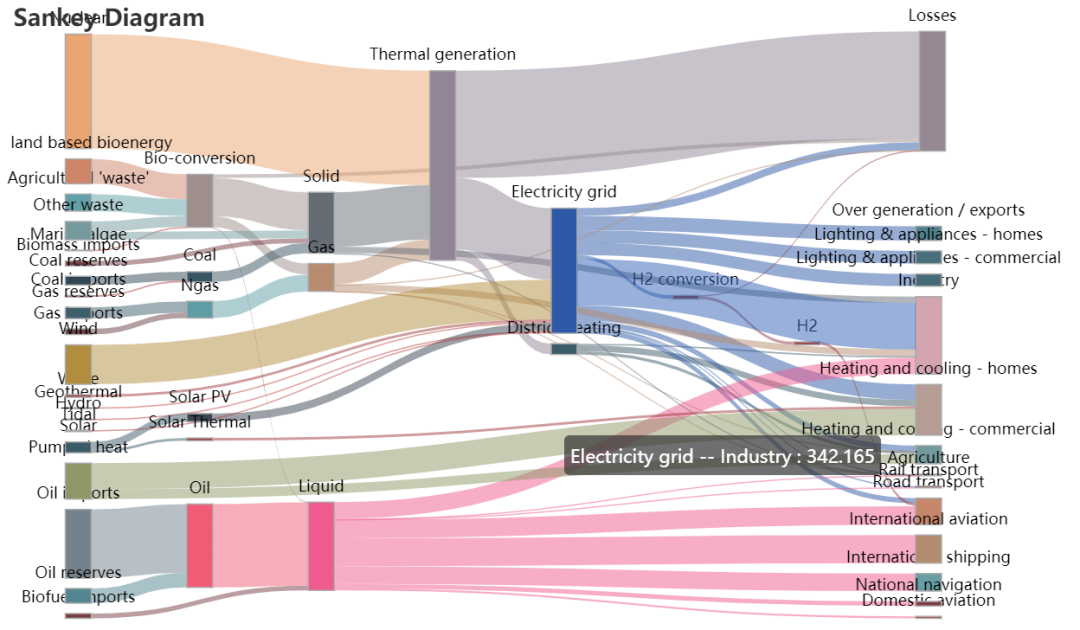
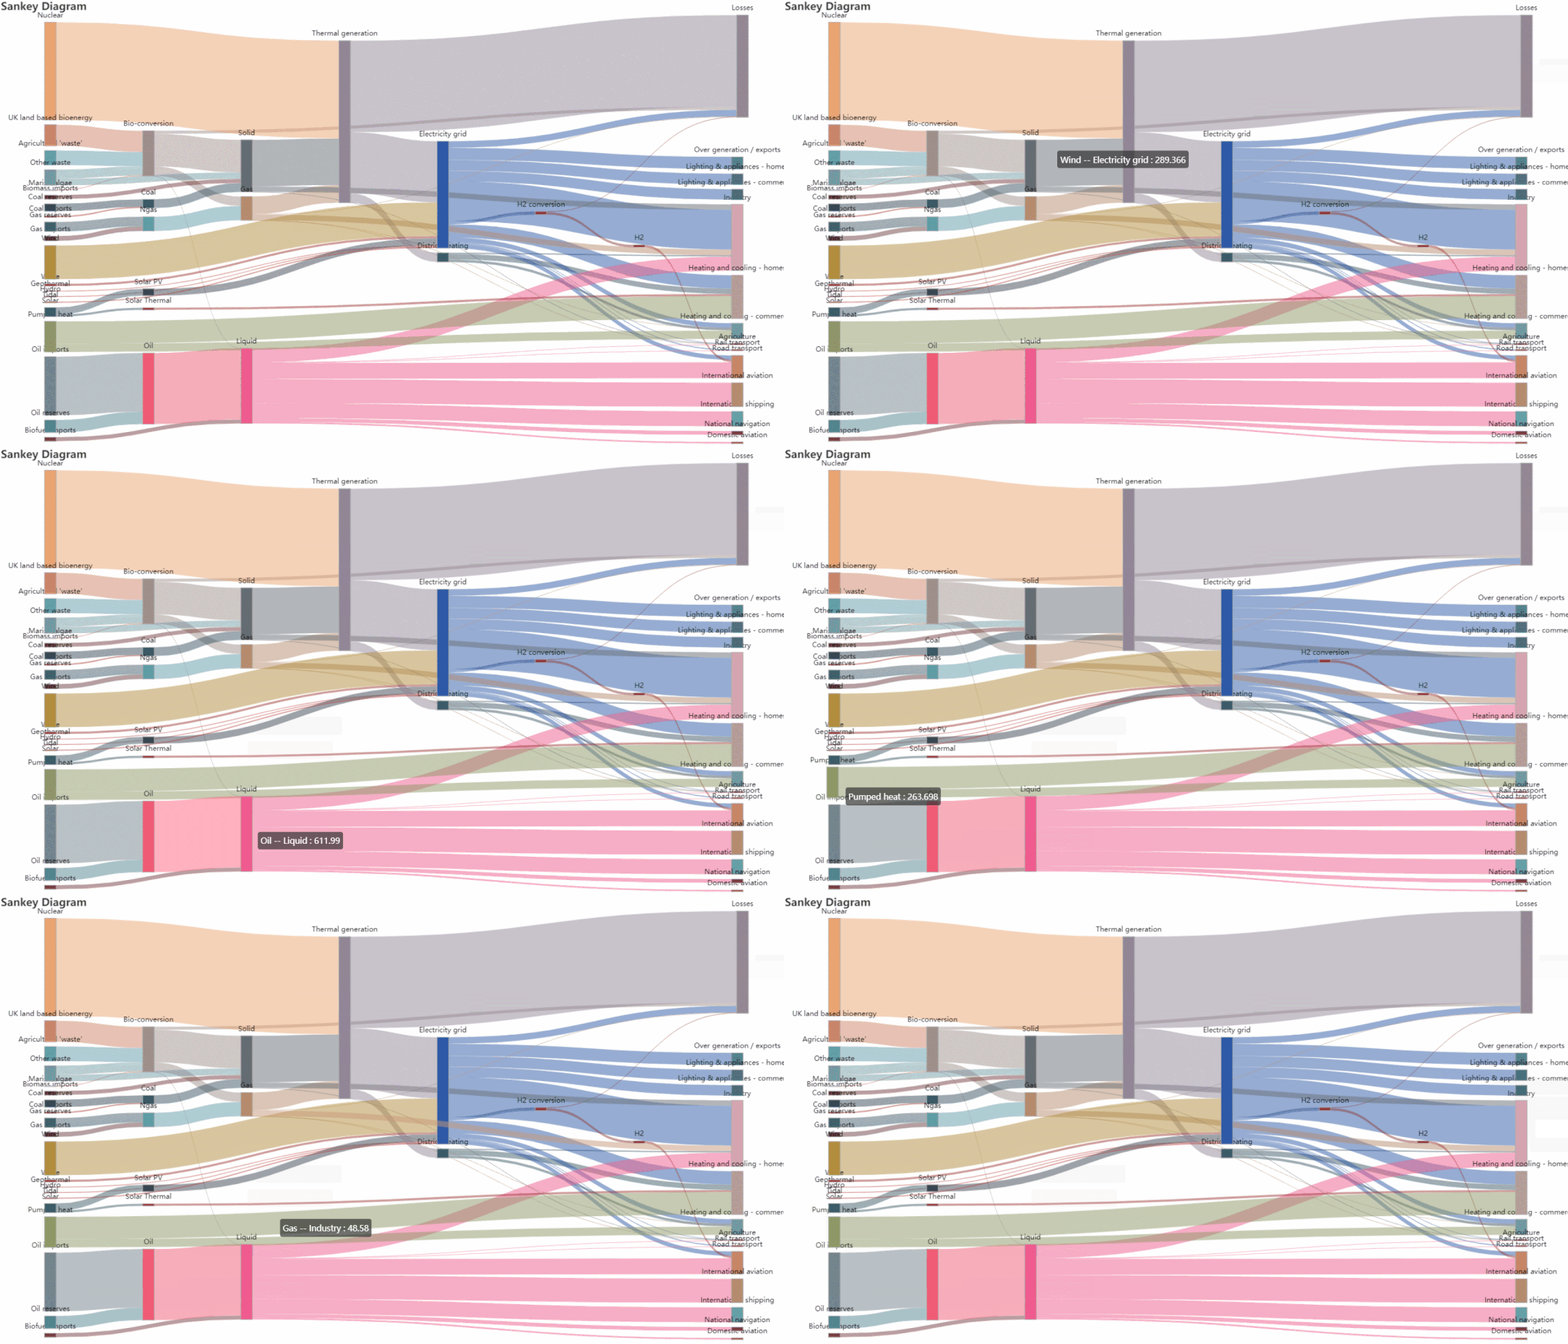
import asynciofrom aiohttp import TCPConnector, ClientSessionimport pyecharts.options as optsfrom pyecharts.charts import Sankey# 获取官方的数据,如果下载不了,直接从网站获取即可https://echarts.apache.org/examples/data/asset/data/energy.jsondata = asyncio.run(get_json_data(url="https://echarts.baidu.com/examples/data/asset/data/energy.json"))(Sankey(init_opts=opts.InitOpts(width="1600px", height="800px")).add(series_name="",nodes=data["nodes"],links=data["links"],itemstyle_opts=opts.ItemStyleOpts(border_width=1, border_color="#aaa"),linestyle_opt=opts.LineStyleOpts(color="source", curve=0.5, opacity=0.5),tooltip_opts=opts.TooltipOpts(trigger_on="mousemove"),).set_global_opts(title_opts=opts.TitleOpts(title="Sankey Diagram")).render("sankey_diagram.html"))

加群交流学习
评论
