用 Python 实现 RSI 指标线与股价的顶背离、底背离

当价格和您的指标向相反方向移动时,就会出现背离。例如,您使用 RSI 进行交易,它上次在 80 处达到峰值,现在在 70 处达到峰值。当 RSI 达到 80 时,您交易的标的证券价格为 14 美元,现在达到新的峰值 18 美元。这是一个背离。
由于峰值的趋势,交易者将价格称为“更高的高点”,将 RSI 称为“更低的高点”。技术交易者通过视觉跟踪但很难复制,因为并不总是清楚究竟是什么造就了“峰值”。我们提供了一种算法来检测交易的波峰和波谷,我们将在下面深入探讨构建 RSI 背离策略的细节时加以利用。
作为入场信号的背离
背离通常被称为“看跌”或“看涨”。看跌背离就像我们在上面的例子中看到的那样。我们有一个动量指标在价格之前减弱,这给了我们一个做空的点。看涨背离是我们的动量指标出现较高的低点,但价格较低的低点。
根据这种解释,背离是领先指标——背离发生在价格行为确认之前。在实践中,实现这一点更具挑战性,因为您会发现自己正在寻找价格和指标的峰值,并且直到经过一段时间后才能确认该值是峰值,因此您可以查看该值是否下降。
无论如何,让我们用一些代码来说明这是如何工作的!
检测背离
第一步将需要导入几个包。
import numpy as npimport pandas as pdimport matplotlib.pyplot as pltimport yfinance as yffrom scipy.signal import argrelextremafrom collections import deque
argrelextrema 用于检测 SciPy 信号处理库中的峰值,而 deque 就像一个固定长度的列表,如果超过它的长度,它将删除最旧的条目并保留新条目。我们将使用第一个来发现数据中的极值,然后循环遍历它们并保留高于先前条目的点。
为了找出极值,我们需要传递一个名为 order 的参数。这定义了我们实际需要在峰的两侧有多少个点来标记峰。因此,当 order=5 时,我们需要一些东西成为左右 5 个数据点内的最高点。我们提供的另一个参数是 K,它只是一个整数,用于确定我们想要识别多少个连续峰值以确定更高的高点趋势。
下面给出了完整的、更高的检测功能。
def getHigherHighs(data: np.array, order=5, K=2):'''Finds consecutive higher highs in price pattern.Must not be exceeded within the number of periods indicated by the widthparameter for the value to be confirmed.K determines how many consecutive highs need to be higher.'''# Get highshigh_idx = argrelextrema(data, np.greater, order=order)[0]highs = data[high_idx]# Ensure consecutive highs are higher than previous highsextrema = []ex_deque = deque(maxlen=K)for i, idx in enumerate(high_idx):if i == 0:ex_deque.append(idx)continueif highs[i] < highs[i-1]:ex_deque.clear()ex_deque.append(idx)if len(ex_deque) == K:extrema.append(ex_deque.copy())return extrema
这将返回包含峰值索引的双端队列列表。为了获得用于识别背离的所有相关组合,我们需要四个这样的函数,一个用于更高的高点(上图)、更低的低点、更低的高点和更高的低点。它们中的每一个的逻辑都是相同的,我们只是在第 9 行将 np.greater 更改为 np.less 并在第 18 行更改不等号以获得我们想要的行为。
我们需要一些数据,因此我们将从 Yahoo! 使用 yfinance 包的金融 API。我将使用埃克森美孚 (XOM),因为它在过去几十年中经历了相当多的繁荣和萧条。
start = '2011-01-01'end = '2011-07-31'ticker = 'XOM'yfObj = yf.Ticker(ticker)data = yfObj.history(start=start, end=end)# Drop unused columnsdata.drop(['Open', 'High', 'Low', 'Volume', 'Dividends','Stock Splits'], axis=1, inplace=True)
现在我们可以计算所有的极值并绘制结果。
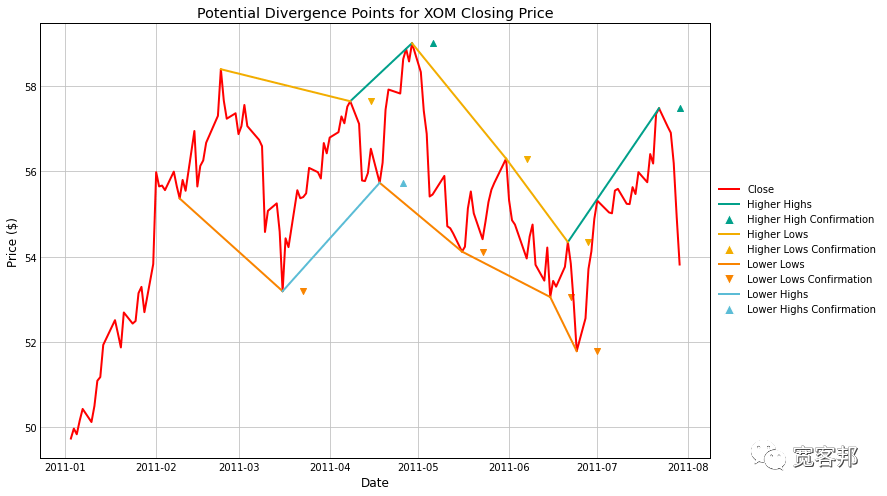
from matplotlib.lines import Line2D # For legendprice = data['Close'].valuesdates = data.index# Get higher highs, lower lows, etc.order = 5hh = getHigherHighs(price, order)lh = getLowerHighs(price, order)ll = getLowerLows(price, order)hl = getHigherLows(price, order)# Get confirmation indiceshh_idx = np.array([i[1] + order for i in hh])lh_idx = np.array([i[1] + order for i in lh])ll_idx = np.array([i[1] + order for i in ll])hl_idx = np.array([i[1] + order for i in hl])# Plot resultscolors = plt.rcParams['axes.prop_cycle'].by_key()['color']plt.figure(figsize=(12, 8))plt.plot(data['Close'])plt.scatter(dates[hh_idx], price[hh_idx-order], marker='^', c=colors[1])plt.scatter(dates[lh_idx], price[lh_idx-order], marker='v', c=colors[2])plt.scatter(dates[ll_idx], price[ll_idx-order], marker='v', c=colors[3])plt.scatter(dates[hl_idx], price[hl_idx-order], marker='^', c=colors[4])_ = [plt.plot(dates[i], price[i], c=colors[1]) for i in hh]_ = [plt.plot(dates[i], price[i], c=colors[2]) for i in lh]_ = [plt.plot(dates[i], price[i], c=colors[3]) for i in ll]_ = [plt.plot(dates[i], price[i], c=colors[4]) for i in hl]plt.xlabel('Date')plt.ylabel('Price ($)')plt.title(f'Potential Divergence Points for {ticker} Closing Price')legend_elements = [Line2D([0], [0], color=colors[0], label='Close'),Line2D([0], [0], color=colors[1], label='Higher Highs'),Line2D([0], [0], color='w', marker='^',markersize=10,markerfacecolor=colors[1],label='Higher High Confirmation'),Line2D([0], [0], color=colors[2], label='Higher Lows'),Line2D([0], [0], color='w', marker='^',markersize=10,markerfacecolor=colors[2],label='Higher Lows Confirmation'),Line2D([0], [0], color=colors[3], label='Lower Lows'),Line2D([0], [0], color='w', marker='v',markersize=10,markerfacecolor=colors[3],label='Lower Lows Confirmation'),Line2D([0], [0], color=colors[4], label='Lower Highs'),Line2D([0], [0], color='w', marker='^',markersize=10,markerfacecolor=colors[4],label='Lower Highs Confirmation')]plt.legend(handles=legend_elements, bbox_to_anchor=(1, 0.65))plt.show()

在这个图中,我们提取了所有潜在的分歧点,并将高点和低点映射到价格。另外,请注意我为每个峰值绘制了确认点。我们不知道峰值是否真的是峰值,直到我们给它几天(在这种情况下为 5 天)看看价格接下来会发生什么。
价格图表只是背离所需的一半,我们还需要应用一个指标。借鉴考夫曼出色的交易系统和方法,我们应该使用某种动量指标。我们将继续应用 RSI,尽管 MACD、随机指标等也适用。
RSI 的峰值和谷值
RSI 最常被解释为当该值高于中心线 (RSI=50) 时表现出上升势头,而当它低于中心线时表现出下降势头。如果我们有一系列高于 50 的较小峰值,则可能表明动能减弱,而低于 50 的一系列不断增加的谷可能表明我们可以交易的动能增加。
我们的下一步是计算 RSI,然后应用与上述相同的技术来提取相关的极值。
def calcRSI(data, P=14):data['diff_close'] = data['Close'] - data['Close'].shift(1)data['gain'] = np.where(data['diff_close']>0, data['diff_close'], 0)data['loss'] = np.where(data['diff_close']<0, np.abs(data['diff_close']), 0)data[['init_avg_gain', 'init_avg_loss']] = data[['gain', 'loss']].rolling(P).mean()avg_gain = np.zeros(len(data))avg_loss = np.zeros(len(data))for i, _row in enumerate(data.iterrows()):row = _row[1]if i < P - 1:last_row = row.copy()continueelif i == P-1:avg_gain[i] += row['init_avg_gain']avg_loss[i] += row['init_avg_loss']else:avg_gain[i] += ((P - 1) * avg_gain[i-1] + row['gain']) / Pavg_loss[i] += ((P - 1) * avg_loss[i-1] + row['loss']) / Plast_row = row.copy()data['avg_gain'] = avg_gaindata['avg_loss'] = avg_lossdata['RS'] = data['avg_gain'] / data['avg_loss']data['RSI'] = 100 - 100 / (1 + data['RS'])return data
有了该功能,我们可以将 RSI 及其相关列添加到我们的数据框中:
data = calcRSI(data.copy())# Get values to mark RSI highs/lows and plotrsi_hh = getHigherHighs(rsi, order)rsi_lh = getLowerHighs(rsi, order)rsi_ll = getLowerLows(rsi, order)rsi_hl = getHigherLows(rsi, order)
我们将遵循与上述相同的格式来绘制我们的结果:
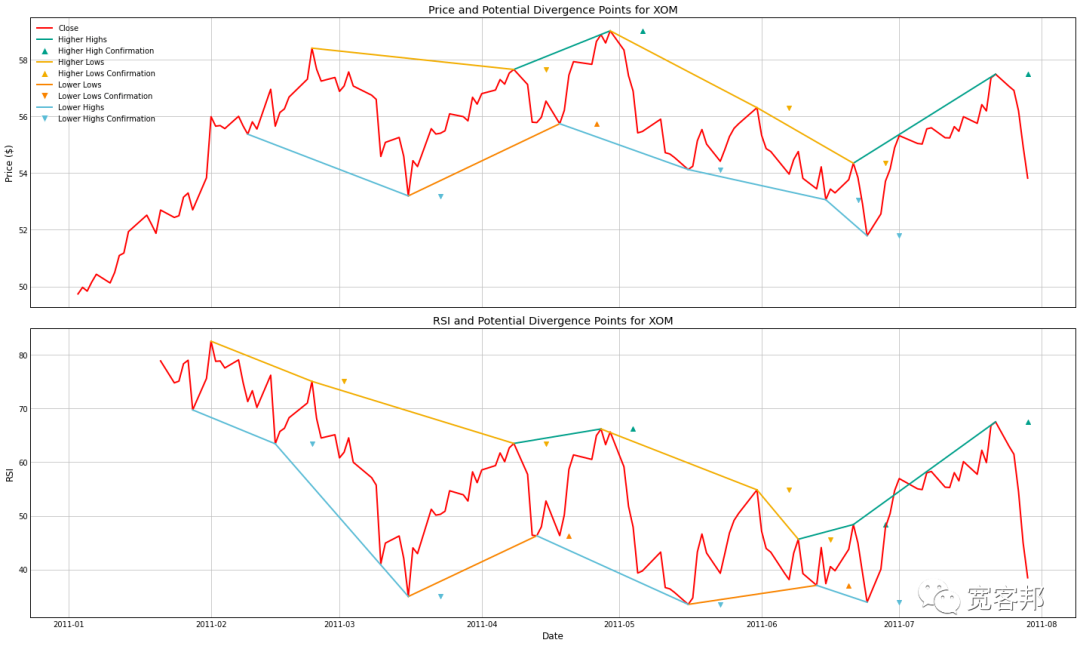
fig, ax = plt.subplots(2, figsize=(20, 12), sharex=True)ax[0].plot(data['Close'])ax[0].scatter(dates[hh_idx], price[hh_idx-order],marker='^', c=colors[1])ax[0].scatter(dates[lh_idx], price[lh_idx-order],marker='v', c=colors[2])ax[0].scatter(dates[hl_idx], price[hl_idx-order],marker='^', c=colors[3])ax[0].scatter(dates[ll_idx], price[ll_idx-order],marker='v', c=colors[4])_ = [ax[0].plot(dates[i], price[i], c=colors[1]) for i in hh]_ = [ax[0].plot(dates[i], price[i], c=colors[2]) for i in lh]_ = [ax[0].plot(dates[i], price[i], c=colors[3]) for i in hl]_ = [ax[0].plot(dates[i], price[i], c=colors[4]) for i in ll]ax[0].set_ylabel('Price ($)')ax[0].set_title(f'Price and Potential Divergence Points for {ticker}')ax[0].legend(handles=legend_elements)ax[1].plot(data['RSI'])ax[1].scatter(dates[rsi_hh_idx], rsi[rsi_hh_idx-order],marker='^', c=colors[1])ax[1].scatter(dates[rsi_lh_idx], rsi[rsi_lh_idx-order],marker='v', c=colors[2])ax[1].scatter(dates[rsi_hl_idx], rsi[rsi_hl_idx-order],marker='^', c=colors[3])ax[1].scatter(dates[rsi_ll_idx], rsi[rsi_ll_idx-order],marker='v', c=colors[4])_ = [ax[1].plot(dates[i], rsi[i], c=colors[1]) for i in rsi_hh]_ = [ax[1].plot(dates[i], rsi[i], c=colors[2]) for i in rsi_lh]_ = [ax[1].plot(dates[i], rsi[i], c=colors[3]) for i in rsi_hl]_ = [ax[1].plot(dates[i], rsi[i], c=colors[4]) for i in rsi_ll]ax[1].set_ylabel('RSI')ax[1].set_title(f'RSI and Potential Divergence Points for {ticker}')ax[1].set_xlabel('Date')plt.tight_layout()plt.show()

这只是一个短暂的 7 个月窗口,因此我们可以清楚地看到价格和 RSI 的走势,因此只有一个背离可见。我们在 RSI 图表(橙色,向上的三角形)上看到 6 月中旬在价格图表(蓝色,向下的三角形)中一系列较低的低点中间确认更高的低点。我们不权衡图表,所以让我们把一个算法放在一起来测试这个 RSI 背离模型。
建立 RSI 发散模型
到目前为止,我们有一些通用规则来识别我们有背离的情况,但我们仍然需要进入和退出规则。首先,我们可以求助于 Kaufmann 出色的交易系统和方法,在那里他列出了一个示例策略,其中包含以下规则:
如果指标高于目标水平(例如 RSI = 50),则在确定背离时输入头寸。如果指标背离消失,则退出。如果我们在价格创出更高的高点而 RSI 创出更低的高点时做空,那么我们的 RSI 会移动到更高的高点,那么我们就出局了。一旦指标达到目标水平就退出。允许背离转换为趋势位置。为此,我们使用单独的趋势指标(例如 EMA 交叉),如果趋势与背离方向相同,我们将持有头寸。如果背离消失但趋势继续,我们持有,并仅在趋势消失时退出。我们将根据 Kaufmann 规则构建两种模型,一种仅交易背离(规则 1-3),另一种具有背离加趋势(所有 4 条规则)。当然,您可以根据自己的需要随意修改这些,并自己尝试各种方法。
接下来,我将构建一些辅助函数来标记我们的峰值。第一组将修改我们的 getHigherHighs 函数组的输出。这些是为上述可视化而构建的,但我们只需要为我们的模型提取趋势的确认点。另请注意,由于我们正在向索引添加顺序,因此我们可能会获得会引发索引错误的确认点,因此我们会删除任何大于我们拥有的数据点数量的索引。
四个函数如下:
def getHHIndex(data: np.array, order=5, K=2):extrema = getHigherHighs(data, order, K)idx = np.array([i[-1] + order for i in extrema])return idx[np.where(idx<len(data))]def getLHIndex(data: np.array, order=5, K=2):extrema = getLowerHighs(data, order, K)idx = np.array([i[-1] + order for i in extrema])return idx[np.where(idx<len(data))]def getLLIndex(data: np.array, order=5, K=2):extrema = getLowerLows(data, order, K)idx = np.array([i[-1] + order for i in extrema])return idx[np.where(idx<len(data))]def getHLIndex(data: np.array, order=5, K=2):extrema = getHigherLows(data, order, K)idx = np.array([i[-1] + order for i in extrema])return idx[np.where(idx<len(data))]
为了减少重写代码,我将引入一个名为 getPeaks 的函数,它获取我们的数据帧并将我们的高点和低点的输出编码为列向量。它将使用我们上面定义的四个函数,并从我们触及更高高点到 Close_highs 列分配值 1。如果我们的高点在确认较低的高点后呈下降趋势,那么我们在同一列中用 -1 标记。它会为低点做同样的事情。记住哪些值为 1 哪些值为 -1 很重要,因此如果趋势正在增加(更高的高点或更高的低点),我将其设为 1,如果趋势正在下降(更低的高点或更低的低点),我将其设为 1 )。
def getPeaks(data, key='Close', order=5, K=2):vals = data[key].valueshh_idx = getHHIndex(vals, order, K)lh_idx = getLHIndex(vals, order, K)ll_idx = getLLIndex(vals, order, K)hl_idx = getHLIndex(vals, order, K)data[f'{key}_highs'] = np.nandata[f'{key}_highs'][hh_idx] = 1data[f'{key}_highs'][lh_idx] = -1data[f'{key}_highs'] = data[f'{key}_highs'].ffill().fillna(0)data[f'{key}_lows'] = np.nandata[f'{key}_lows'][ll_idx] = 1data[f'{key}_lows'][hl_idx] = -1data[f'{key}_lows'] = data[f'{key}_highs'].ffill().fillna(0)return data
最后,我们可以制定我们的战略。在这里,我们只是遵循上面列出的前 3 条规则。
def RSIDivergenceStrategy(data, P=14, order=5, K=2):'''Go long/short on price and RSI divergence.- Long if price to lower low and RSI to higher low with RSI < 50- Short if price to higher high and RSI to lower high with RSI > 50Sell if divergence disappears.Sell if the RSI crosses the centerline.'''data = getPeaks(data, key='Close', order=order, K=K)data = calcRSI(data, P=P)data = getPeaks(data, key='RSI', order=order, K=K)position = np.zeros(data.shape[0])# position[:] = np.nanfor i, (t, row) in enumerate(data.iterrows()):if np.isnan(row['RSI']):continue# If no position is onif position[i-1] == 0:# Buy if indicator to higher low and price to lower lowif row['Close_lows'] == -1 and row['RSI_lows'] == 1:if row['RSI'] < 50:position[i] = 1entry_rsi = row['RSI'].copy()# Short if price to higher high and indicator to lower highelif row['Close_highs'] == 1 and row['RSI_highs'] == -1:if row['RSI'] > 50:position[i] = -1entry_rsi = row['RSI'].copy()# If current position is longelif position[i-1] == 1:if row['RSI'] < 50 and row['RSI'] < entry_rsi:position[i] = 1# If current position is shortelif position[i-1] == -1:if row['RSI'] < 50 and row['RSI'] > entry_rsi:position[i] = -1data['position'] = positionreturn calcReturns(data)def calcReturns(df):# Helper function to avoid repeating too much codedf['returns'] = df['Close'] / df['Close'].shift(1)df['log_returns'] = np.log(df['returns'])df['strat_returns'] = df['position'].shift(1) * df['returns']df['strat_log_returns'] = df['position'].shift(1) * df['log_returns']df['cum_returns'] = np.exp(df['log_returns'].cumsum()) - 1df['strat_cum_returns'] = np.exp(df['strat_log_returns'].cumsum()) - 1df['peak'] = df['cum_returns'].cummax()df['strat_peak'] = df['strat_cum_returns'].cummax()return df
关于退出条件需要注意的一件事,我们要等待趋势的变化。我没有等待 5 天来确认 RSI 的峰值,而是添加了一个条件,即如果 RSI 跌破我们的多头仓位的入场 RSI 或高于我们的空头仓位的入场 RSI,我们应该退出。这是有效的,因为如果我们在 RSI 的较低高点做空,那么如果情况逆转,我们将退出。如果 RSI 收于我们的入场 RSI 上方,那么要么成为更高的高点,从而打破我们的趋势,要么更高的高点仍将到来。设置这个条件只会让我们更快地退出交易。
好了,解释够了,让我们用 2000-2020 年的数据测试一下。
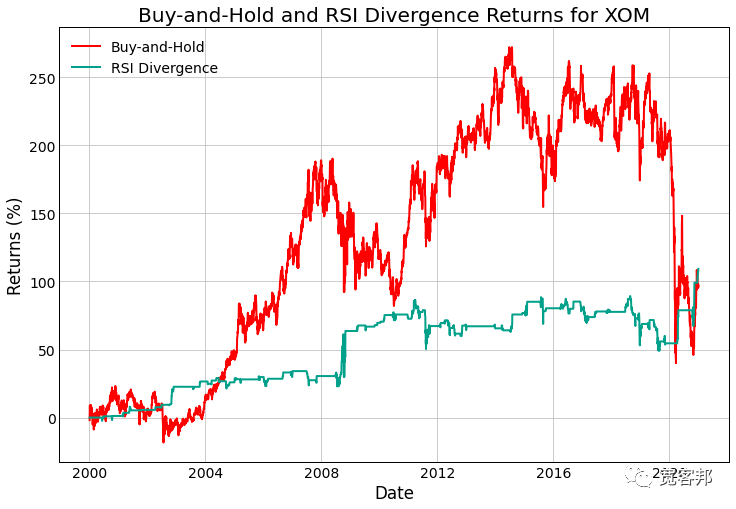
start = '2000-01-01'end = '2020-12-31'data = yfObj.history(start=start, end=end)# Drop unused columnsdata.drop(['Open', 'High', 'Low', 'Volume', 'Dividends','Stock Splits'], axis=1, inplace=True)df_div = RSIDivergenceStrategy(data.copy())plt.figure(figsize=(12, 8))plt.plot(df_div['cum_returns'] * 100, label='Buy-and-Hold')plt.plot(df_div['strat_cum_returns'] * 100, label='RSI Divergence')plt.xlabel('Date')plt.ylabel('Returns (%)')plt.title(f'Buy-and-Hold and RSI Divergence Returns for {ticker}')plt.legend()plt.show()df_stats = pd.DataFrame(getStratStats(df_div['log_returns']),index=['Buy and Hold'])df_stats = pd.concat([df_stats,pd.DataFrame(getStratStats(df_div['strat_log_returns']),index=['Divergence'])])df_stats


最后,背离策略的表现优于买入并持有的策略(忽略埃克森美孚支付的股息)。它的波动性较小,跌幅较小,但在 2004 年至 2020 年期间表现不佳。换句话说,在 2020 年突破之前,你会等待 16 年,而这种策略看起来像是对底层证券的亏损。这种策略可能在其他地方更有效或适合多元化的投资组合,但至少在这种情况下, 纯 RSI 背离策略看起来不太好。
RSI 背离和趋势
对于下一个模型,让我们采用 Kaufman 的建议并应用趋势转换。为此,我们将选择 EMA 交叉。因此,该模型将像我们上面看到的背离模型一样进行交易,但会检查我们的 EMA 交叉所指示的趋势。如果我们做多且 EMA1 > EMA2,我们将保持该头寸。
EMA 计算代码和策略如下:
def _calcEMA(P, last_ema, N):return (P - last_ema) * (2 / (N + 1)) + last_emadef calcEMA(data, N):# Initialize seriesdata['SMA_' + str(N)] = data['Close'].rolling(N).mean()ema = np.zeros(len(data))for i, _row in enumerate(data.iterrows()):row = _row[1]if i < N:ema[i] += row['SMA_' + str(N)]else:ema[i] += _calcEMA(row['Close'], ema[i-1], N)data['EMA_' + str(N)] = ema.copy()return datadef RSIDivergenceWithTrendStrategy(data, P=14, order=5, K=2, EMA1=50, EMA2=200):'''Go long/short on price and RSI divergence.- Long if price to lower low and RSI to higher low with RSI < 50- Short if price to higher high and RSI to lower high with RSI > 50Sell if divergence disappears or if the RSI crosses the centerline, unlessthere is a trend in the same direction.'''data = getPeaks(data, key='Close', order=order, K=K)data = calcRSI(data, P=P)data = getPeaks(data, key='RSI', order=order, K=K)data = calcEMA(data, EMA1)data = calcEMA(data, EMA2)position = np.zeros(data.shape[0])# position[:] = np.nanfor i, (t, row) in enumerate(data.iterrows()):if np.isnan(row['RSI']):continue# If no position is onif position[i-1] == 0:# Buy if indicator to higher high and price to lower highif row['Close_lows'] == -1 and row['RSI_lows'] == 1:if row['RSI'] < 50:position[i] = 1entry_rsi = row['RSI'].copy()# Short if price to higher high and indicator to lower highelif row['Close_highs'] == 1 and row['RSI_highs'] == -1:if row['RSI'] > 50:position[i] = -1entry_rsi = row['RSI'].copy()# If current position is longelif position[i-1] == 1:if row['RSI'] < 50 and row['RSI'] < entry_rsi:position[i] = 1elif row[f'EMA_{EMA1}'] > row[f'EMA_{EMA2}']:position[i] = 1# If current position is shortelif position[i-1] == -1:if row['RSI'] < 50 and row['RSI'] > entry_rsi:position[i] = -1elif row[f'EMA_{EMA1}'] < row[f'EMA_{EMA2}']:position[i] = -1data['position'] = positionreturn calcReturns(data)
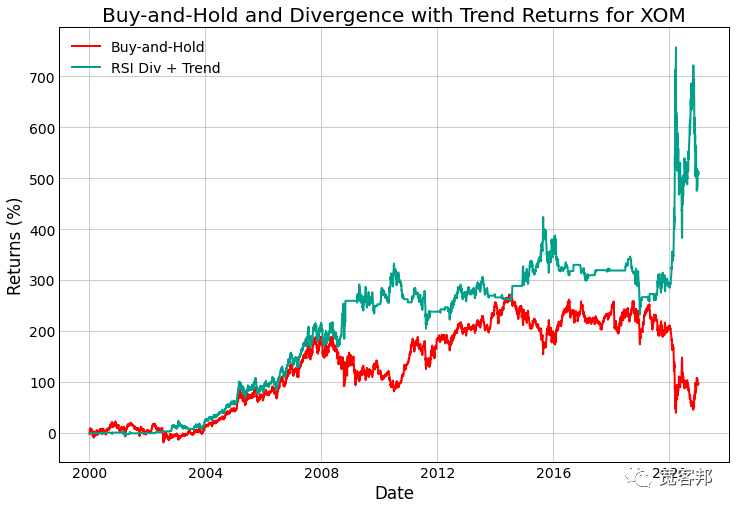
在我们的数据上运行这个模型,我们得到:
plt.figure(figsize=(12, 8))plt.plot(df_trend['cum_returns'] * 100, label=f'Buy-and-Hold')plt.plot(df_trend['strat_cum_returns'] * 100, label='RSI Div + Trend')plt.xlabel('Date')plt.ylabel('Returns (%)')plt.title(f'Buy-and-Hold and Divergence with Trend Returns for {ticker}')plt.legend()plt.show()df_trend = RSIDivergenceWithTrendStrategy(data.copy())df_stats = pd.concat([df_stats,pd.DataFrame(getStratStats(df_trend['strat_log_returns']),index=['Div + Trend'])])df_stats


添加我们的趋势指标大大增加了我们的回报。它以较低的波动性(尽管比 RSI 背离策略更多)和较高的风险调整回报。最大回撤小于底层证券经历的最大回撤,而且持续时间更短。
你准备好交易了吗?
我们研究了两种 RSI 背离策略的编码和交易,一种很好,另一种则不然。这是否意味着您应该出去用 EMA 交叉交易 RSI 背离?
在这里给你一些关于这些指标的想法和解释。这些快速的回测很有用,因为您可以了解如何测试想法,并且可以在各种证券和市场上进行测试以开始缩小选择范围。也许更严格的测试表明 RSI 背离是您系统中真正有价值的部分,而趋势模型是一个异常值。除非你测试它,否则你永远不会知道!
