【机器学习】Github8.9K,目前最佳模型解释器-LIME!
模型解释性--LIME算法

简单的模型例如线性回归,LR等模型非常易于解释,但在实际应用中的效果却远远低于复杂的梯度提升树模型以及神经网络等模型。现在大部分互联网公司的建模都是基于梯度提升树或者神经网络模型等复杂模型,遗憾的是,这些模型虽然效果好,但是我们却较难对其进行很好地解释,这也是目前一直困扰着大家的一个重要问题,现在大家也越来越加关注模型的解释性。
本文介绍一种解释机器学习模型输出的方法LIME。

LIME(Local Interpretable Model-agnostic Explanations)支持的模型包括:
结构化模型的解释; 文本分类器的解释; 图像分类器的解释;
LIME被用作解释机器学习模型的解释,通过LIME我们可以知道为什么模型会这样进行预测。
本文我们就重点观测一下LIME是如何对预测结果进行解释的。

此处我们使用winequality-white数据集,并且将quality<=5设置为0,其它的值转变为1.
# !pip install lime
import pandas as pd
from xgboost import XGBClassifier
import shap
import numpy as np
from sklearn.model_selection import train_test_split
df = pd.read_csv('./data/winequality-white.csv',sep = ';')
df['quality'] = df['quality'].apply(lambda x: 0 if x <= 5 else 1)
df.head()
| fixed acidity | volatile acidity | citric acid | residual sugar | chlorides | free sulfur dioxide | total sulfur dioxide | density | pH | sulphates | alcohol | quality | |
|---|---|---|---|---|---|---|---|---|---|---|---|---|
| 0 | 7.0 | 0.27 | 0.36 | 20.7 | 0.045 | 45.0 | 170.0 | 1.0010 | 3.00 | 0.45 | 8.8 | 1 |
| 1 | 6.3 | 0.30 | 0.34 | 1.6 | 0.049 | 14.0 | 132.0 | 0.9940 | 3.30 | 0.49 | 9.5 | 1 |
| 2 | 8.1 | 0.28 | 0.40 | 6.9 | 0.050 | 30.0 | 97.0 | 0.9951 | 3.26 | 0.44 | 10.1 | 1 |
| 3 | 7.2 | 0.23 | 0.32 | 8.5 | 0.058 | 47.0 | 186.0 | 0.9956 | 3.19 | 0.40 | 9.9 | 1 |
| 4 | 7.2 | 0.23 | 0.32 | 8.5 | 0.058 | 47.0 | 186.0 | 0.9956 | 3.19 | 0.40 | 9.9 | 1 |
# 训练集测试集分割
X = df.drop('quality', axis=1)
y = df['quality']
X_train, X_test, y_train, y_test = train_test_split(X, y, test_size=0.2, random_state=1)
# 模型训练
model = XGBClassifier(n_estimators = 100, random_state=42)
model.fit(X_train, y_train)
score = model.score(X_test, y_test)
score
The use of label encoder in XGBClassifier is deprecated and will be removed in a future release.

0.832653061224489
对单个样本进行预测解释
下面的图中表明了单个样本的预测值中各个特征的贡献。
import lime
from lime import lime_tabular

explainer = lime_tabular.LimeTabularExplainer(
    training_data=np.array(X_train),
    feature_names=X_train.columns,
    class_names=['bad', 'good'],
    mode='classification'
)
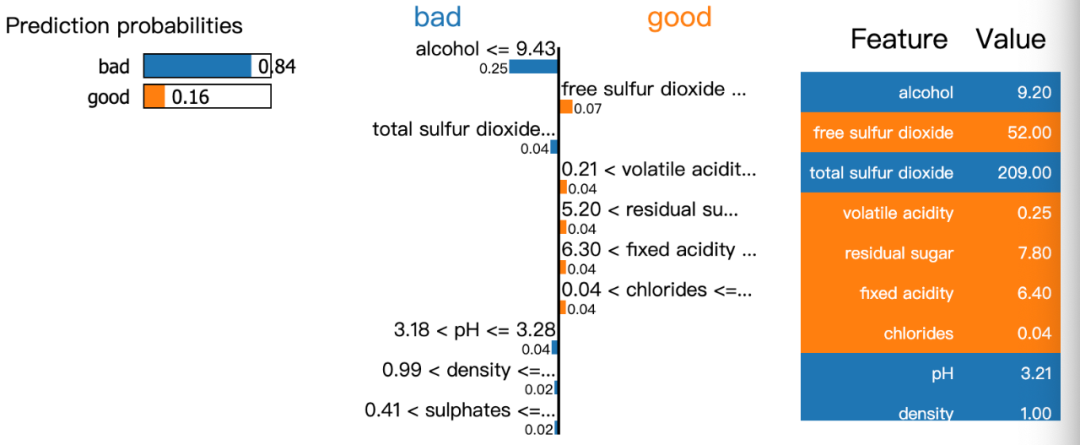
模型有84%的置信度是坏的wine,而其中alcohol,total sulfur dioxide是最重要的。

exp = explainer.explain_instance(data_row=X_test.iloc[1], predict_fn=model.predict_proba)
exp.show_in_notebook(show_table=True)
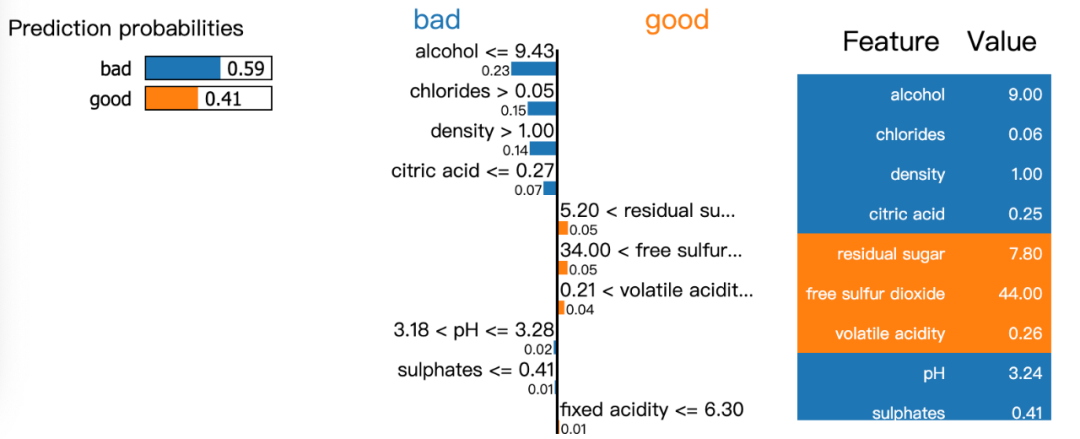
模型有59%的置信度是坏的wine,而其中alcohol,chlorides, density, citric acid是最重要的预测参考因素。

exp = explainer.explain_instance(data_row=X_test.iloc[3], predict_fn=model.predict_proba)
exp.show_in_notebook(show_table=True)
LIME可以认为是SHARP的升级版,它通过预测结果解释机器学习模型很简单。它为我们提供了一个很好的方式来向非技术人员解释地下发生了什么。您不必担心数据可视化,因为LIME库会为您处理数据可视化。

https://www.kaggle.com/piyushagni5/white-wine-quality LIME: How to Interpret Machine Learning Models With Python https://github.com/marcotcr/lime
往期精彩回顾 本站qq群851320808,加入微信群请扫码:
评论
