一行代码让matplotlib图表变高大上

导读:懒人数据可视化必备。

02 利用dufte自动改造matplotlib图表
1. 主题设置
# 局部主题设置
with plt.style.context(主题):
    # 绘图代码
    ...
import dufte
import numpy as np
import matplotlib.pyplot as plt
from matplotlib import font_manager

# 注册本地思源宋体
fontproperties = font_manager.FontProperties(fname='NotoSerifSC-Regular.otf')折线图
# 折线图示例
with plt.style.context(dufte.style):
    x = range(100)
    y = np.random.standard_normal(100).cumsum()

    fig, ax = plt.subplots(figsize=(10, 5), facecolor='white', edgecolor='white')

    ax.plot(x, y, linestyle='-.', color='#607d8b')

    ax.set_xlabel('x轴示例', fontproperties=fontproperties, fontsize=16)
    ax.set_ylabel('y轴示例', fontproperties=fontproperties, fontsize=16)

    ax.set_title('折线图示例', fontproperties=fontproperties, fontsize=20)

    fig.savefig('图2.png', dpi=300, bbox_inches='tight')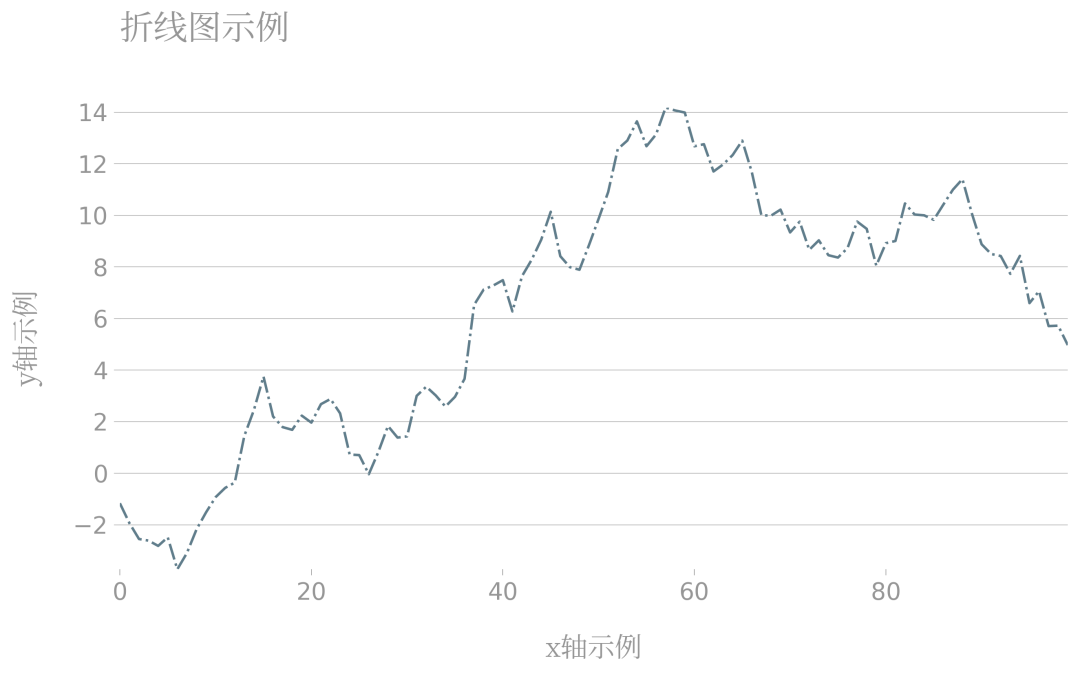
柱状图
# 柱状图示例
with plt.style.context(dufte.style):
    x = range(25)
    y = np.random.standard_normal(25)

    fig, ax = plt.subplots(figsize=(10, 5), facecolor='white', edgecolor='white')

    ax.bar(x, y)

    ax.set_xlabel('x轴示例', fontproperties=fontproperties, fontsize=16)
    ax.set_ylabel('y轴示例', fontproperties=fontproperties, fontsize=16)

    ax.set_title('柱状图示例', fontproperties=fontproperties, fontsize=20)

    fig.savefig('图3.png', dpi=300, bbox_inches='tight')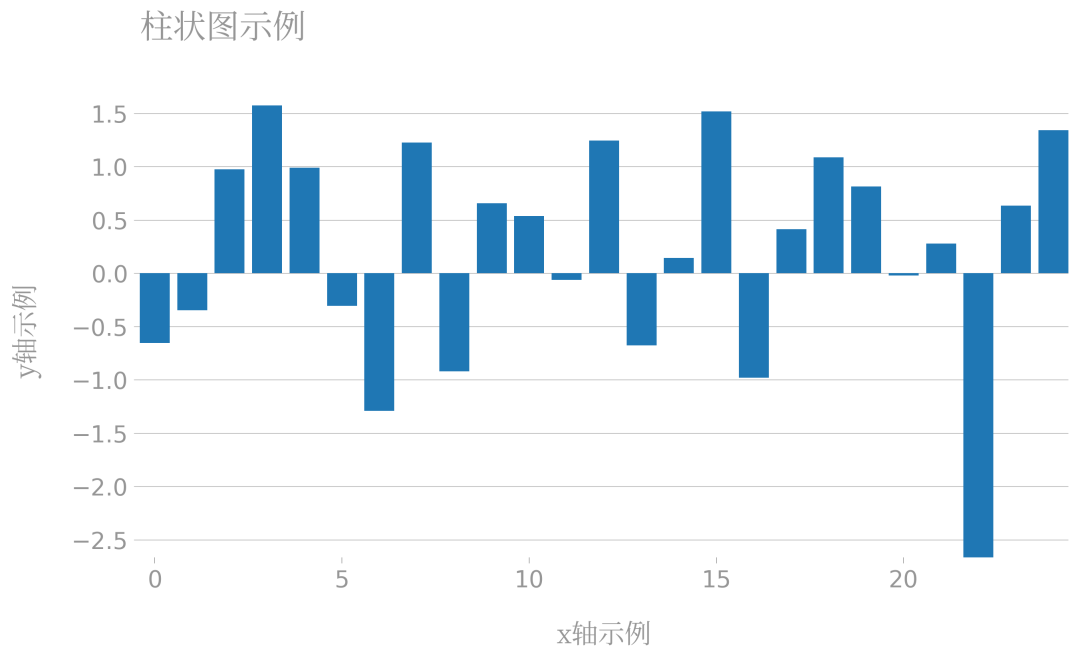
2. 自动图例美化
# 折线图示例
with plt.style.context(dufte.style):
    x = range(100)
    y1 = np.random.randint(-5, 6, 100).cumsum()
    y2 = np.random.randint(-5, 10, 100).cumsum()
    y3 = np.random.randint(-5, 6, 100).cumsum()

    fig, ax = plt.subplots(figsize=(10, 5), facecolor='white', edgecolor='white')

    ax.plot(x, y1, linestyle='dotted', label='Series 1')
    ax.plot(x, y2, linestyle='dashed', label='Series 2')
    ax.plot(x, y3, linestyle='dashdot', label='Series 3')

    ax.set_xlabel('x轴示例', fontproperties=fontproperties, fontsize=16)
    ax.set_ylabel('y轴示例', fontproperties=fontproperties, fontsize=16)

    dufte.legend()

    ax.set_title('dufte.legend()示例', fontproperties=fontproperties, fontsize=20)

    fig.savefig('图4.png', dpi=300, bbox_inches='tight')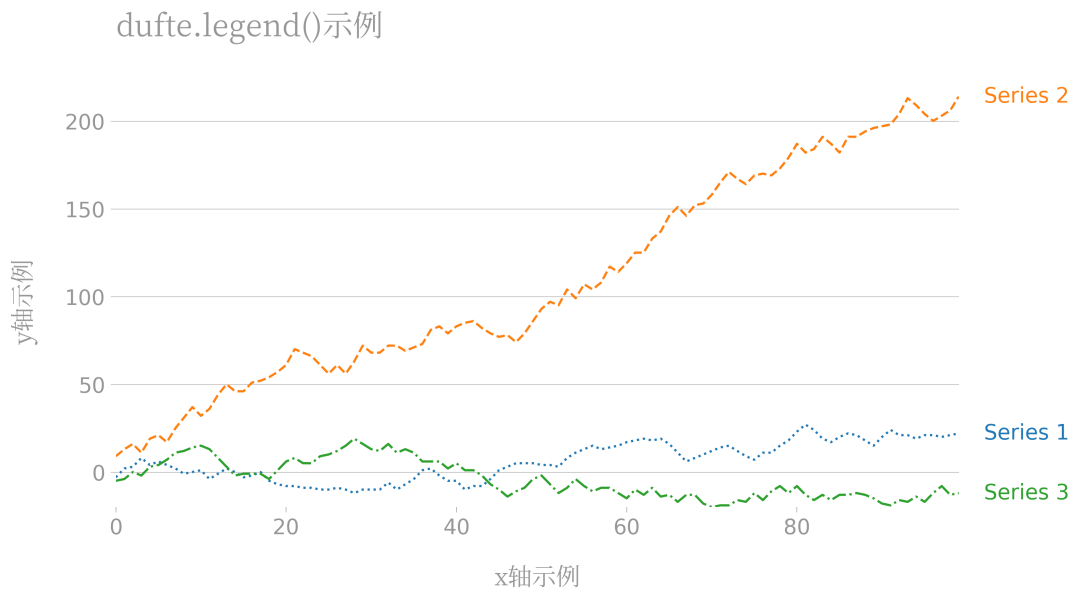
3. 柱状图自动标注
# 柱状图示例
with plt.style.context(dufte.style):
    x = range(15)
    y = np.random.randint(5, 15, 15)

    fig, ax = plt.subplots(figsize=(10, 5), facecolor='white', edgecolor='white')

    ax.bar(x, y)

    ax.set_xticks(x)
    ax.set_xticklabels([f'项目{i}' for i in x], fontproperties=fontproperties, fontsize=10)
    dufte.show_bar_values()

    ax.set_xlabel('x轴示例', fontproperties=fontproperties, fontsize=16)
    ax.set_ylabel('y轴示例', fontproperties=fontproperties, fontsize=16)

    ax.set_title('柱状图示例', fontproperties=fontproperties, fontsize=20)

    fig.savefig('图5.png', dpi=300, bbox_inches='tight')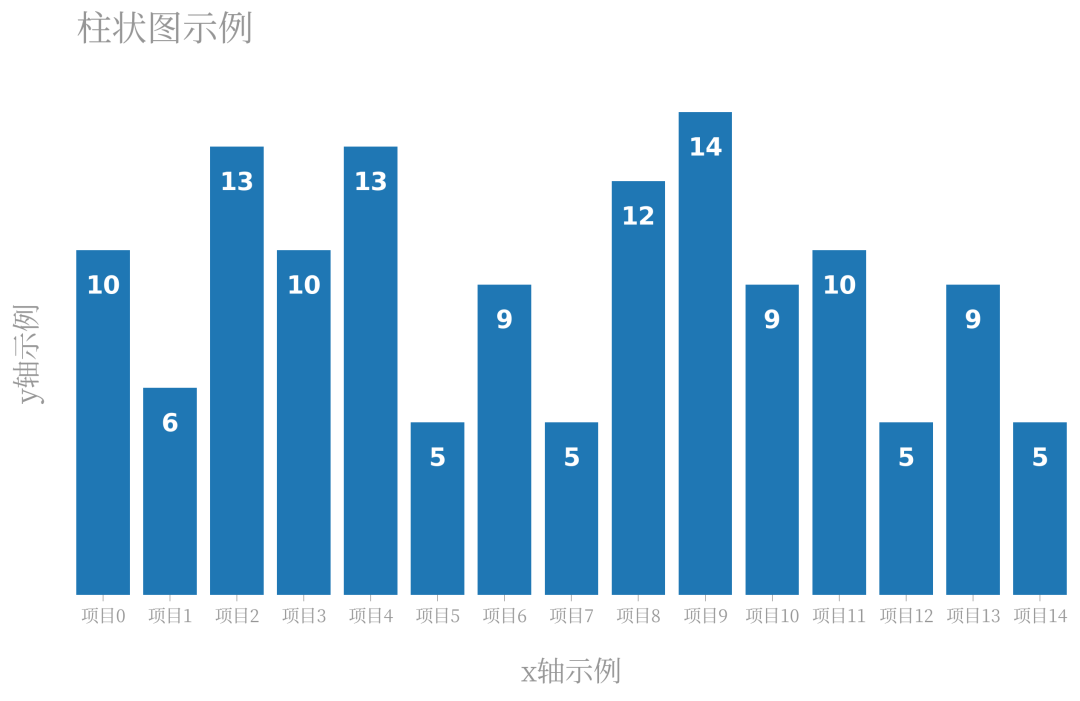

评论
