
用Canvas实现一个动态甜甜圈图表


导语:在实现复杂动画或复杂图表的时候,css 往往不能或难以简洁方便的实现;而 canvas 给了你一张白纸和多彩的画笔,给与你无限的想象空间。
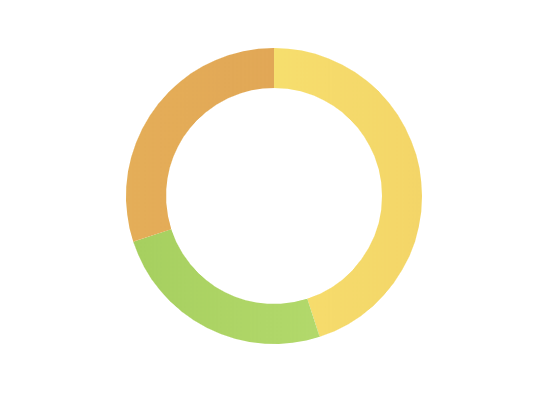
目标动画
动画分析
元素分析:
多部分组成的环并带有线性渐变效果
环的两端有椭圆
从环上衍生出去的线条
在线条末尾的图例
环正中的标题
动画拆解:
环有一个 ease-in-out 的展开动画
线有一个延伸动画
图例有一个透明度渐变动画
2
开始动手
注:
下面代码中的
this上挂载了canvas.getContext('2d')获取的ctx。下面代码中使用的
ctx.width是在获取到ctx的时候手动挂载上去方便使用的。下面代码中
source为处理后的数据。R1、R2分别表示圆环的内径和外径。下面代码中存在一些未给出实现的工具函数和常量定义,可拉取项目查看。项目地址:https://github.com/chym123/donut-graph-demo
构造数据
text 表示项目名
per 表示占比
startColor、stopColor 表示渐变色区间
ellipseColor 表示椭圆颜色
const donutData = [{per: 0.45,text: '学习课',startColor: '#FFEA33', // 黄色stopColor: '#d8b616',ellipseColor: '#FFD333',}, {per: 0.25,text: '复习课',startColor: '#7bc31f', // 绿色stopColor: '#96ec26',ellipseColor: '#8FD43D',}, {per: 0.3,text: '拓展课',startColor: '#f0870c', // 橙色stopColor: '#ff9413',ellipseColor: '#FF8221',}];
画环
常见的绘制方法是用 ctx.arc 定义弧线,然后用 ctx.stroke 画一条粗线条:
drawRing(startDeg, endDeg, strokeStyle, ellipseColor) {const { ctx } = this;ctx.save();ctx.strokeStyle = strokeStyle;ctx.beginPath();ctx.lineWidth = R2 - R1;ctx.arc(ctx.width / 2, ctx.height / 2, (R1 + R2) / 2, arcDeg(startDeg), arcDeg(endDeg));ctx.stroke();ctx.restore();// this.drawEllipse(startDeg, ellipseColor);// this.drawEllipse(endDeg, ellipseColor);},
draw() {const { source } = this;source.forEach((s) => {const { startPer, per, lgr, ellipseColor } = s;const startDeg = startPer * ANGLE_360;const endDeg = (startPer + per) * ANGLE_360;this.drawRing(startDeg, endDeg, lgr, ellipseColor);});}
getLinearGradient(startColor, stopColor) {const { ctx } = this;const lgr = ctx.createLinearGradient(ctx.width / 2 - R2, ctx.height / 2, ctx.width / 2 + R2, ctx.height / 2);lgr.addColorStop(0, startColor);lgr.addColorStop(1, stopColor);return lgr;}
画椭圆
先分析一下:
椭圆在每个部分的起点和终点,并且存在一定的旋转角度,长轴和半径在一条直线上;
canvas 里先绘制的像素会被后绘制的像素覆盖,所以要确保绘制顺序正确。
实现椭圆绘制方法:
drawEllipse(rotate, color) {const { ctx } = this;rotate = deg(rotate);// 不使用画布旋转时的坐标计算方法// const x = ctx.width / 2 + (R1 + R2) / 2 * Math.cos(rotate);// const y = ctx.height / 2 + (R1 + R2) / 2 * Math.sin(rotate);// 画布旋转时,只需要让椭圆圆心定位在弧线的 0 度处const x = 0;const y = -(R1 + R2) / 2;ctx.save();// 设置 canvas 中心到画布中心并旋转ctx.translate(ctx.width / 2, ctx.height / 2);ctx.rotate(rotate);ctx.moveTo(x, y);ctx.beginPath();ctx.fillStyle = color;// 某些情况下 ellipse 的第五个参数 rotate 有兼容性问题无法旋转,但是椭圆可以画出来// ctx.ellipse(x, y, EllipseR2, EllipseR1, rotate, 0, 2 * Math.PI);ctx.ellipse(x, y, EllipseR2, EllipseR1, 0, 0, 2 * Math.PI);ctx.fill();ctx.restore();}
drawRing 函数内注释掉的 drawEllipse 方法得到下图: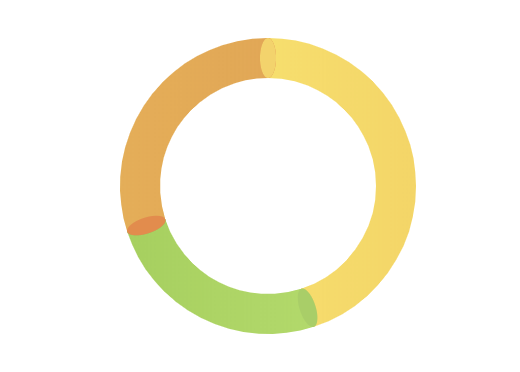
画图例
图例和圆环的位置相关,所以把图例相关的绘制工作封装成图例类:
class Legend {constructor({ ctx, x, y, textMaxWidth, endX, startColor, stopColor, text }) {this.ctx = ctx;this.x = x; // 横线的起点 x 坐标this.y = y; // 横线的 y 坐标this.endX = endX; // 横线的终点 x 坐标this.textMaxWidth = textMaxWidth; // 图例文字最大宽度this.text = text; // 图例文字this.dot = { // 图例起点小圆点属性r: 2.5,opacity: 0.8,};this.icon = { // 图例 icon 属性h: 12,w: 12,r: 5,marginRight: 4,startColor, // 渐变色起点stopColor // 渐变色终点};}// 图标和文字距离横线的数值static MARGIN_BOTTOM = 4;// 文字的行高static LINE_HEIGHT = 14;}
图例的起点小圆点
只是一个半透明的小圆点,用 arc 直接画:
drawLegendDot() {const { ctx, x, y } = this;const { r, opacity } = this.dot;ctx.save();ctx.globalAlpha = opacity;ctx.beginPath();ctx.fillStyle = '#FFFFFF';ctx.arc(x, y, r, 0, 2 * Math.PI);ctx.fill();ctx.restore();}
图例的横线
起点在小圆点边缘,终点在 endX 位置,需要注意图例在左侧还是右侧:
drawLegendLine() {const { ctx, x, y, endX } = this;const { r } = this.dot;const lineStart = endX > x ? x + r : x - r; // 图例可以在左侧也可以在右侧,所以线条存在延伸方向const lineEnd = endX;ctx.save();ctx.beginPath();ctx.moveTo(lineStart, y);ctx.lineTo(lineEnd, y);ctx.strokeStyle = '#E6E6E6';ctx.strokeWidth = 0.5;ctx.stroke();ctx.restore();}
图例的图标
图例图标是一个带渐变的圆角矩形,需要注意的是,如果图例在右侧,图标绘制时需要依赖于图例文字的宽度。
/*** @param {number} iconX 图例 x 坐标*/drawLegendIcon(iconX) {const { ctx, x, y } = this;const { w, h, r, startColor, stopColor } = this.icon;const iconY = y - h - Legend.MARGIN_BOTTOM; // 算出图例左上角 y 坐标ctx.save();const lgr = ctx.createLinearGradient(x, iconY, x, iconY + h);lgr.addColorStop(0, startColor);lgr.addColorStop(1, stopColor);ctx.fillStyle = lgr;drawRoundedRect(ctx, iconX, iconY, w, h, r); // 这只是一个画矩形的方法,具体可以看看源码ctx.fill();ctx.restore();}
图例的文字
这里需要提前计算文字的宽度,让图例图标绘制在正确的位置,所以我将文字属性作为一个计算好的量传入函数。
/*** @param {number} textW 文字宽度* @param {number} textH 文字高度* @param {string} text 文字内容*/drawLegendText(textW, textH, text) {const { ctx, x, y, endX } = this;const { w, marginRight } = this.icon;const offsetY = 3; // 用于调整实际渲染与预期的位置偏差ctx.save();ctx.font = '12px Arial';ctx.fillStyle = '#000000';ctx.textBaseline = 'top';const textX = endX > x ? endX - textW : endX + w + marginRight;const textY = y - textH - Legend.MARGIN_BOTTOM + offsetY;ctx.fillText(text, textX, textY);ctx.restore();}
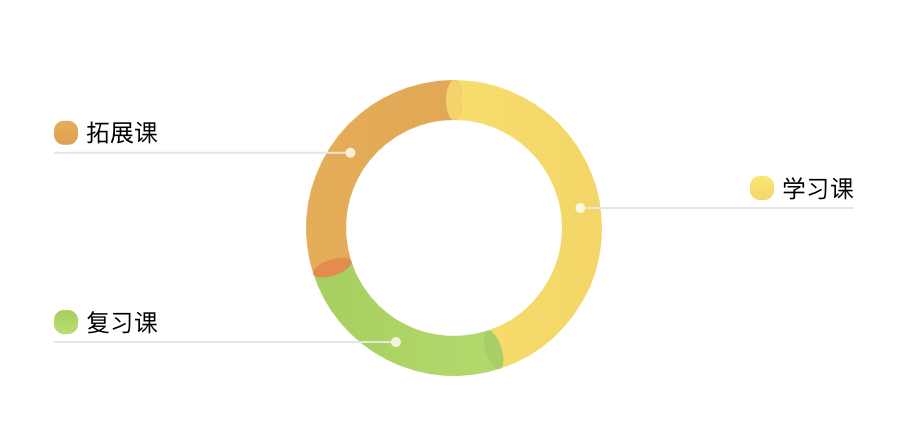
结合起来
计算出 Legend 类需要的参数并传入。
drawPartLegend(part) {const { ctx } = this;const { startPer, per, startColor, stopColor, text } = part;// 计算区域开始角度和结束角度的中间值: middleDeg = 360 * (startPer + (startPer + per)) / 2// 如果第一部分占比超过 50%,让图例显示在右侧正中,即 90 度位置const middleDeg = (startPer === 0 && per > 0.5) ? ANGLE_90 : ANGLE_360 * (startPer * 2 + per) / 2;// 下面是简单的三角函数计算图例在圆环上的起始点const x = ctx.width / 2 + (R1 + R2) / 2 * Math.cos(arcDeg(middleDeg));const y = ctx.height / 2 + (R1 + R2) / 2 * Math.sin(arcDeg(middleDeg));// 限制文字宽度const textMaxWidth = ctx.width / 2 - R2;// 小于 180 说明在右边const endX = middleDeg <= ANGLE_180 ? ctx.width : 0;const legend = new Legend({ ctx, x, y, textMaxWidth, endX, startColor, stopColor, text });legend.draw();}
修改上文使用的 draw 方法:
draw() {const { source } = this;source.forEach((s) => {// ...this.drawPartLegend(s);});}
目前效果如下:
3
canvas的动画实际上是一帧一帧画出来的,所以这里要求我们手动实现帧动画绘制。要让动画变得流畅,我们需要使用requestAnimationFrame。
由于 requestAnimationFrame 的特性是需要递归调用自身,这里封装了一个 RafRunner (具体可看源码):
class RafRunner {// 可传入自定义 requestAnimationFrame 函数constructor(requestAnimationFrame = window.requestAnimationFrame.bind(window)) {this.requestAnimationFrame = requestAnimationFrame;this.timingFunction = (x) => x;}/*** 处理器* @param {Function} handler 处理函数,拥有两个形参** handler = (val, preVal) => void*/handler(handler) {}/*** 启动* @param {number} from 开始值* @param {number} to 结束值* @param {number} duration (millisecond) 持续时间* @param {function} timingFunction 可选,默认 linear*/start(from, to, duration, timingFunction) {}}
让环动起来 这里的扇形从 0 度增长到 360 度的过程,是整体上的动作,所以不同部分扇区增长在整体上是连续的,那么在某一帧或存在同时渲染两个扇区的部分。我们让
per(percent) 进行缓动,判断当前per值属于哪一个扇区,来渲染对应扇区。利用刚刚封装的
RafRunner来修改我们的draw函数:
draw() {const { source } = this;if (source.length === 0) {return;}const raf = new RafRunner();// 记录当前 part 下标let pos = 0;raf.handler((recPer, prePer) => {let recentPart = source[pos];const { startPer, per } = recentPart;// 渲染完某个部分之后,渲染下一个部分if (recPer >= startPer + per) {// 渲染上个部分 -> per 并不会精准的落在每个扇区的结束 percent 上,所以需要补全上个扇区const startDeg = ANGLE_360 * startPer;const endDeg = ANGLE_360 * (startPer + per);this.drawRing(startDeg, endDeg, recentPart.lgr, recentPart.ellipseColor);this.drawPartLegend(recentPart);// 跳到下一个部分pos++;recentPart = source[pos];// 已经没有了if (!recentPart) {// 记得画上起点的椭圆this.drawEllipse(0, source[0].ellipseColor);return;}}// 渲染实时动画帧部分const startDeg = ANGLE_360 * recentPart.startPer; // recentPart 或已重新赋值,不能使用解构出的 startPerconst endDeg = ANGLE_360 * recPer;this.drawRing(startDeg, endDeg, recentPart.lgr, recentPart.ellipseColor);// 第一部分起点椭圆在最上层this.drawEllipse(0, source[0].ellipseColor);});raf.start(0, 1, 800, easeInOut);}
看看效果
让图例也动起来 由于代码结构类似,这里只说两个比较特殊的情况:
/*** @param {number} iconX 图例 x 坐标* @param {number} iconOffsetY 图例 y 偏移,用于适配多行图例标题的情况*/drawLegendIcon(iconX, iconOffsetY) {const { ctx, x, y } = this;const { w, h, r, startColor, stopColor } = this.icon;const iconY = y - h - Legend.MARGIN_BOTTOM + iconOffsetY;const raf = new RafRunner();raf.handler((opacity) => {ctx.save();ctx.globalAlpha = opacity; // 透明度绘制时,要清除上次画的,特别是文字(具体可以自己试一试)ctx.clearRect(iconX, iconY, w, h); // 背景没有着色时,可以清除区域后再画const lgr = ctx.createLinearGradient(x, iconY, x, iconY + h);lgr.addColorStop(0, startColor);lgr.addColorStop(1, stopColor);ctx.fillStyle = lgr;drawRoundedRect(ctx, iconX, iconY, w, h, r);ctx.fill();ctx.restore();});raf.start(0, 1, Legend.ICON_AND_TITLE_DURATION);}drawLegendDot() {const { ctx, x, y } = this;const { r, opacity: endOpacity } = this.dot;const raf = new RafRunner();raf.handler((opacity, oldOpacity) => {ctx.save();// 背景有绘制圆环,所以这里不能直接擦除// 这里只能是在上一次的基础上画,所以计算透明度差值就好,否则透明度叠加之后透明度(0 ~ 1)会比预期更高ctx.globalAlpha = opacity - oldOpacity;ctx.beginPath();ctx.fillStyle = '#FFFFFF';ctx.arc(x, y, r, 0, 2 * Math.PI);ctx.fill();ctx.restore();});raf.start(0, endOpacity, Legend.DOT_AND_LINE_DURATION);}
看看最后的效果

4
文本宽度溢出的时候,或许需要多行省略(可看源码)
每个部分的颜色如何分配
当两个部分占比很小,图例可能会重叠
空间有限,过小占比图例应该省略
...
最后,项目地址:https://github.com/chym123/donut-graph-demo
欢迎点 star 鼓励!

IMWeb 团队隶属腾讯公司,是国内最专业的前端团队之一。
我们专注前端领域多年,负责过 QQ 资料、QQ 注册、QQ 群等亿级业务。目前聚焦于在线教育领域,精心打磨 腾讯课堂、企鹅辅导 及 ABCMouse 三大产品。