
基于Dijkstra算法的武汉地铁路径规划!

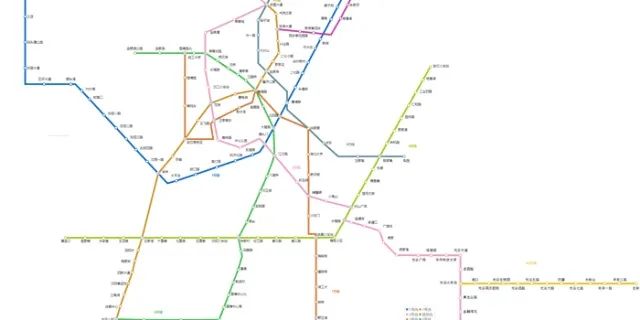
导读:最近爬取了武汉地铁线路的信息,通过调用高德地图的api 获得各个站点的进度和纬度信息,使用Dijkstra算法对路径进行规划。
01 数据爬取
方法:requests、BeautifulSoup、pandas
import requests
from bs4 import BeautifulSoup
import pandas as pd

def spyder():
   #获得武汉的地铁信息
   url='http://wh.bendibao.com/ditie/linemap.shtml'
   user_agent='Mozilla/5.0 (Macintosh; U; Intel Mac OS X 10_6_8; en-us) AppleWebKit/534.50 (KHTML, like Gecko) Version/5.1 Safari/534.50'
   headers = {'User-Agent': user_agent}
   r = requests.get(url, headers=headers)
   r.encoding = r.apparent_encoding
   soup = BeautifulSoup(r.text, 'lxml')
   all_info = soup.find_all('div', class_='line-list')
   df=pd.DataFrame(columns=['name','site'])
   for info in all_info:
       title=info.find_all('div',class_='wrap')[0].get_text().split()[0].replace('线路图','')
       station_all=info.find_all('a',class_='link')
       for station in station_all:
           station_name=station.get_text()
           temp={'name':station_name,'site':title}
           df =df.append(temp,ignore_index=True)
   df.to_excel('./subway.xlsx',index=False)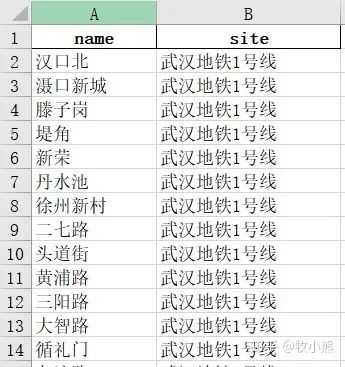
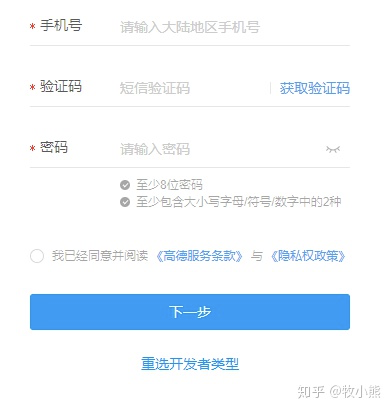
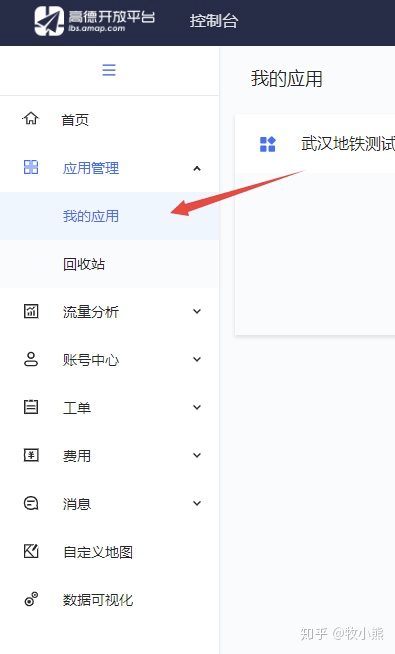
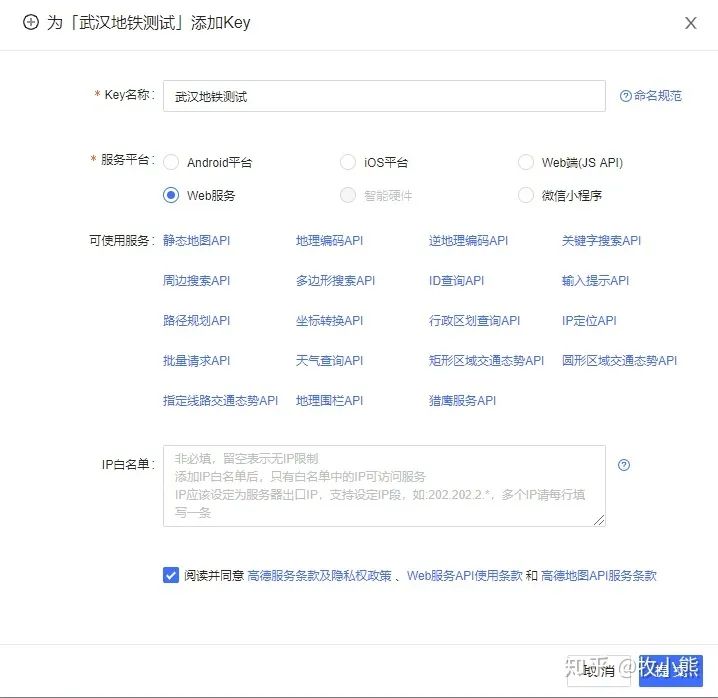
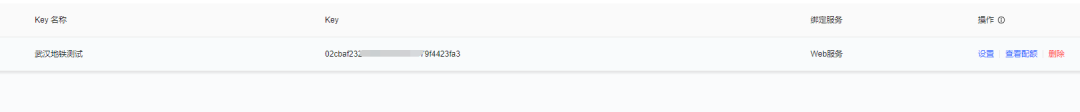
02 高德地图api接口配置


03 得到地铁站的经度和纬度
def get_location(keyword,city):
   #获得经纬度
   user_agent='Mozilla/5.0 (Macintosh; U; Intel Mac OS X 10_6_8; en-us) AppleWebKit/534.50 (KHTML, like Gecko) Version/5.1 Safari/534.50'
   headers = {'User-Agent': user_agent}
   url='http://restapi.amap.com/v3/place/text?key='+keynum+'&keywords='+keyword+'&types=&city='+city+'&children=1&offset=1&page=1&extensions=all'
   data = requests.get(url, headers=headers)
   data.encoding='utf-8'
   data=json.loads(data.text)
   result=data['pois'][0]['location'].split(',')
return result[0],result[1]def spyder():
#获得武汉的地铁信息
print('正在爬取武汉地铁信息...')
url='http://wh.bendibao.com/ditie/linemap.shtml'
user_agent='Opera/9.80 (Macintosh; Intel Mac OS X 10.6.8; U; en) Presto/2.8.131 Version/11.11'
headers = {'User-Agent': user_agent}
r = requests.get(url, headers=headers)
r.encoding = r.apparent_encoding
soup = BeautifulSoup(r.text, 'lxml')
all_info = soup.find_all('div', class_='line-list')
df=pd.DataFrame(columns=['name','site'])
for info in tqdm(all_info):
title=info.find_all('div',class_='wrap')[0].get_text().split()[0].replace('线路图','')
station_all=info.find_all('a',class_='link')
for station in station_all:
station_name=station.get_text()
longitude,latitude=get_location(station_name,'武汉')
temp={'name':station_name,'site':title,'longitude':longitude,'latitude':latitude}
df =df.append(temp,ignore_index=True)
df.to_excel('./subway.xlsx',index=False)04 得到地铁站之间的距离并构建图
from geopy.distance import geodesic
print(geodesic((纬度,经度), (纬度,经度)).m) #计算两个坐标直线距离def compute_distance(longitude1,latitude1,longitude2,latitude2):
#计算2点之间的距离
user_agent='Mozilla/5.0 (Macintosh; U; Intel Mac OS X 10_6_8; en-us) AppleWebKit/534.50 (KHTML, like Gecko) Version/5.1 Safari/534.50'
headers = {'User-Agent': user_agent}
url='http://restapi.amap.com/v3/distance?key='+keynum+'&origins='+str(longitude1)+','+str(latitude1)+'&destination='+str(longitude2)+','+str(latitude2)+'&type=1'
data=requests.get(url,headers=headers)
data.encoding='utf-8'
data=json.loads(data.text)
result=data['results'][0]['distance']
return resultdef get_graph():
print('正在创建pickle文件...')
data=pd.read_excel('./subway.xlsx')
#创建点之间的距离
graph=defaultdict(dict)
for i in range(data.shape[0]):
site1=data.iloc[i]['site']
if i<data.shape[0]-1:
site2=data.iloc[i+1]['site']
#如果是共一条线
if site1==site2:
longitude1,latitude1=data.iloc[i]['longitude'],data.iloc[i]['latitude']
longitude2,latitude2=data.iloc[i+1]['longitude'],data.iloc[i+1]['latitude']
name1=data.iloc[i]['name']
name2=data.iloc[i+1]['name']
distance=compute_distance(longitude1,latitude1,longitude2,latitude2)
graph[name1][name2]=distance
graph[name2][name1]=distance
output=open('graph.pkl','wb')
pickle.dump(graph,output)
05 得到当前位置距离最近的地铁站
longitude1,latitude1=get_location(site1,'武汉')
longitude2,latitude2=get_location(site2,'武汉')
data=pd.read_excel('./subway.xlsx')
def get_nearest_subway(data,longitude1,latitude1):
   #找最近的地铁站
   longitude1=float(longitude1)
   latitude1=float(latitude1)
   distance=float('inf')
   nearest_subway=None
   for i in range(data.shape[0]):
       site1=data.iloc[i]['name']
       longitude=float(data.iloc[i]['longitude'])
       latitude=float(data.iloc[i]['latitude'])
       temp=geodesic((latitude1,longitude1), (latitude,longitude)).m
       if temp<distance:
           distance=temp
           nearest_subway=site1
return nearest_subway06 使用Dijkstra算法对地铁线路进行规划
def subway_line(start,end):
   file=open('graph.pkl','rb')
   graph=pickle.load(file)
   #创建点之间的距离
   #现在我们有了各个地铁站之间的距离存储在graph
   #创建节点的开销表,cost是指从start到该节点的距离
   costs={}
   parents={}
   parents[end]=None
   for node in graph[start].keys():
       costs[node]=float(graph[start][node])
       parents[node]=start
   #终点到起始点距离为无穷大
   costs[end]=float('inf')
   #记录处理过的节点list
   processed=[]
   shortest_path=dijkstra(start,end,graph,costs,processed,parents)
return shortest_path#计算图中从start到end的最短路径
def dijkstra(start,end,graph,costs,processed,parents):
#查询到目前开销最小的节点
node=find_lowest_cost_node(costs,processed)
#使用找到的开销最小节点,计算它的邻居是否可以通过它进行更新
#如果所有的节点都在processed里面 就结束
while node isnotNone:
#获取节点的cost
cost=costs[node] #cost 是从node 到start的距离
#获取节点的邻居
neighbors=graph[node]
#遍历所有的邻居,看是否可以通过它进行更新
for neighbor in neighbors.keys():
#计算邻居到当前节点+当前节点的开销
new_cost=cost+float(neighbors[neighbor])
if neighbor notin costs or new_cost<costs[neighbor]:
costs[neighbor]=new_cost
#经过node到邻居的节点,cost最少
parents[neighbor]=node
#将当前节点标记为已处理
processed.append(node)
#下一步继续找U中最短距离的节点 costs=U,processed=S
node=find_lowest_cost_node(costs,processed)
#循环完成 说明所有节点已经处理完
shortest_path=find_shortest_path(start,end,parents)
shortest_path.reverse()
return shortest_path
#找到开销最小的节点
def find_lowest_cost_node(costs,processed):
#初始化数据
lowest_cost=float('inf') #初始化最小值为无穷大
lowest_cost_node=None
#遍历所有节点
for node in costs:
#如果该节点没有被处理
ifnot node in processed:
#如果当前的节点的开销比已经存在的开销小,那么久更新该节点为最小开销的节点
if costs[node]<lowest_cost:
lowest_cost=costs[node]
lowest_cost_node=node
return lowest_cost_node
#找到最短路径
def find_shortest_path(start,end,parents):
node=end
shortest_path=[end]
#最终的根节点为start
while parents[node] !=start:
shortest_path.append(parents[node])
node=parents[node]
shortest_path.append(start)
return shortest_path07 将所有的函数封装
def main(site1,site2):
   ifnot os.path.exists('./subway.xlsx'):
       spyder()
   ifnot os.path.exists('./graph.pkl'):
       get_graph()
   longitude1,latitude1=get_location(site1,'武汉')
   longitude2,latitude2=get_location(site2,'武汉')
   data=pd.read_excel('./subway.xlsx')
   #求最近的地铁站
   start=get_nearest_subway(data,longitude1,latitude1)
   end=get_nearest_subway(data,longitude2,latitude2)
   shortest_path=subway_line(start,end)
   if site1 !=start:
       shortest_path.insert(0,site1)
   if site2 !=end:
       shortest_path.append(site2)
   print('路线规划为:','-->'.join(shortest_path))

if __name__ == '__main__':
   global keynum
   keynum=''#输入自己的key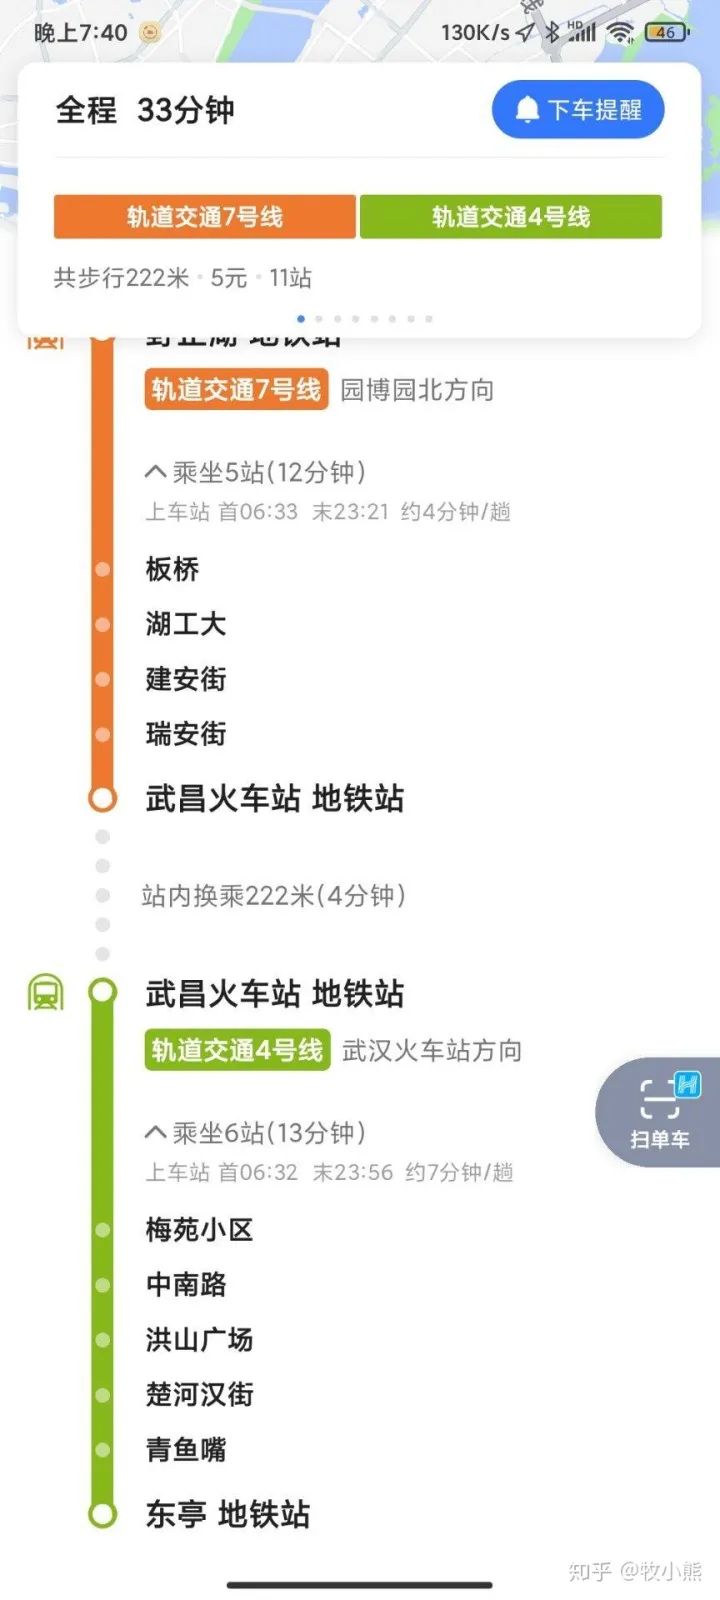
main('华中农业大学','东亭')路线规划为:华中农业大学-->野芷湖-->板桥-->湖工大-->建安街-->瑞安街-->武昌火车站-->梅苑小区-->中南路-->洪山广场-->楚河汉街-->青鱼嘴-->东亭
08 可以继续完善的点
09 项目源码

评论