
高级,这个Python库助力pandas智能可视化分析

导读:介绍一个可视化工具——LUX。
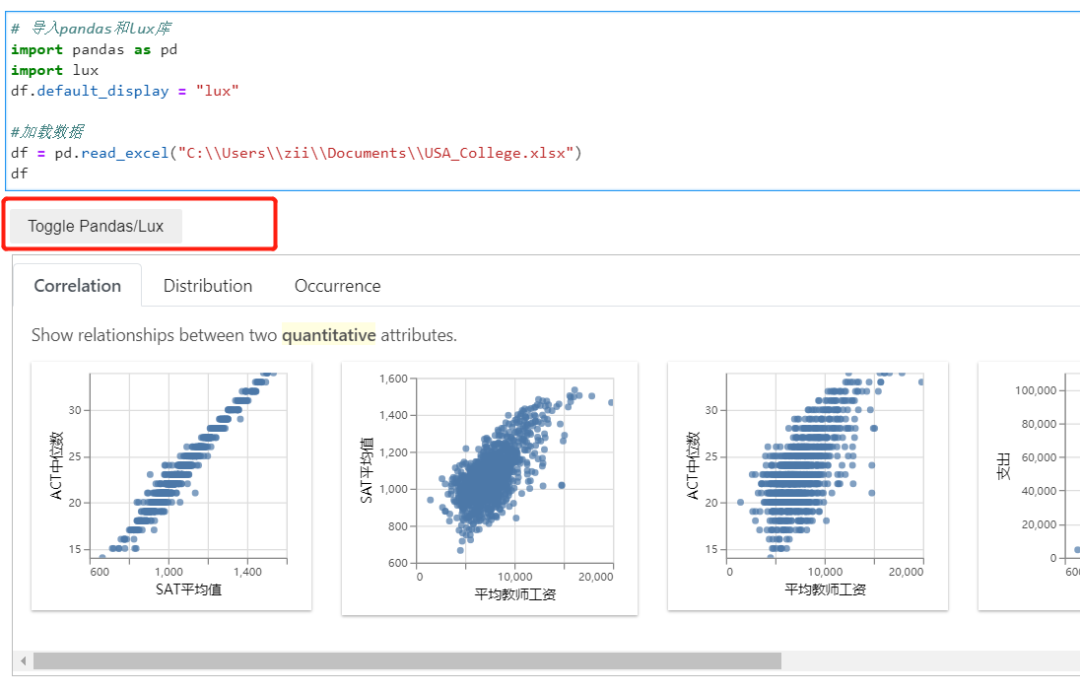
01 使用LUX
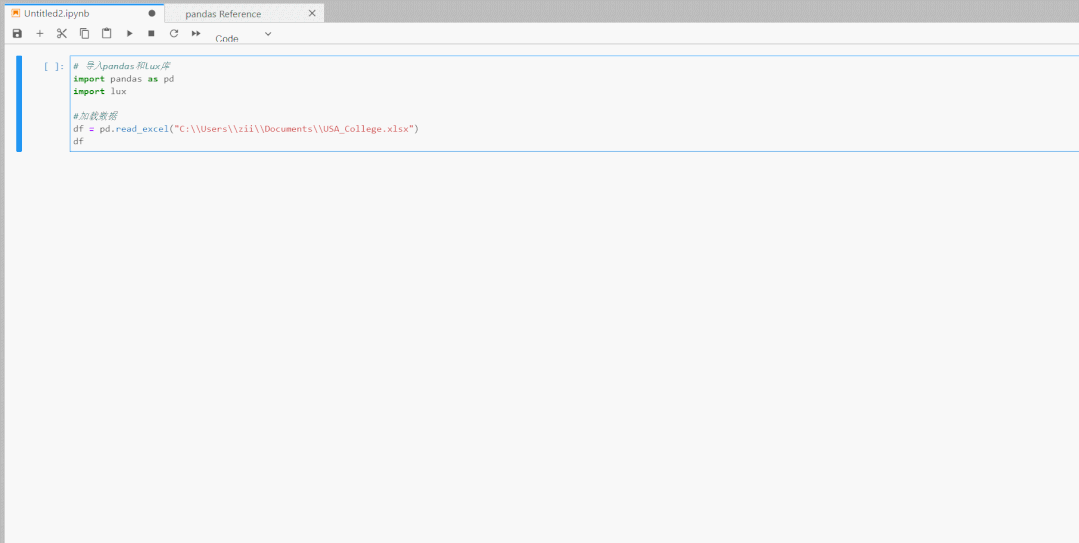
# 导入pandas和lux库
import pandas as pd
import lux
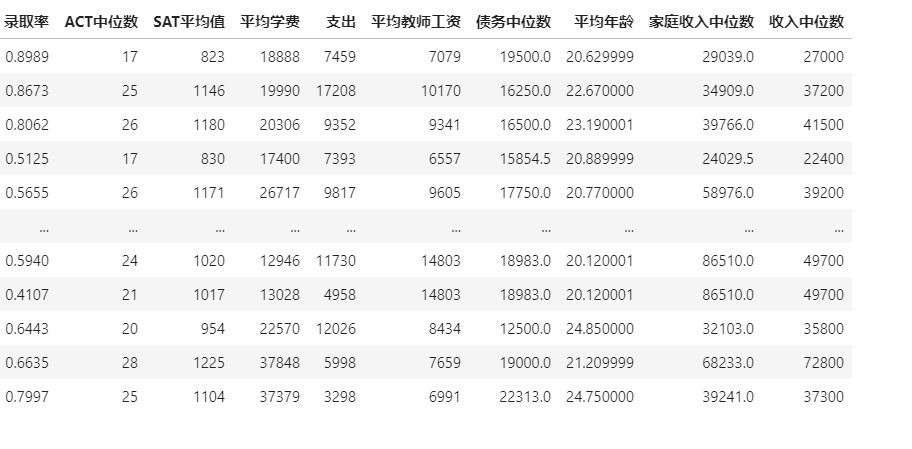
#加载数据
df = pd.read_excel("C:\\Users\\zii\\Documents\\USA_College.xlsx")
df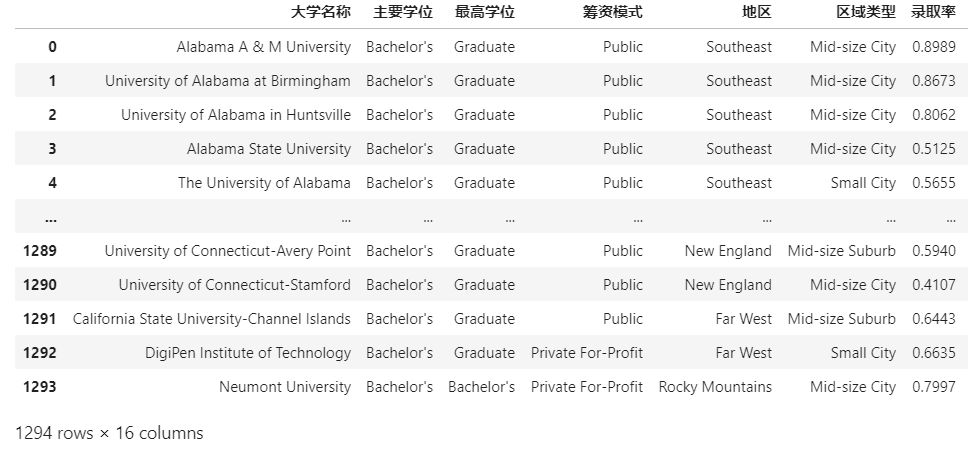
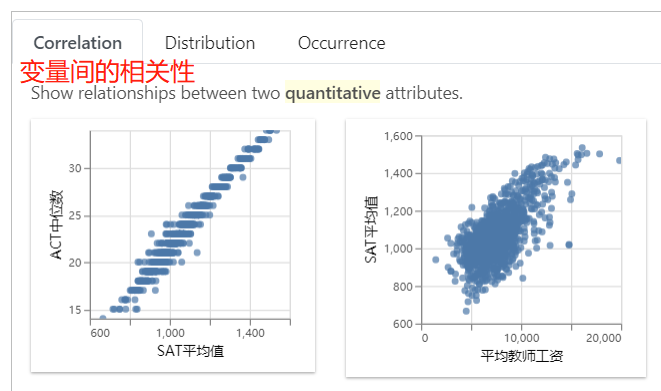
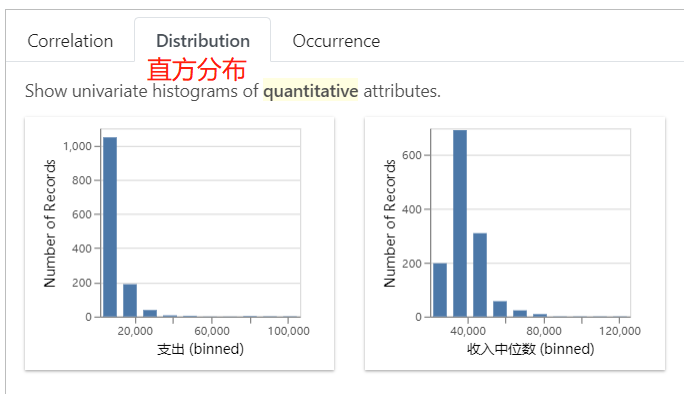
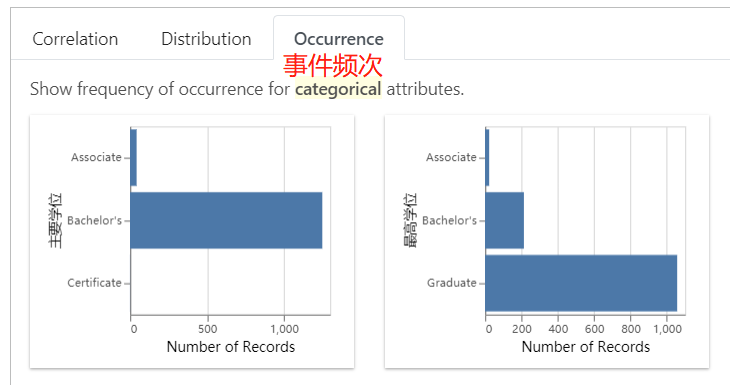
df.intent = ['SAT平均值','收入中位数']
df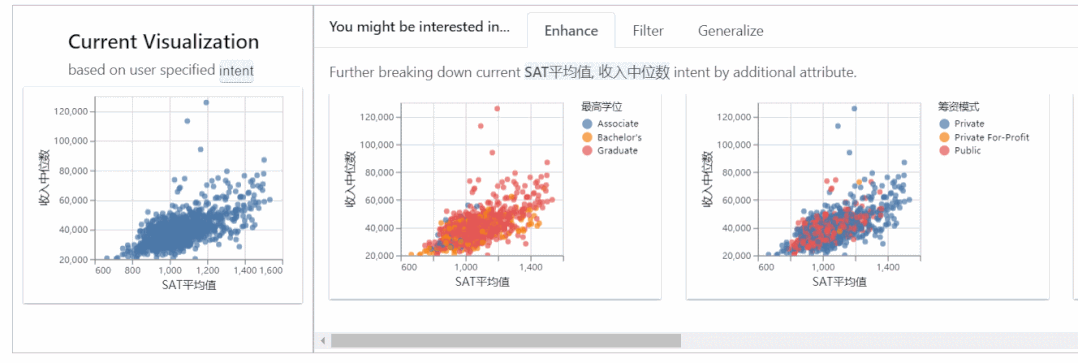
02 导出图表
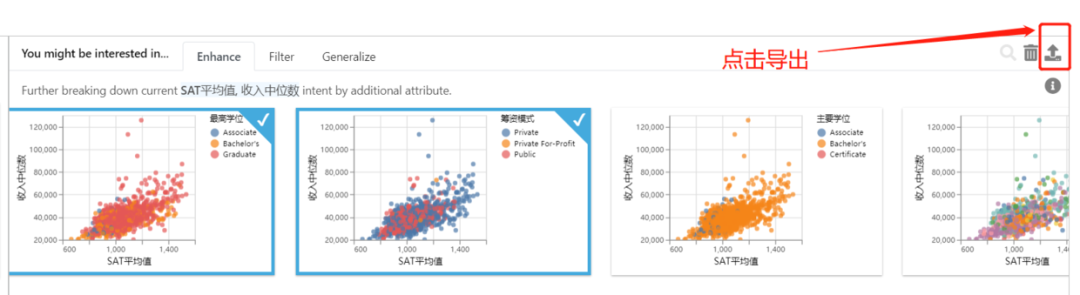
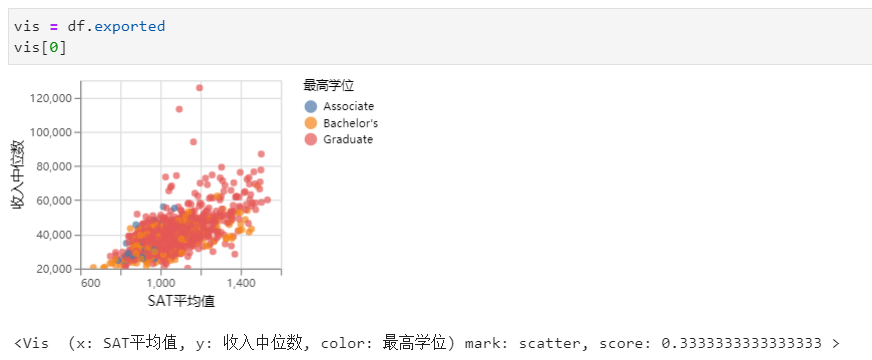
vis = df.exported
print (vis[0].to_matplotlib())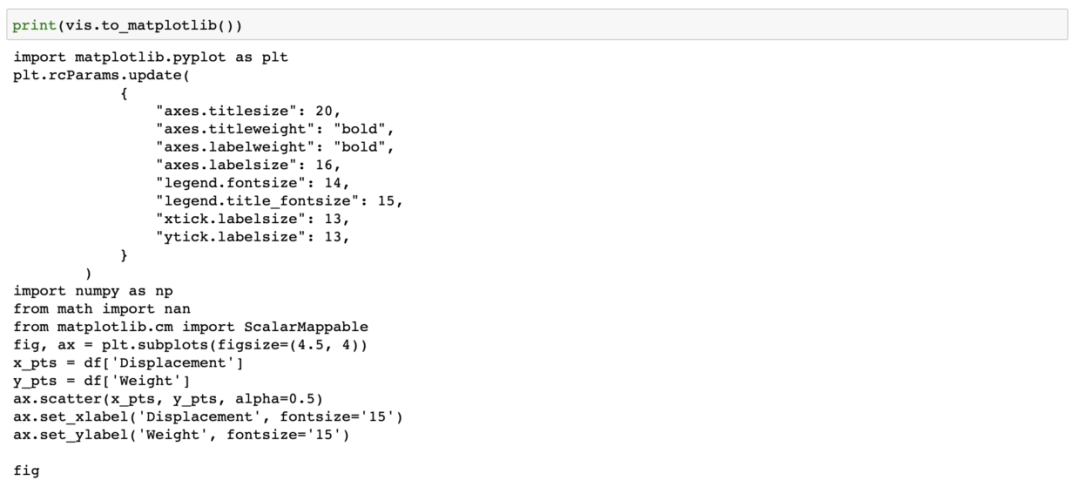
vis = df.exported
print(vis[0].to_Altair())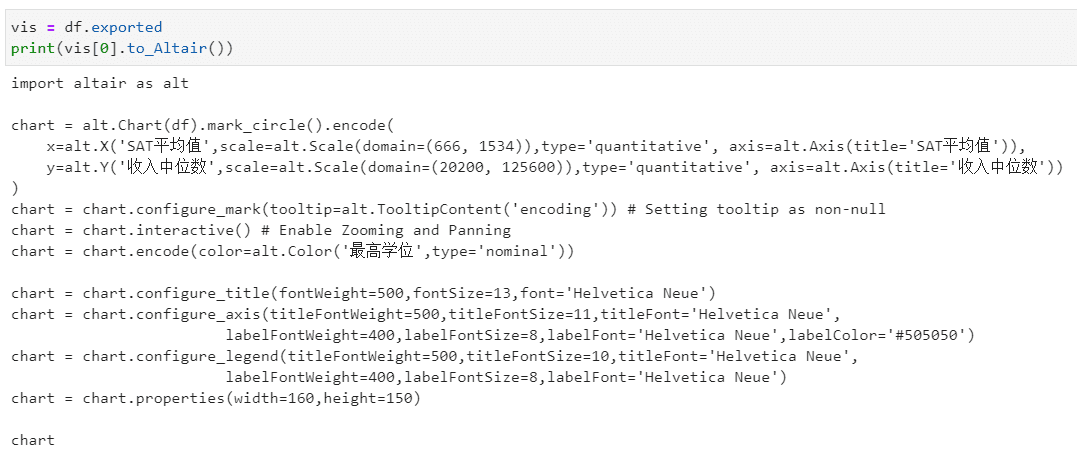
import altair as alt

chart = alt.Chart(df).mark_circle().encode(
    x=alt.X('SAT平均值',scale=alt.Scale(domain=(666, 1534)),type='quantitative', axis=alt.Axis(title='SAT平均值')),
    y=alt.Y('收入中位数',scale=alt.Scale(domain=(20200, 125600)),type='quantitative', axis=alt.Axis(title='收入中位数'))
)
chart = chart.configure_mark(tooltip=alt.TooltipContent('encoding')) # Setting tooltip as non-null
chart = chart.interactive() # Enable Zooming and Panning
chart = chart.encode(color=alt.Color('最高学位',type='nominal'))

chart = chart.configure_title(fontWeight=500,fontSize=13,font='Helvetica Neue')
chart = chart.configure_axis(titleFontWeight=500,titleFontSize=11,titleFont='Helvetica Neue',
labelFontWeight=400,labelFontSize=8,labelFont='Helvetica Neue',labelColor='#505050')
chart = chart.configure_legend(titleFontWeight=500,titleFontSize=10,titleFont='Helvetica Neue',
labelFontWeight=400,labelFontSize=8,labelFont='Helvetica Neue')
chart = chart.properties(width=160,height=150)

chart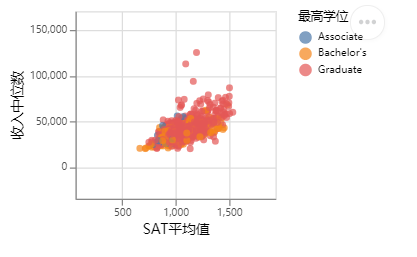
03 安装设置
pip install lux-apiconda install -c conda-forge lux-apijupyter nbextension install --py luxwidget
jupyter nbextension enable --py luxwidgetjupyter labextension install @jupyter-widgets/jupyterlab-manager
jupyter labextension install luxwidget04 总结

评论