
水波图实现原理
(给前端大学加星标,提升前端技能.)
作者:止战之殇
https://juejin.im/post/6844903640537235470
在项目中自己使用 Canvas 实现了一下水波图,在这里给大家分享一下它的实现原理。一开始看到波浪,可能不知道从何入手,我们来看看波浪的特征就会有灵感了。
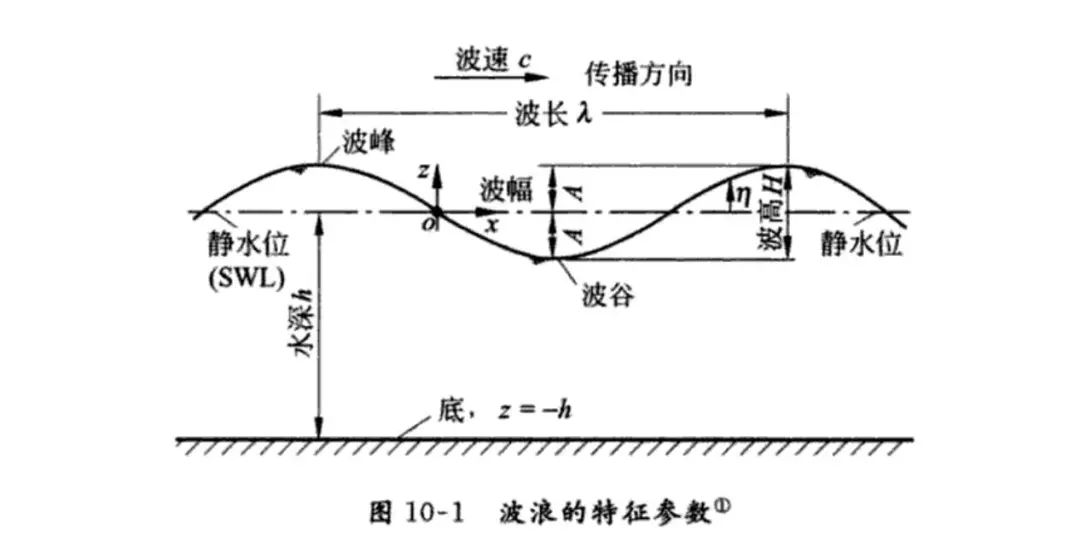
没错,有人肯定会想到,就是 正余弦曲线!对于波陡很小的波动,一般选择正弦或余弦的曲线来表示波形,这是最简单而又最接近实际波形的表述。这里我选择了正弦曲线来实现。
在讲实现思路之前,我们来回忆一下正弦曲线的基础。
正弦曲线
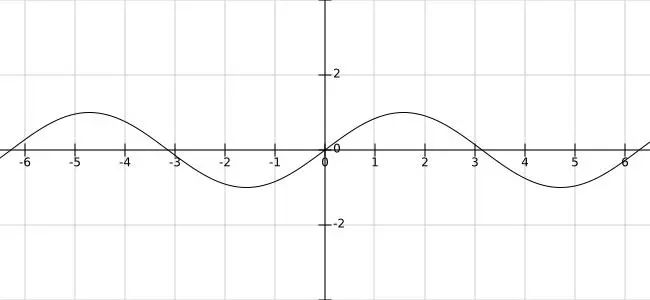
正弦曲线公式:y = A sin(Bx + C) + D
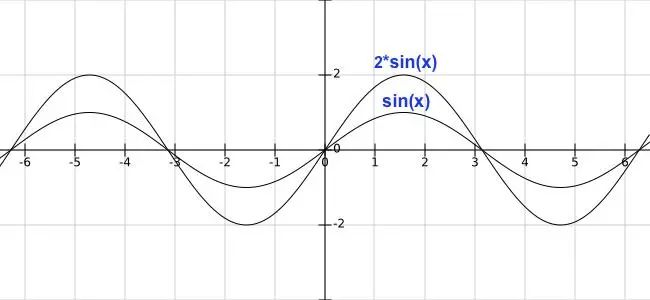
振幅是 A,A 值越大,曲线更陡峭:
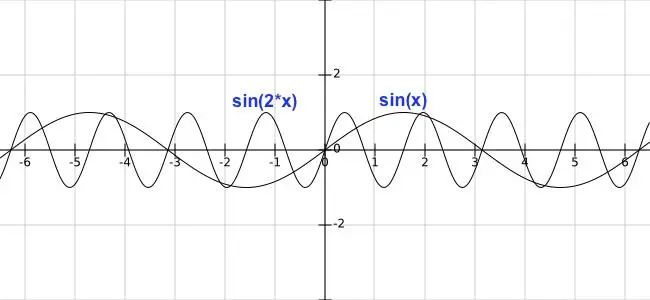
周期是 2π/B,B 值大于 1 时,B 值越大,周期越短,B 值小于 1 大于 0 时,周期变长:
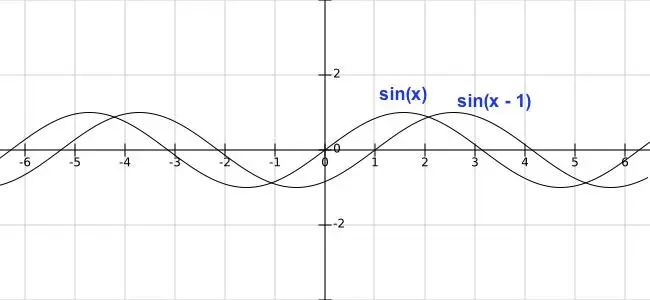
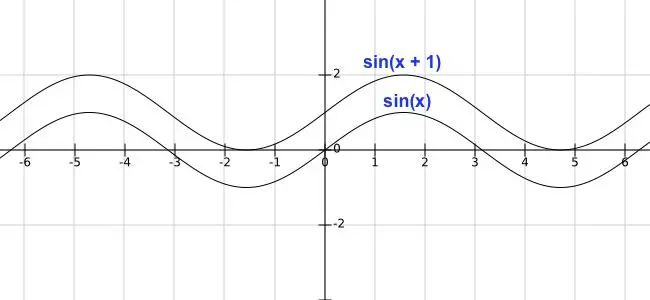
相移是 −C/B,在 B 不变的情况,C 为正值时,曲线向左移动,C 为负值时,曲线向右移动:
垂直位移是 D,控制曲线上下移动:
实现思路
了解了正弦曲线的一些属性,我们可以把这些属性来控制波浪,
振幅:控制波浪的高度
周期:控制波浪的宽度
相移:控制波浪的水平移动
垂直位移:控制水位的高度
动画效果的实现主要是利用相移,通过不断水平移动曲线,产出波浪移动的感觉,然后可以绘制多条曲线,曲线之间通过控制属性(高度、宽度、移动速度),产生视觉差,就会有波浪起伏的感觉了。有了这些思路,我们来慢慢实现。
曲线绘制
初始化,定义 Canvas 的宽高:
componentDidMount() {
const self = this;
const canvas = this.refs.canvas;
canvas.height = 500;
canvas.width = 500;
this.canvas = canvas;
this.canvasWidth = canvas.width;
this.canvasHeight = canvas.height;
const ctx = canvas.getContext('2d');
this.drawSin(ctx);
}
render() {
return (
<div className="content page">
<canvas ref="canvas">canvas>
div>
);
}
根据定义波浪的参数配置,通过公式:y = 波浪高度 * sin(x * 波浪宽度 + 水平位移),来绘制正弦曲线:
drawSin(ctx) {
const points = [];
const canvasWidth = this.canvasWidth;
const canvasHeight = this.canvasHeight;
const startX = 0;
const waveWidth = 0.05; // 波浪宽度,数越小越宽
const waveHeight = 20; // 波浪高度,数越大越高
const xOffset = 0; // 水平位移
ctx.beginPath();
for (let x = startX; x < startX + canvasWidth; x += 20 / canvasWidth) {
const y = waveHeight * Math.sin((startX + x) * waveWidth + xOffset);
points.push([x, (canvasHeight / 2) + y]);
ctx.lineTo(x, (canvasHeight / 2) + y);
}
ctx.lineTo(canvasWidth, canvasHeight);
ctx.lineTo(startX, canvasHeight);
ctx.lineTo(points[0][0], points[0][1]);
ctx.stroke();
}
曲线绘制完,这时曲线是静态的,如何让它动起来?前面思路提到,可以通过不断改变水平偏移(xOffset),让曲线水平移动,即可产生动态的效果。
componentDidMount() {
...
this.xOffset = 0; // 初始偏移
this.speed = 0.1; // 偏移速度
requestAnimationFrame(this.draw.bind(this, canvas));
}
draw() {
const canvas = this.canvas;
const ctx = canvas.getContext('2d');
ctx.clearRect(0, 0, canvas.width, canvas.height);
// 曲线绘制
this.drawSin(ctx, this.xOffset);
this.xOffset += this.speed;
requestAnimationFrame(this.draw.bind(this));
}
drawSin(ctx, xOffset = 0) {
...
}
球型绘制
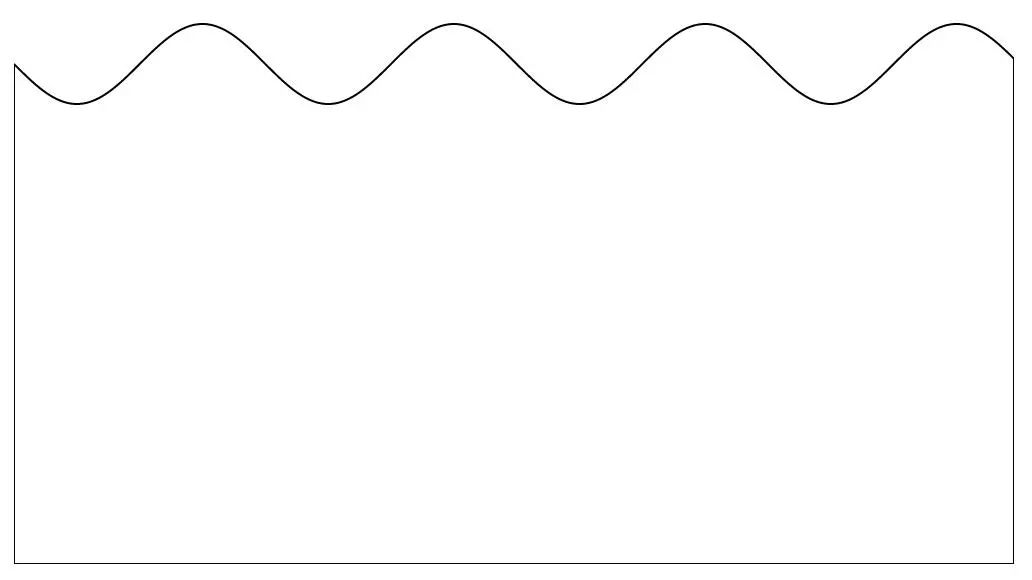
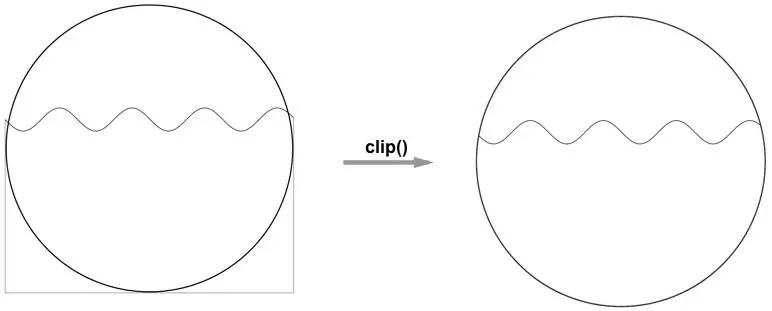
现在我们雏形已经出来了,曲线和动态效果已经实现,上面可以看成是水装在一个长方体上,如果让水装在一个球体上?
这里我们用到了 Canvas 的 clip() 方法来定义剪切区域,定义了剪切区域后,浏览器会将所有的绘图操作都限制在本区域内执行,所以我们可以先画一个圆,定义后面绘制的区域只能在这个圆的区域内,超出部分就不显示,这样就能形成浪在一个球体中的效果了。
draw() {
...
if (!this.isDrawCircle) {
this.drawCircle(ctx);
}
this.drawSin(ctx, this.xOffset);
this.xOffset += this.speed;
requestAnimationFrame(this.draw.bind(this));
}
drawCircle(ctx) {
const r = this.canvasWidth / 2;
const lineWidth = 5;
const cR = r - (lineWidth);
ctx.lineWidth = lineWidth;
ctx.beginPath();
ctx.arc(r, r, cR, 0, 2 * Math.PI);
ctx.stroke();
ctx.clip();
this.isDrawCircle = true;
}
水位控制
是不是有点感觉了,目前还差一点,就是控制水位,也就是映射到数据的百分比。前面如果有留意的话,会发现 正弦曲线 y 坐标的计算,最后会加上 canvasHeight / 2 ,其实这里就是设置水位了。
我们来看看:y = A sin(Bx + C) + D,曲线的高度有 A 和 D 决定,A 控制波浪的高度,实际水位还是由 D 来控制。
水位的高度,在可视化上含义就是数据的百分比,假设目前的百分比80%,水位的高度就 canvasHeight * 0.8,映射到坐标系统 y 的坐标就是 canvasHeight * (1 - 0.8)。(坐标原点在左上角)。在动画效果上除了正弦曲线的水平移动,我们加上水位上升的动效:
componentDidMount() {
...
this.xOffset = 0;
this.speed = 0.1;
// 水位数值
this.rangeValue = 0.6;
// 初始水位
this.nowRange = 0;
requestAnimationFrame(this.draw.bind(this, canvas));
}
draw() {
...
this.drawSin(ctx, this.xOffset, this.nowRange);
this.xOffset += this.speed;
if (this.nowRange < this.rangeValue) {
this.nowRange += 0.01;
}
requestAnimationFrame(this.draw.bind(this));
}
drawCircle(ctx) {
...
}
drawSin(ctx, xOffset = 0, nowRange = 0) {
...
for (let x = startX; x < startX + canvasWidth; x += 20 / canvasWidth) {
const y = waveHeight * Math.sin((startX + x) * waveWidth + xOffset);
points.push([x, (1 - nowRange) * canvasHeight + y]);
ctx.lineTo(x, (1 - nowRange) * canvasHeight + y);
}
...
}
最终效果
最后我们加上颜色,再加多一条正弦曲线,就会有波浪起伏的感觉了。
在上面球型绘制的时候,我们用到剪切区域的方法来实现,有些人肯定会想到,这时我不用圆去裁切,而是用其他形状,就可以创造出水在各种容器的效果了。

源代码:https://github.com/beyondxgb/wave-demo
❤️爱心三连击
点分享 点点赞 点在看


