Python+Matplotlib+LaTeX玩转数学公式
本文介绍如何在Matplotlib中使用LaTeX 公式和符号、Python如何生成LaTeX数学公式。
1、Matplotlib中使用LaTeX 公式和符号
一些配置
安装两个软件,链接给出。
https://mirrors.cqu.edu.cn/CTAN/systems/windows/protext/protext-3.2-033020.zip https://github.com/ArtifexSoftware/ghostpdl-downloads/releases/download/gs9531/gs9531w64.exe
添加到环境变量中
以下两句放到环境变量中。C:\Users\xx\AppData\Local\Programs\MiKTeX 2.9\miktex\bin\x64;C:\Program Files\gs\gs9.53.1\bin;
matplotlib.rcParams修改
import numpy as np
import matplotlib as mpl
import matplotlib.pyplot as plt

plt.style.use('fivethirtyeight')
mpl.rcParams['text.usetex'] = True#默认为false,此处设置为TRUE
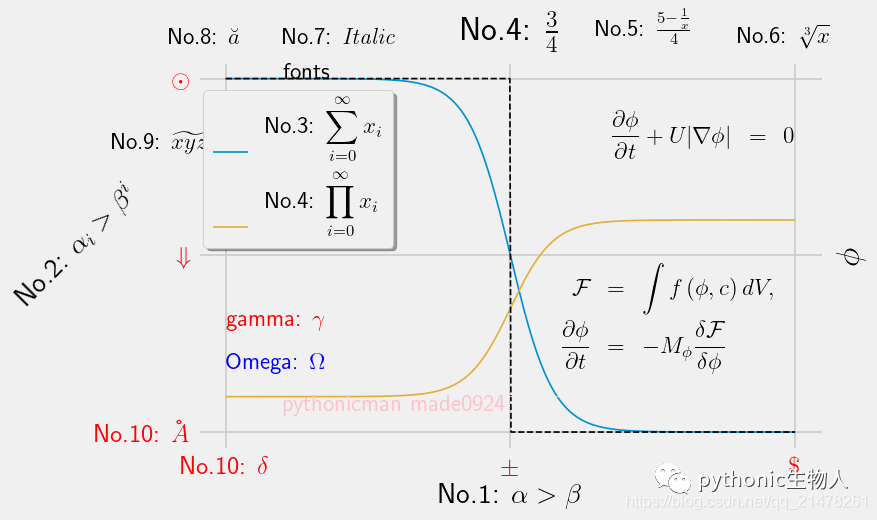
Matplotlib中使用Latex字符和公式
mpl.rcParams['lines.linewidth'] = 1


fig, ax = plt.subplots(dpi=120)

N = 500
delta = 0.6
X = np.linspace(-1, 1, N)
ax.plot(X, (1 - np.tanh(4 * X / delta)) / 2,
        X, (1.4 + np.tanh(4 * X / delta)) / 4, "C2",
        X, X < 0, "k--")


ax.set_xlabel(r'No.1: $\alpha > \beta)

#上下标,上标^,下标
ax.set_ylabel(r'No.2: $\alpha_i > \beta^i,rotation=45)


# #累加、累积
ax.legend((r'No.3: $\displaystyle\sum_{i=0}^\infty x_i, r'No.4: $\displaystyle\prod_{i=0}^\infty x_i),
          shadow=True, loc=(0.01, 0.52), handlelength=1.5, )

#分数
ax.set_title(r'No.4: $\frac{3}{4})

#二项式
ax.text(0.3,1.1,r'No.5: $\frac{5 - \frac{1}{x}}{4})


#开根号
ax.text(0.8,1.1,r'No.6: $\sqrt[3]{x})


#修改字体
## Roman、Italic、Typewriter、CALLIGRAPHY等
ax.text(-0.8,1.1,r'No.7: $\mathit{Italic})
ax.text(-0.8,1.0,r'$\mathsf{fonts})

#声调
ax.text(-1.2,1.1,r'No.8: $\breve a)

#选个范围
ax.text(-1.4,0.8,r'No.9: $\widetilde{xyz})

# the arrow
ax.annotate("", xy=(-delta / 2., 0.1), xytext=(delta / 2., 0.1),
            arrowprops=dict(arrowstyle="<->", connectionstyle="arc3"))


#  其它TeX symbols
ax.set_xticks([-1, 0, 1])
ax.set_xticklabels([r"No.10: $\delta$", r"$\pm$", r"$\$"], color="r", size=15)

ax.set_yticks([0, 0.5, 1])
ax.set_yticklabels([r"No.10: $\AA$", r"$\Downarrow$", "$\\odot$"], color="r", size=15)

ax.text(1.02, 0.5, r"$\phi$",fontsize=20, rotation=90,
        horizontalalignment="left", verticalalignment="center",
        clip_on=False, transform=ax.transAxes)


# 积分、微分公式
eq1 = (r"\begin{eqnarray*}"
       r"\frac{\partial \phi}{\partial t} + U|\nabla \phi| &=& 0 "
       r"\end{eqnarray*}")
ax.text(1, 0.9, eq1,horizontalalignment="right", verticalalignment="top")


eq2 = (r"\begin{eqnarray*}"
       r"\mathcal{F} &=& \int f\left( \phi, c \right) dV, \\ "
       r"\frac{ \partial \phi } { \partial t } &=& -M_{ \phi } "
       r"\frac{ \delta \mathcal{F} } { \delta \phi }"
       r"\end{eqnarray*}")
ax.text(0.18, 0.18, eq2)

ax.text(-1, .30, r"gamma: $\gamma$", color="r")
ax.text(-1, .18, r"Omega: $\Omega$", color="b")

plt.show()
2、latexify生成LaTeX 数学公式
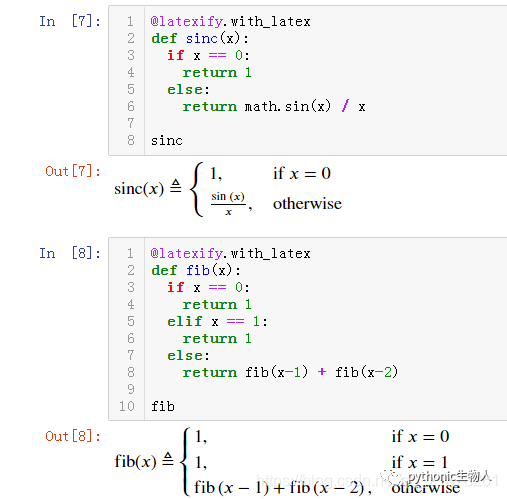
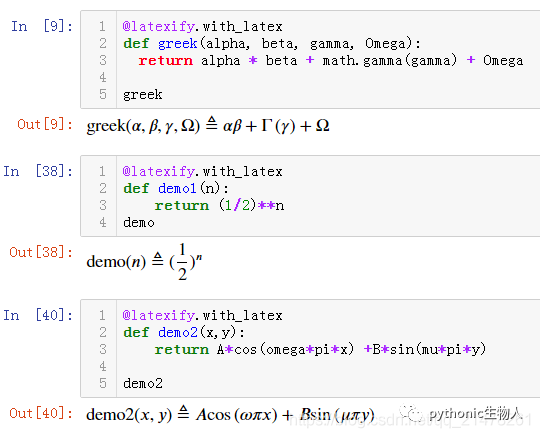
import math
import latexify
@latexify.with_latex#调用latexify的装饰器
def solve(a, b, c):
  return (-b + math.sqrt(b**2 - 4*a*c)) / (2*a)

solve

3、handcalcs生成LaTeX 数学公式
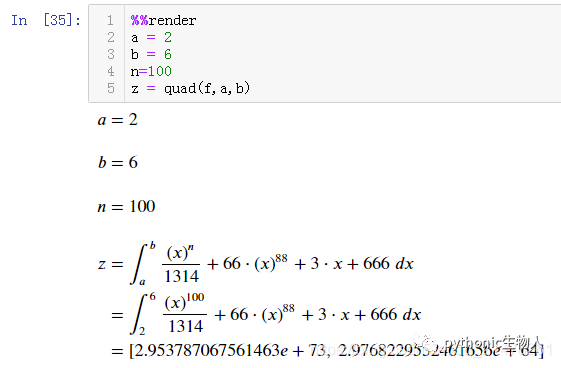
一个求积分公式,借助scipy的quad
import handcalcs.render
from scipy.integrate import quad#借助scipy.quad实现积分
%%render
a = 2
b = 6
n=100
z = quad(f,a,b)
一个混合公式,借助math模块,
from math import sqrt,cos,sin,tan,asin
import handcalcs.render
%%render
#symbolic
f = a-c**2 / b + sqrt(cos(sin(b- 2 / c))) + tan(a/b) - asin(a/c) #Comment part

4、Latex symbols对照表
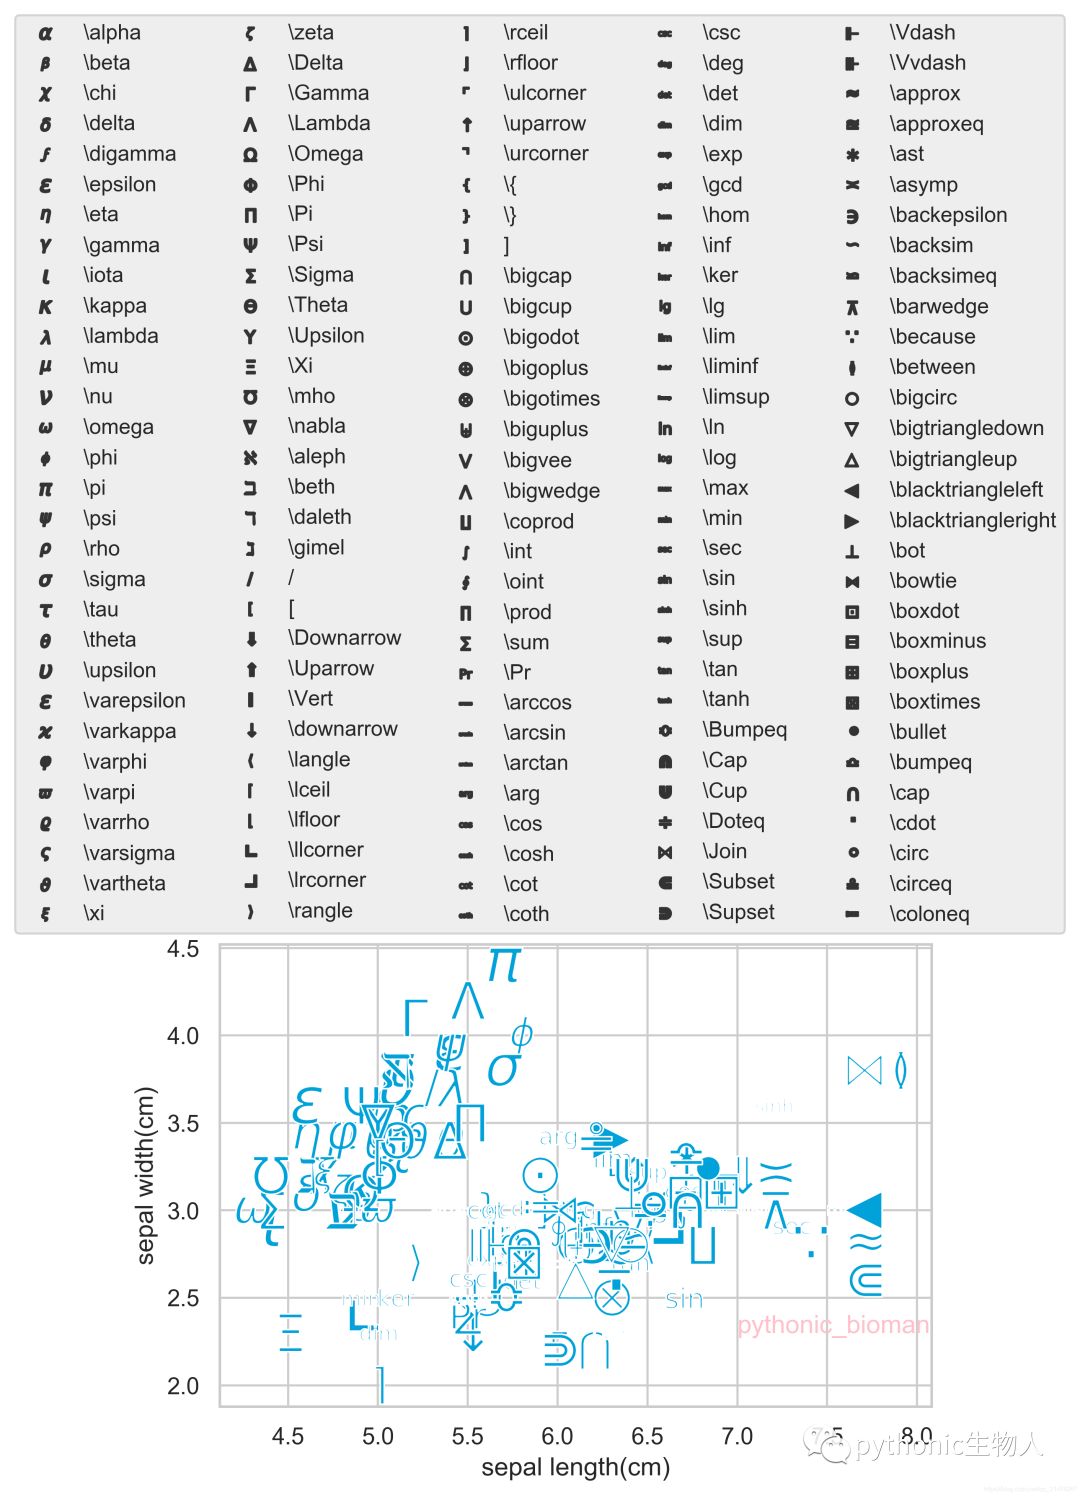
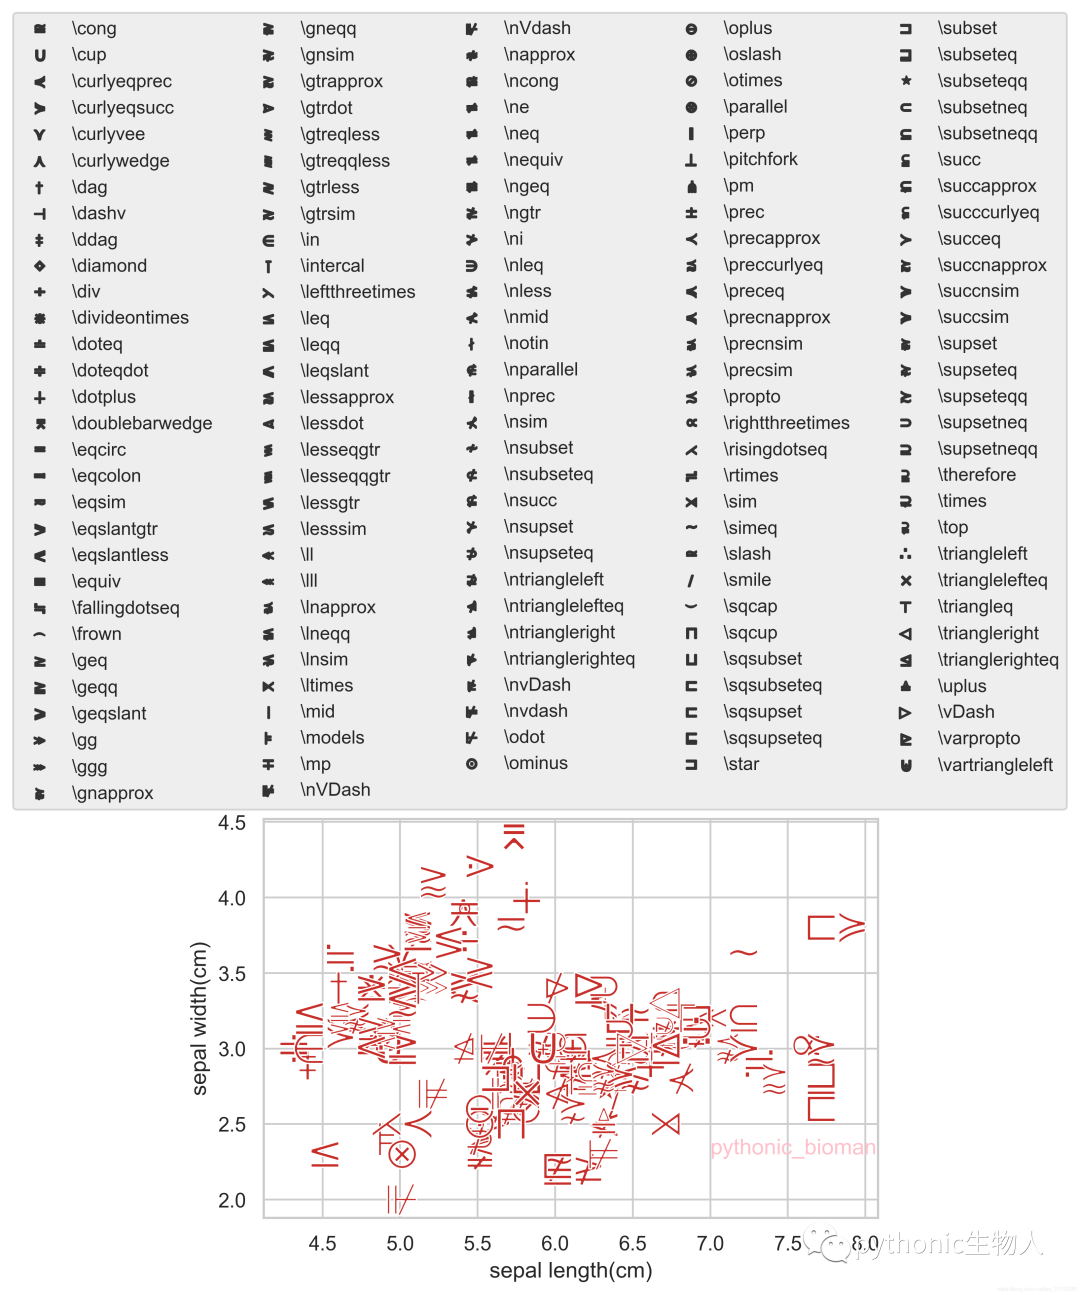
symbols爬取自网站:https://matplotlib.org/tutorials/text/mathtext.html、制作速查表。
plt.figure(dpi=400)
fig = sns.scatterplot(x='sepal length(cm)',y='sepal width(cm)',data=pd_iris,
            style=geek[:150],#添加不同类变量按照不同marker显示
            markers=[r"$"+geek[i]+"$" for i in range(150)],#自定义marker形状
            **dict(s=320),
            color='#01a2d9'

           )

fig.legend(ncol=5,
           fontsize=10,
           loc=8,
           bbox_to_anchor=(0.45, 1),
           facecolor='#eaeaea',
          )

sns.set(style="whitegrid",font_scale=1)

参考资料
https://matplotlib.org/tutorials/text/usetex.html
https://github.com/connorferster/handcalcs
https://github.com/google/latexify_py
END
各位伙伴们好,詹帅本帅搭建了一个个人博客和小程序,汇集各种干货和资源,也方便大家阅读,感兴趣的小伙伴请移步小程序体验一下哦!(欢迎提建议)
推荐阅读
评论
