快来试试 Spring Boot 应用可视化监控,一目了然!
点击上方蓝色“肉眼品世界”,选择“设为星标”
深度价值体系传递

作者:你照亮了我的世界
blog.csdn.net/weixin_44196699/article/details/105010045
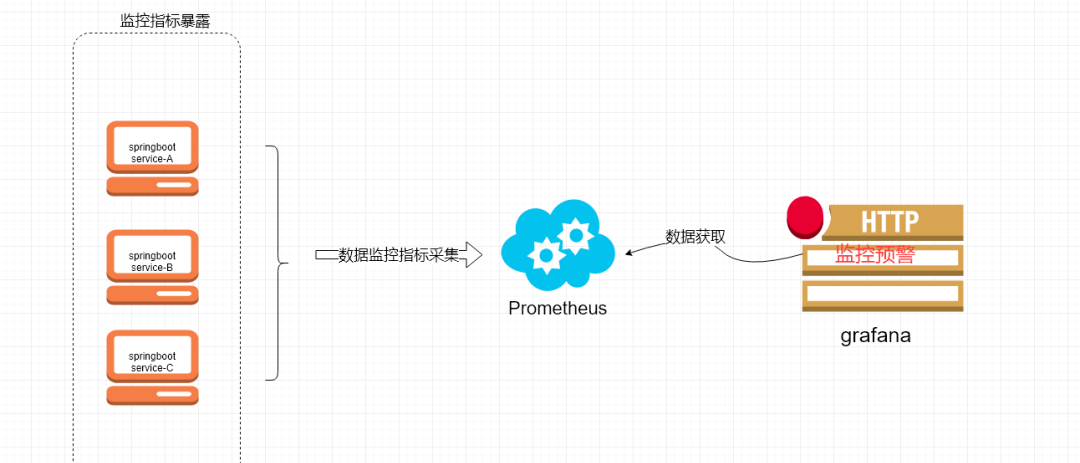
1、Spring Boot 应用暴露监控指标【版本 1.5.7.RELEASE】
首先,添加依赖如下依赖:
<dependency>
<groupId>org.springframework.boot</groupId>
<artifactId>spring-boot-starter-actuator</artifactId>
</dependency>采集应用的指标信息,我们使用的是prometheus,相应的我们引入包:
<dependency>
<groupId>io.prometheus</groupId>
<artifactId>simpleclient_spring_boot</artifactId> <version>0.0.26</version>
</dependency>然后,在启动类
Application.java添加如下注解:@SpringBootApplication
@EnablePrometheusEndpoint
@EnableSpringBootMetricsCollector
public class Application {
public static void main(String[] args) { SpringApplication.run(Application.class, args);
}
}最后,配置默认的登录账号和密码,在
application.yml中:security:
user:
name:user
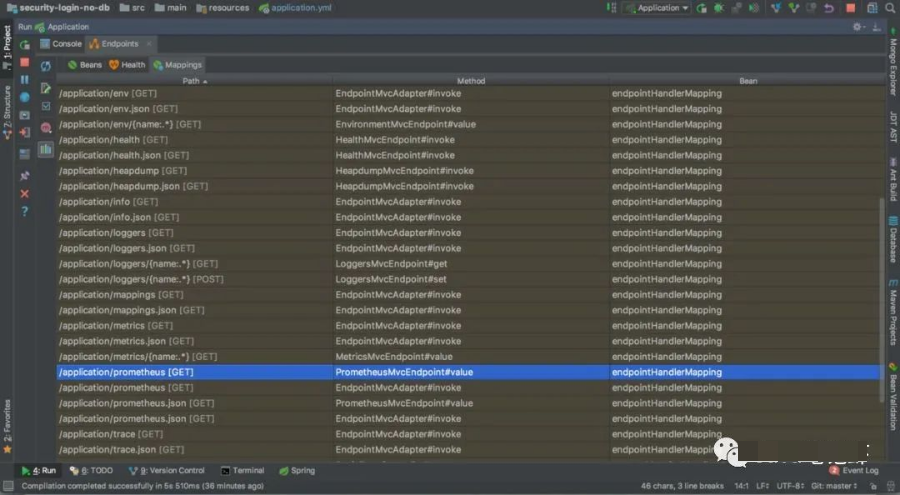
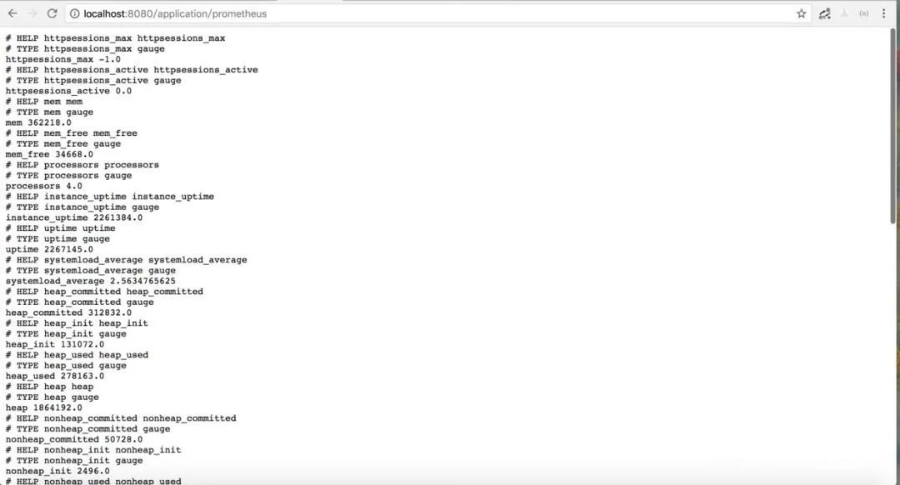
password: pwd启动应用程序后,会看到如下一系列的
Mappingsimg 利用账号密码访问 http://localhost:8080/application/prometheus ,可以看到 Prometheus 格式的指标数据
2、Prometheus 采集 Spring Boot 指标数据
首先,获取 Prometheus 的 Docker 镜像:
$ docker pull prom/prometheus然后,编写配置文件
prometheus.yml:global:
scrape_interval: 10s
scrape_timeout: 10s
evaluation_interval: 10m
scrape_configs:
- job_name: spring-boot
scrape_interval: 5s
scrape_timeout: 5s
metrics_path: /application/prometheus
scheme: http
basic_auth:
username: admin
password: 123456
static_configs:
- targets:
- 192.168.11.54:8099 #此处填写 Spring Boot 应用的 IP + 端口号接着,启动 Prometheus :
docker run -d --name prometheus -p 9090:9090
-v D:\test\actuator\prometheus\prometheus.yml:/etc/prometheus/prometheus.yml prom/prometheus请注意,
D:\test\actuator\prometheus\prometheus.yml,是我的配置文件存放地址,我们需要将它放到容器里面去,所以用了-v来做文件映射。/etc/prometheus/prometheus.yml这个是容器启动的时候去取的默认配置,这里我是直接覆盖掉了它。prom/prometheus这是镜像,如果本地没有,就回去你设置好的镜像仓库去取。启动完成后用**
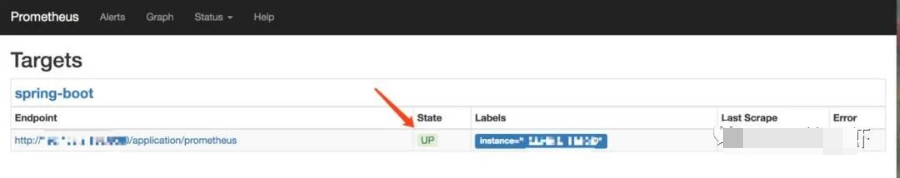
docker ps**看下是否已经启动成功,之后打开浏览器输入:http://localhost:9090/targets,检查 Spring Boot 采集状态是否正常,如果看到下图就是成功了。img 3、Grafana 可视化监控数据
首先,获取 Grafana 的 Docker 镜像:
$ docker pull grafana/grafana1然后,启动 Grafana:
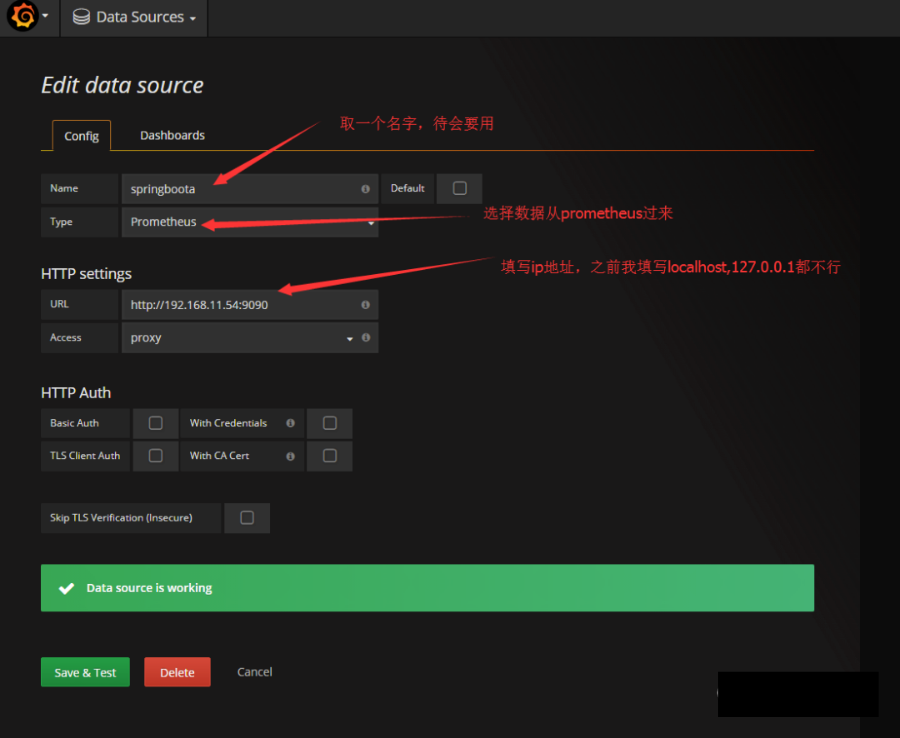
$ docker run --name grafana -d -p 3000:3000 grafana/grafana1接着,访问 http://localhost:3000/ 配置 Prometheus 数据源:
Grafana 登录账号 admin 密码 admin
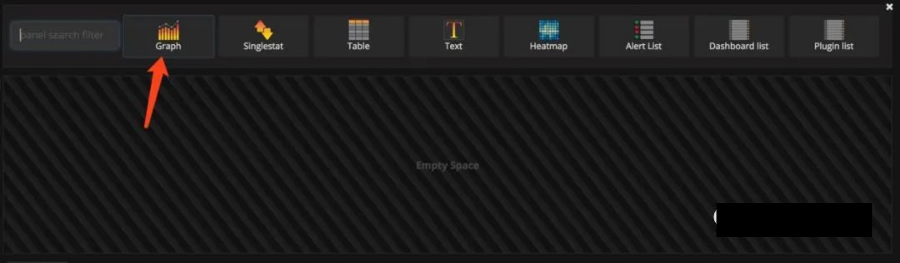
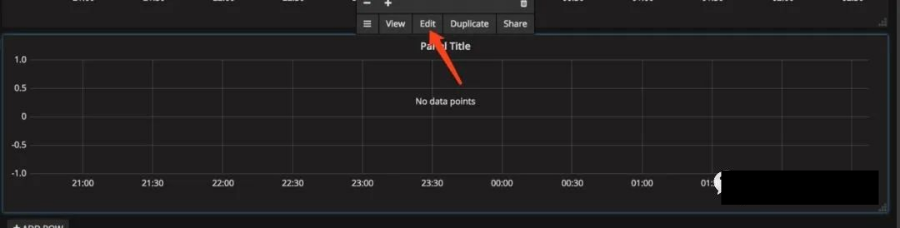
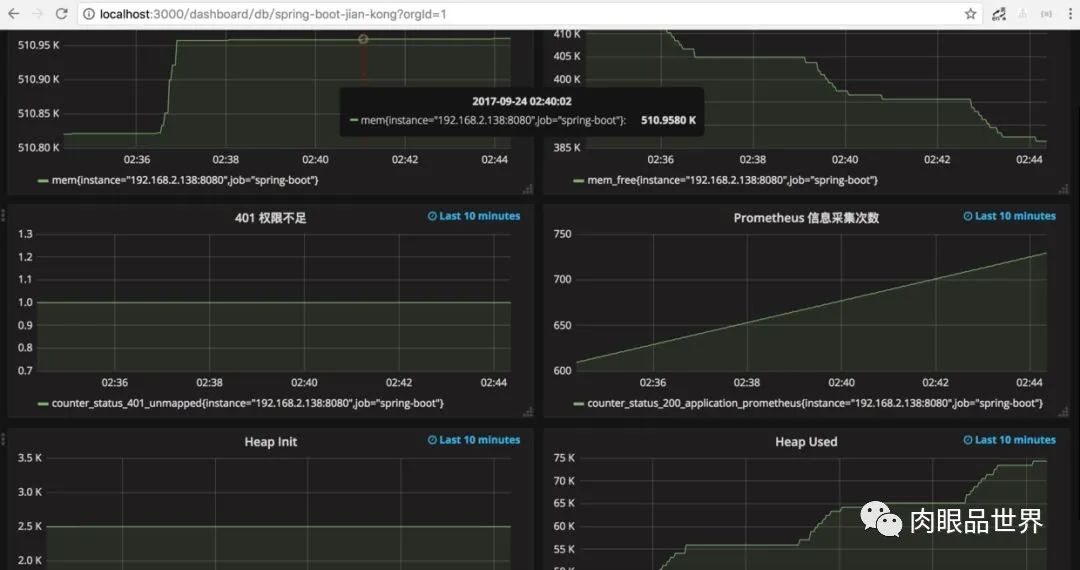
先配置数据源. img 2.配置单个指标的可视化监控面板:
img img img
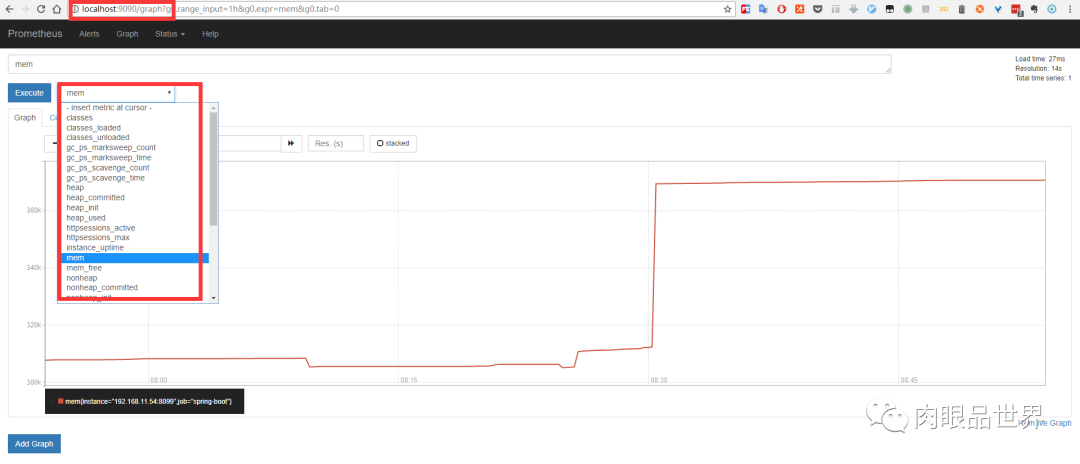
prometh采集的数据img img
推荐阅读: