【Seaborn绘图】深度强化学习实验中的paper绘图方法
点击上方“程序员大白”,选择“星标”公众号
重磅干货,第一时间送达
强化学习实验中的绘图技巧-使用seaborn绘制paper中的图片,使用seaborn绘制折线图时参数数据可以传递ndarray或者pandas,不同的源数据对应的其他参数也略有不同.
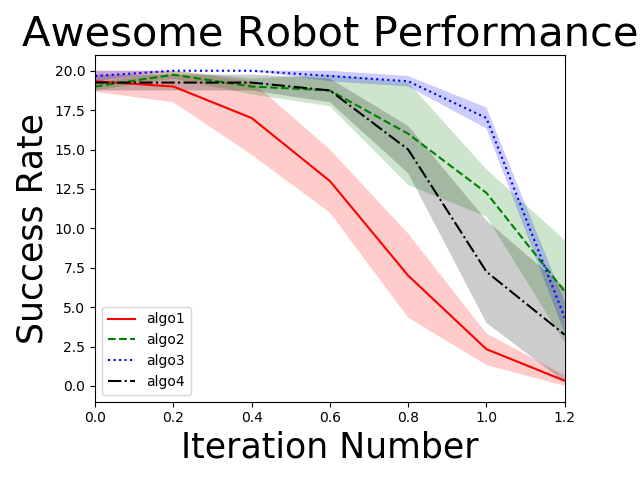
def getdata():basecond = [[18, 20, 19, 18, 13, 4, 1],[],[]]cond1 = [[18, 19, 18, 19, 20, 15, 14],[],[],[]]cond2 = [[20, 20, 20, 20, 19, 17, 4],[],[]]cond3 = [[20, 20, 20, 20, 19, 17, 12],[],[],[]]return basecond, cond1, cond2, cond3
数据维度都为(3,7)或(4, 7)
第一个维度表示每个时间点采样不同数目的数据(可认为是每个x对应多个不同y值) 第二个维度表示不同的时间点(可认为是x轴对应的x值)
data = getdata()fig = plt.figure()xdata = np.array([0, 1, 2, 3, 4, 5, 6])/5linestyle = ['-', '--', ':', '-.']color = ['r', 'g', 'b', 'k']label = ['algo1', 'algo2', 'algo3', 'algo4']for i in range(4):sns.tsplot(time=xdata, data=data[i], color=color[i], linestyle=linestyle[i], condition=label[i])
sns.tsplot 用来画时间序列图
time参数表示对应的时间轴(ndarray),即x轴,data即要求绘制的数据,上述例子为(3, 7)或(4, 7),color为每条线的颜色,linestyle为每条线的样式,condition为每条线的标记.
plt.ylabel("Success Rate", fontsize=25)plt.xlabel("Iteration Number", fontsize=25)plt.title("Awesome Robot Performance", fontsize=30)plt.show()
1.2 绘图建议
你的程序代码需要使用一个额外的文件记录结果,例如csv或pkl文件,而不是直接产生最终的绘图结果.这种方式下,你能运行程序代码一次,然后以不同的方式去绘制结果,记录超出您认为严格必要的内容可能是一个好主意,因为您永远不知道哪些信息对于了解发生的事情最有用.注意文件的大小,但通常最好记录以下内容:每次迭代的平均reward或loss,一些采样的轨迹,有用的辅助指标(如贝尔曼误差和梯度)
你需要有一个单独的脚本去加载一个或多个记录文件来绘制图像,如果你使用不同的超参数或随机种子运行算法多次,一起加载所有的数据(也许来自不同的文件)并画在一起是个好主意,使用自动生成的图例和颜色模式使分辨不同的方法变得容易.
深度强化学习方法,往往在不同的运行中有巨大的变化,因此使用不同的随机种子运行多次是一个好主意,在绘制多次运行的结果时,在一张图上绘制不同运行次的结果,通过使用不同粗细和颜色的线来分辨.在绘制不同的方法时,你将发现将他们总结为均值和方差图是容易的,然而分布并不总是遵循正态曲线,所以至少在初始时有明显的感觉对比不同随机种子的性能.
1.3 实验绘图流程
下面以模仿学习的基础实验为例
means = []stds = []#使用不同的随机种子表示运行多次实验for seed in range(SEED_NUM):tf.set_random_seed(seed*10)np.random.seed(seed*10)mean = []std = []#构建神经网络模型model = tf.keras.Sequential()model.add(layers.Dense(64, activation="relu"))model.add(layers.Dense(64, activation="relu"))model.add(layers.Dense(act_dim, activation="tanh"))model.compile(optimizer=tf.train.AdamOptimizer(0.0001), loss="mse", metrics=['mae'])#迭代次数for iter in range(ITERATION):print("iter:", iter)#训练模型model.fit(train, label, batch_size=BATCH_SIZE, epochs=EPOCHS)#测试,通过与环境交互n次而成,即n趟轨迹roll_reward = []for roll in range(NUM_ROLLOUTS):s = env.reset()done = Falsereward = 0step = 0#以下循环表示一趟轨迹while not done:a = model.predict(s[np.newaxis, :])s, r, done, _ = env.step(a)reward += rstep += 1if step >= max_steps:break#记录每一趟的总回报值roll_reward.append(reward)#n趟回报的平均值和方差作为这次迭代的结果记录mean.append(np.mean(roll_reward))std.append(np.std(roll_reward))#记录每一次实验,矩阵的一行表示一次实验每次迭代结果means.append(mean)stds.append(std)
d = {"mean": means, "std": stds}
with open(os.path.join("test_data", "behavior_cloning_" + ENV_NAME+".pkl"), "wb") as f:
    pickle.dump(d, f, pickle.HIGHEST_PROTOCOL)
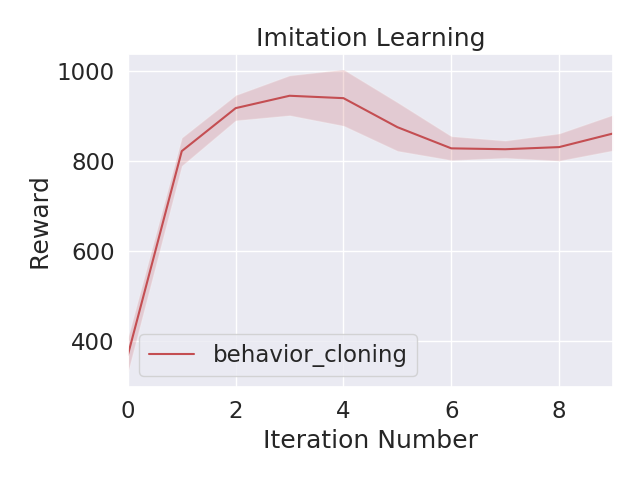
绘图的程序代码比较简单
file = "behavior_cloning_" + ENV_NAME+".pkl"
    with open(os.path.join("test_data", file), "rb") as f:
        data = pickle.load(f)

    x1 = data["mean"]

    file = "dagger_" + ENV_NAME+".pkl"
    with open(os.path.join("test_data", file), "rb") as f:
        data = pickle.load(f)

    x2 = data["mean"]

    time = range(10)

    sns.set(style="darkgrid", font_scale=1.5)
    sns.tsplot(time=time, data=x1, color="r", condition="behavior_cloning")
    sns.tsplot(time=time, data=x2, color="b", condition="dagger")

    plt.ylabel("Reward")
    plt.xlabel("Iteration Number")
    plt.title("Imitation Learning")

    plt.show()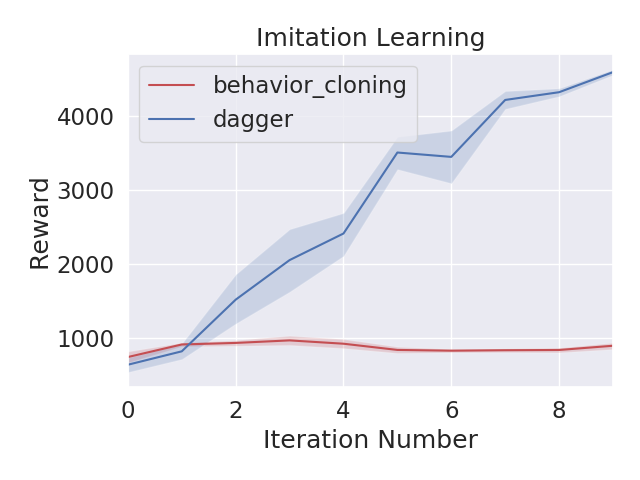
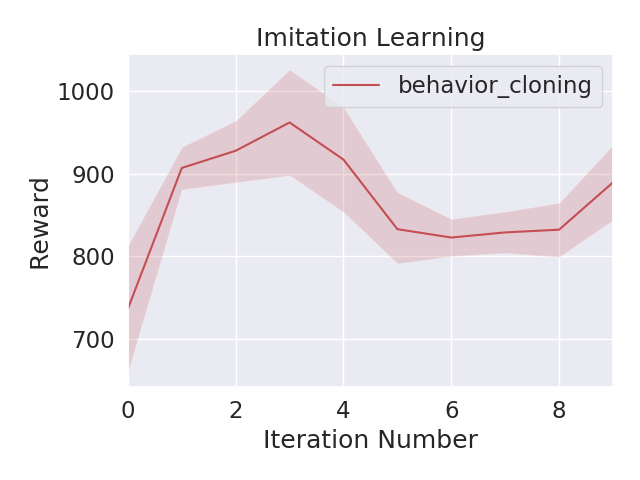
有时我们需要对曲线进行平滑
def smooth(data, sm=1):
    if sm > 1:
        smooth_data = []
        for d in data:
            y = np.ones(sm)*1.0/sm
            d = np.convolve(y, d, "same")

            smooth_data.append(d)

    return smooth_data
sm表示滑动窗口大小,为2*k+1,
smoothed_y[t] = average(y[t-k], y[t-k+1], ..., y[t+k-1], y[t+k])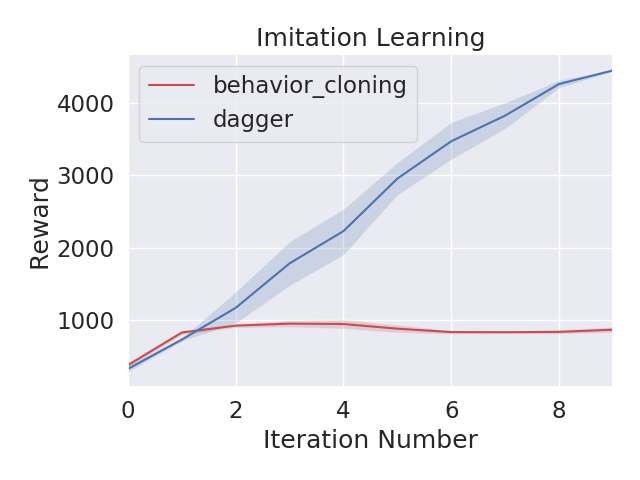
2.pandas
sns.tsplot可以使用pandas源数据作为数据输入,当使用pandas作为数据时,time,value,condition,unit选项将为pandas数据的列名.
其中time选项给出使用该列Series作为x轴数据,value选项表示使用该Series作为y轴数据,用unit来分辨这些数据是哪一次采样(每个x对应多个y),用condition选项表示这些数据来自哪一条曲线.
在openai 的spinning up中,将每次迭代的数据保存到了txt文件中,类似如下:
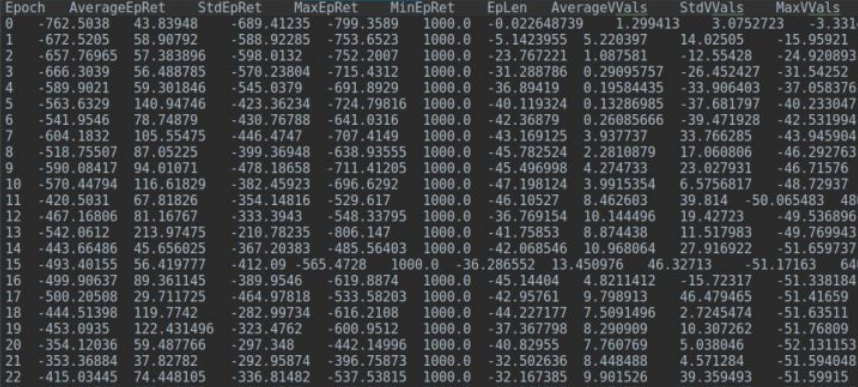
可以使用pd.read_table读取这个以"\t"分割的文件形成pandas
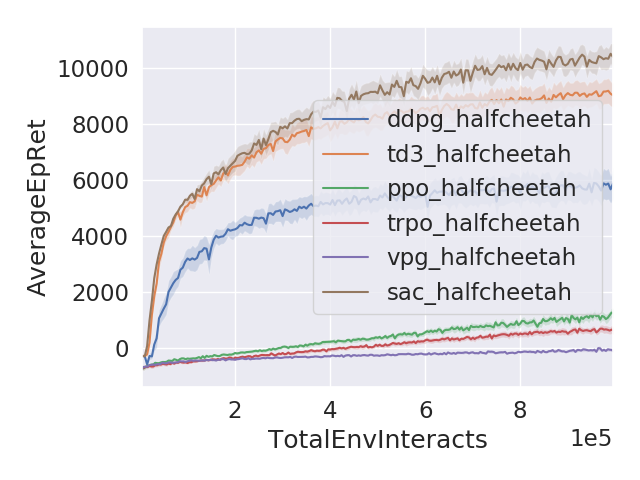
algo = ["ddpg_" + ENV, "td3_" + ENV, "ppo_" + ENV, "trpo_" + ENV, "vpg_" + ENV, "sac_" + ENV]
    data = []
    for i in range(len(algo)):
        for seed in range(SEED_NUM):
            file = os.path.join(os.path.join(algo[i], algo[i] + "_s" + str(seed*10)), "progress.txt")

            pd_data = pd.read_table(file)
            pd_data.insert(len(pd_data.columns), "Unit", seed)
            pd_data.insert(len(pd_data.columns), "Condition", algo[i])

            data.append(pd_data)

    data = pd.concat(data, ignore_index=True)

    sns.set(style="darkgrid", font_scale=1.5)
    sns.tsplot(data=data, time="TotalEnvInteracts", value="AverageEpRet", condition="Condition", unit="Unit")

    #数据大时使用科学计数法
    xscale = np.max(data["TotalEnvInteracts"]) > 5e3
    if xscale:
        plt.ticklabel_format(style='sci', axis='x', scilimits=(0, 0))

    plt.legend(loc='best').set_draggable(True)
    plt.tight_layout(pad=0.5)
    plt.show()
程序参考了spinning up 的代码逻辑github.com/openai/spinn
绘制效果如下:
完整代码:https://github.com/feidieufo/homework/tree/master/hw1
推荐阅读
关于程序员大白
程序员大白是一群哈工大,东北大学,西湖大学和上海交通大学的硕士博士运营维护的号,大家乐于分享高质量文章,喜欢总结知识,欢迎关注[程序员大白],大家一起学习进步!

