
.NET Core + K8S + Loki 玩转日志聚合
共 9232字,需浏览 19分钟
·
2020-07-28 16:38
1. Intro
最近在了解日志聚合系统,正好前几天看到一篇文章《用了日志系统新贵Loki,ELK突然不香了!》,所以就决定动手体验一下。本文就带大家快速了解下Loki,并简单介绍.NET Core如何集成Loki。
2. What's Loki Stack
Grafana Loki like Prometheus, but for logs。其是一个水平可扩展,高可用性,多租户的日志聚合系统,基于Apatch 2.0开源。其有三部分组成:
Loki 是主服务器,负责存储日志和处理查询。对标ELK中的ElasticSearch。 Promtail 是代理,负责收集日志并将其发送给loki。对标ELK中的Logstash。 Grafana提供用户界面。对标ELK中的Kibana。 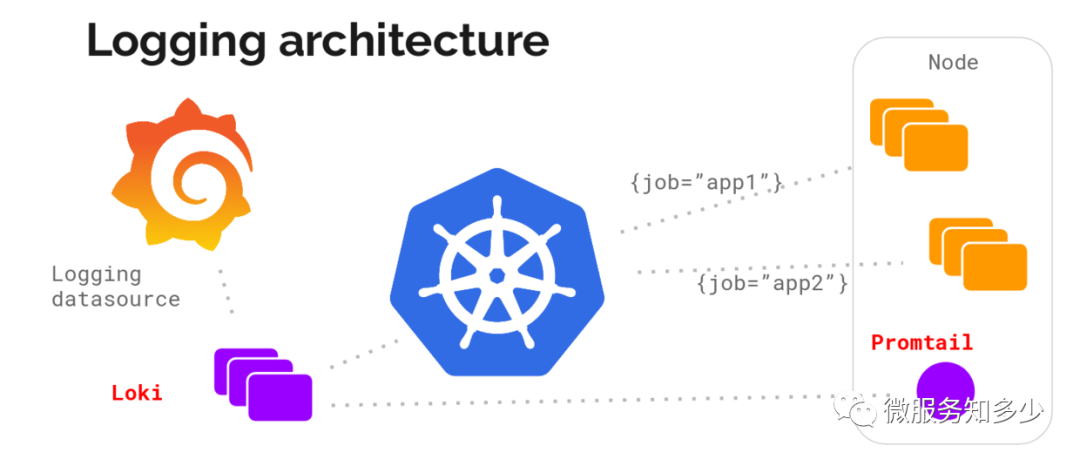
3. Why Use Loki
日志聚合系统的目的是为了方便我们进行日志跟踪和故障排查,尤其在云原生的环境之下。目前主流的日志聚合系统,当数ELK、EFK和Loki。Loki相较于ELK Stack有以下优势:
Elasticsearch中的数据作为非结构化JSON对象存储在磁盘上,Loki以二进制的形式存储。
Elasticsearch采用全文索引,倒排索引的切分和共享的成本较高。Loki仅索引元数据,比如标签。
和Prometheus无缝集成。
4. How Use Loki
首先我们先来基于Heml安装Loki到本地K8S集群。
1. 添加Loki Chart 仓库:
PS C:\Users\Shengjie> helm repo add loki https://grafana.github.io/loki/charts"loki" has been added to your repositoriesPS C:\Users\Shengjie> helm repo updateHang tight while we grab the latest from your chart repositories......Successfully got an update from the "stable" chart repository...Successfully got an update from the "loki" chart repositoryUpdate Complete. ⎈ Happy Helming!⎈
2. 安装Loki Stack
PS C:\Users\Shengjie> helm search hub loki-stackURL CHART VERSION APP VERSION DESCRIPTIONhttps://hub.helm.sh/charts/loki/loki-stack 0.38.3 v1.5.0 Loki: like Prometheus, but for logs.PS C:\Users\Shengjie> helm show values loki/loki-stackloki:enabled: truepromtail:enabled: truefluent-bit:enabled: falsegrafana:enabled: falsesidecar:datasources:enabled: trueimage:tag: 6.7.0prometheus:enabled: falsefilebeat:enabled: falsefilebeatConfig:filebeat.yml: |# logging.level: debugfilebeat.inputs:- type: containerpaths:- /var/log/containers/*.logprocessors:- add_kubernetes_metadata:host: ${NODE_NAME}matchers:- logs_path:logs_path: "/var/log/containers/"output.logstash:hosts: ["logstash-loki:5044"]logstash:enabled: falseimage:repository: grafana/logstash-output-lokitag: 1.0.1filters:main: |-filter {if [kubernetes] {mutate {add_field => {"container_name" => "%{[kubernetes][container][name]}""namespace" => "%{[kubernetes][namespace]}""pod" => "%{[kubernetes][pod][name]}"}replace => { "host" => "%{[kubernetes][node][name]}"}}}mutate {remove_field => ["tags"]}}outputs:main: |-output {loki {url => "http://loki:3100/loki/api/v1/push"#username => "test"#password => "test"}# stdout { codec => rubydebug }}
从上面的Values中,可以看出,可以自定义启用fluent-bit、grafana、filebeat、prometheus、logstash组件。这里我们仅启用grafana日志界面。
PS C:\Users\Shengjie> helm install loki-stack loki/loki-stack --set grafana.enabled=truecoalesce.go:165: warning: skipped value for filters: Not a table.coalesce.go:165: warning: skipped value for filters: Not a table.NAME: loki-stackLAST DEPLOYED: Sun Jul 26 11:58:11 2020NAMESPACE: defaultSTATUS: deployedREVISION: 1NOTES:The Loki stack has been deployed to your cluster. Loki can now be added as a datasource in Grafana.See http://docs.grafana.org/features/datasources/loki/ for more detail.
3. 登录Grafana
首先确认Loki是否成功部署:
PS C:\Users\Shengjie> helm listNAME NAMESPACE REVISION UPDATED STATUS CHART APP VERSIONloki-stack default 1 2020-07-26 11:58:11.022896 +0800 CST deployed loki-stack-0.38.3 v1.5.0PS C:\Users\Shengjie> kubectl get pod -wNAME READY STATUS RESTARTS AGEloki-stack-0 1/1 Running 0 2m33sloki-stack-grafana-c447cfbd-z6tbg 1/1 Running 0 2m33sloki-stack-promtail-j47hl 1/1 Running 0 2m33sPS C:\Users\Shengjie> kubectl get svc -wNAME TYPE CLUSTER-IP EXTERNAL-IP PORT(S) AGEkubernetes ClusterIP 10.96.0.1443/TCP 56d loki-stack ClusterIP 10.110.83.2093100/TCP 2m52s loki-stack-grafana ClusterIP 10.111.24.2680/TCP 2m52s loki-stack-headless ClusterIP None3100/TCP 2m52s
从上面可知,已经成功启动,其中loki暴露的容器端口为3100,grafana暴露的端口为80。因此我们下一步需要进行端口转发,才能访问grafana。
PS C:\Users\Shengjie> kubectl port-forward svc/loki-stack-grafana 3000:80Forwarding from 127.0.0.1:3000 -> 3000Forwarding from [::1]:3000 -> 3000
然后本地浏览器打开http://localhost:3000/就可以访问了。其默认用户是admin,默认密码在哪里呢,别慌,我们去看下loki-stack chart 的readme:
PS C:\Users\Shengjie> helm show readme loki/loki-stack# Loki-Stack Helm Chart## PrerequisitesMake sure you have Helm [installed](https://helm.sh/docs/using_helm/#installing-helm) and[deployed](https://helm.sh/docs/using_helm/#installing-tiller) to your cluster. Then addLoki's chart repository to Helm:$ helm repo add loki https://grafana.github.io/loki/chartsYou can update the chart repository by running:$ helm repo update## Deploy Loki and Promtail to your cluster### Deploy with default config$ helm upgrade --install loki loki/loki-stack### Deploy in a custom namespace$ helm upgrade --install loki --namespace=loki-stack loki/loki-stack### Deploy with custom config$ helm upgrade --install loki loki/loki-stack --set "key1=val1,key2=val2,..."## Deploy Loki and Fluent Bit to your cluster$ helm upgrade --install loki loki/loki-stack \--set fluent-bit.enabled=true,promtail.enabled=false## Deploy Grafana to your clusterThe chart loki-stack contains a pre-configured Grafana, simply use `--set grafana.enabled=true`To get the admin password for the Grafana pod, run the following command:$ kubectl get secret --namespaceloki-grafana -o jsonpath="{.data.admin-password}" | base64 --decode ; echo To access the Grafana UI, run the following command:$ kubectl port-forward --namespaceservice/loki-grafana 3000:80 Navigate to http://localhost:3000 and login with `admin` and the password output above.Then follow the [instructions for adding the loki datasource](/docs/getting-started/grafana.md), using the URL `http://loki:3100/`
上面已经说了很清楚了,可以从secret中获取。
如果在windows powersheel中执行,需要分两步:1. 先获取base64加密的密码PS C:\Users\Shengjie> $pwd= kubectl get secret --namespace default loki-stack-grafana -o jsonpath="{.data.admin-password}"2. decode base64PS C:\Users\Shengjie> [Text.Encoding]::Utf8.GetString([Convert]::FromBase64String($pwd))CjnbkkQmwQynZ96gCsynSf0elYQLOp4dyuDnp9jJ------------------------Linux命令行执行:shengjie@Thinkpad:/mnt/c/Users/Shengjie$ kubectl get secret --namespace default loki-stack-grafana -o jsonpath="{.data.admin-password}" | base64 --decode ; echoCjnbkkQmwQynZ96gCsynSf0elYQLOp4dyuDnp9jJ
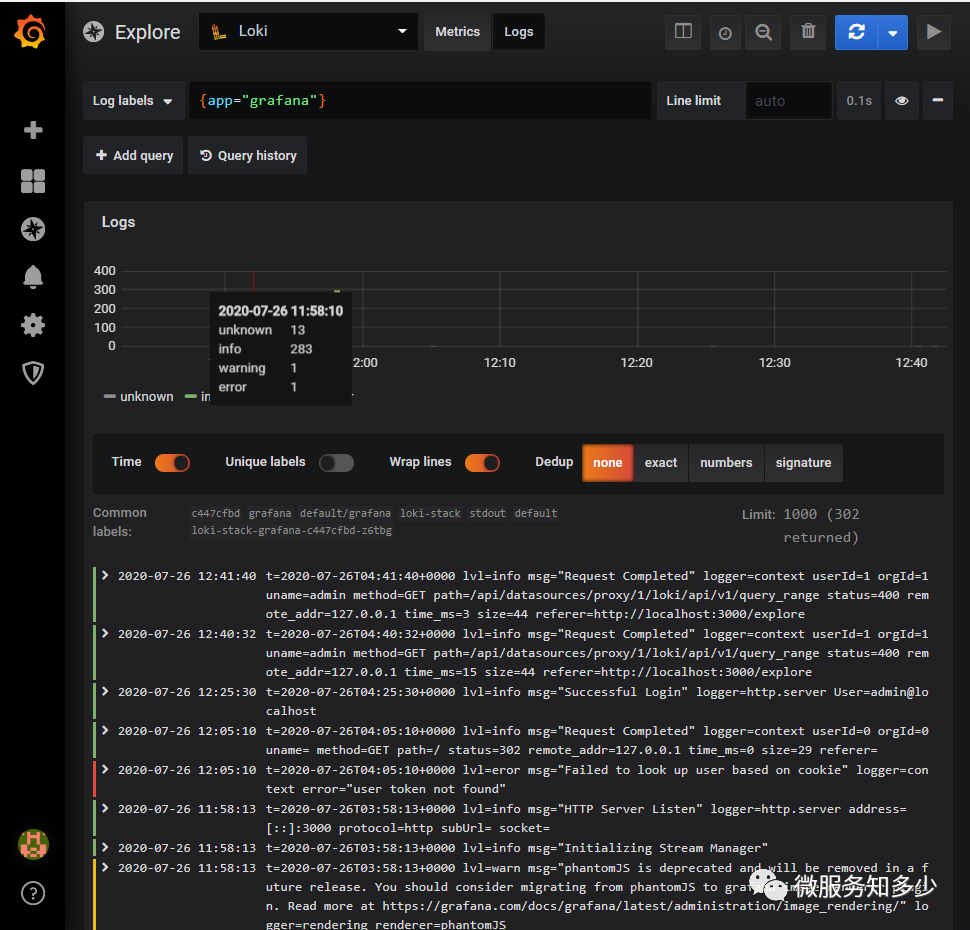
然后使用admin/CjnbkkQmwQynZ96gCsynSf0elYQLOp4dyuDnp9jJ即可成功登录http://localhost:3000/。
5. Use Loki With .NET Core
下一步,我们就来创建一个ASP.NET Core Web 应用,将日志记录到Loki,并通过Grafana进行聚合分析。
PS C:\Users\Shengjie> dotnet new web -n Loki.K8s.DemoThe template "ASP.NET Core Empty" was created successfully.Processing post-creation actions...Running 'dotnet restore' on Loki.K8s.Demo\Loki.K8s.Demo.csproj...Determining projects to restore...Restored C:\Users\Shengjie\Loki.K8s.Demo\Loki.K8s.Demo.csproj (in 150 ms).Restore succeeded.PS C:\Users\Shengjie> cd .\Loki.K8s.Demo\# 添加Serilog.AspNetCore和Serilog.Sinks.Loki Nuget包。PS C:\Users\Shengjie\Loki.K8s.Demo> dotnet add package Serilog.AspNetCorePS C:\Users\Shengjie\Loki.K8s.Demo> dotnet add package Serilog.Sinks.Loki
从上可知,日志组件选用的是Serilog,因为其支持持久化日志到Loki。修改Program.cs如下:
public static IHostBuilder CreateHostBuilder(string[] args) =>Host.CreateDefaultBuilder(args).ConfigureWebHostDefaults(webBuilder =>{webBuilder.UseStartup(); }).UseSerilog((ctx, cfg) =>{//cfg.MinimumLevel.Override("Microsoft", LogEventLevel.Warning);//Microsoft框架本身的日志,仅输出Warning以上级别cfg.Enrich.FromLogContext().Enrich.WithProperty("App", ctx.HostingEnvironment.ApplicationName).Enrich.WithProperty("ENV", ctx.HostingEnvironment.EnvironmentName).WriteTo.LokiHttp(new NoAuthCredentials("http://localhost:3100"))//配置Loki Url和认证方式.WriteTo.Console();});
修改Startup.cs的Configure方法如下:
public void Configure(IApplicationBuilder app, IWebHostEnvironment env,ILoggerlogger) {if (env.IsDevelopment()){app.UseDeveloperExceptionPage();}app.UseRouting();app.UseEndpoints(endpoints =>{endpoints.MapGet("/", async context =>{logger.LogInformation("start handle request!");await context.Response.WriteAsync("Hello World!");logger.LogInformation("end handle request!");});});}
因为不想把应用打包成镜像运行到K8S中,所以我们需要把K8S的Loki服务做一次端口转发暴露到本机,转发后,就可以使用http://localhost:3100作为Loki的Url进行日志写入啦。
PS C:\Users\Shengjie\Loki.K8s.Demo> kubectl port-forward svc/loki-stack 3100:3100Forwarding from 127.0.0.1:3100 -> 3100Forwarding from [::1]:3100 -> 3100
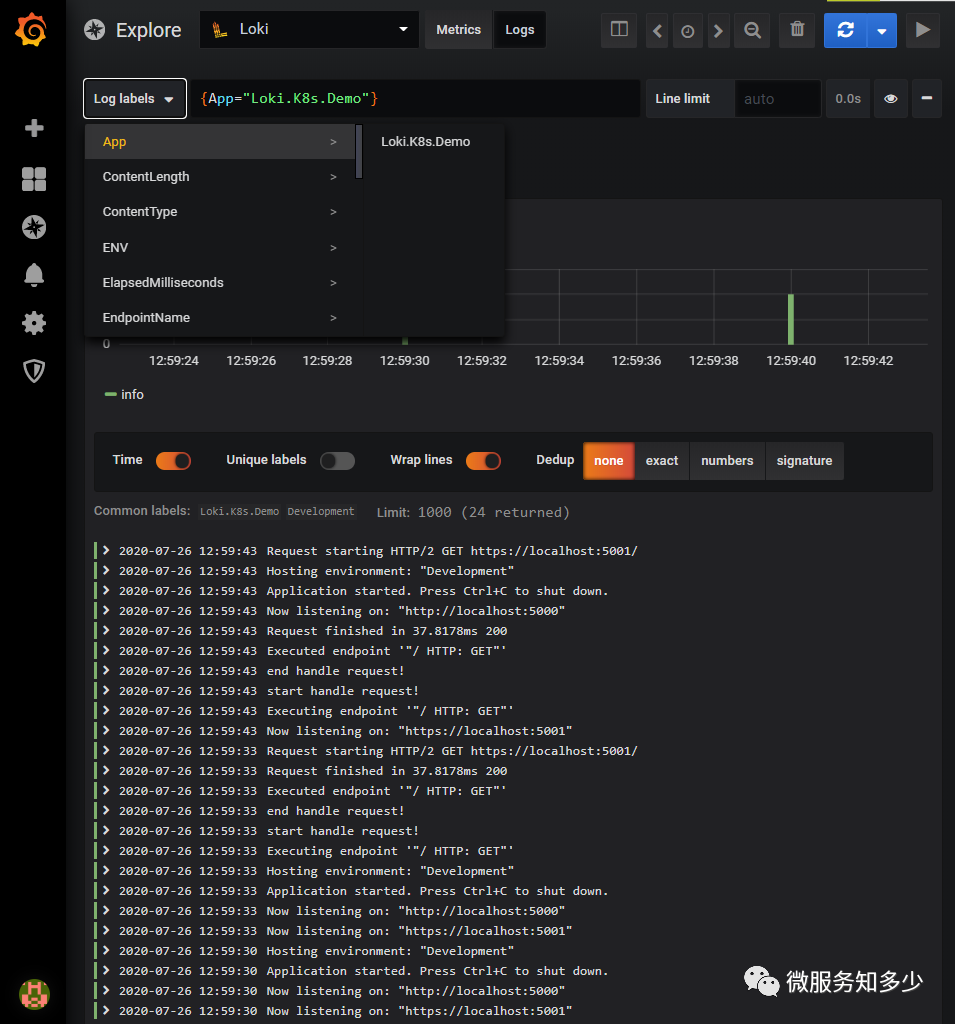
运行项目后,重新打开Grafana,添加过滤条件,就可以查看应用日志了。
参考资料:
日志聚合工具loki CSDN-linkt1234-Loki Loki官方文档