使用 web-vitals 监控 web app 的性能

是什么?
Vitals
英汉翻译:
n. 命脉(vital的复数);(人体的)重要器官;要害
网络释义:
vitals: 重要器官 Striking the Vitals: 攻其要害
web vitals[1] 指的是一些关键指标,可以用来量化网页的用户体验,定义如何改进网页的质量(这是 google 推出的用户体验量化指标)。从 React 16 到 React 17 我们可以看到一个变化是原先 /src 目录下的 serviceWorker[2] 被替换成了 webVitals,React 团队可能认为对于大多数 web 应用 webVitals 相比 serviceWorker 更有用。这里[3]有一个 google 开源的实现,相关下载也很简单:
npm install web-vitals有哪些关键指标

这些关键指标只是 web vitals 的一个子集,不是全部,但几乎每个网站都需要关注这三个指标:
LCP (Largest Contentful Paint)
最大内容渲染时间:指的是从用户请求网址到窗口中渲染最大可见内容所需要的事件(最大可见内容通常是图片或者视频,或者大块的文本)
FID (First Input Delay)
首次输入延迟:指的是从用户首次与网页互动(点击链接、按钮等)到浏览器响应此次互动直接的时间。用于判断网页进入互动状态的时间。
CLS (Cumulative Layout Shift)
累计布局偏移:得分范围0-1,指的是网页布局在加载期间的偏移量,0表示没有偏移,1表示最大偏移,这个指标指示用户与网站的交互体验,如果网址在加载过程布局一直跳动,用户体验会很差。比如加载一张图片,但没有大小空白占位,导致图片显示时页面高度跳动。
哪些测量工具支持这些指标?
| 测量工具 | LCP | FID | CLS |
| Chrome User Experience Report | ✔ | ✔ | ✔ |
| PageSpeed Insights | ✔ | ✔ | ✔ |
| Search Console (Core Web Vitals report) | ✔ | ✔ | ✔ |
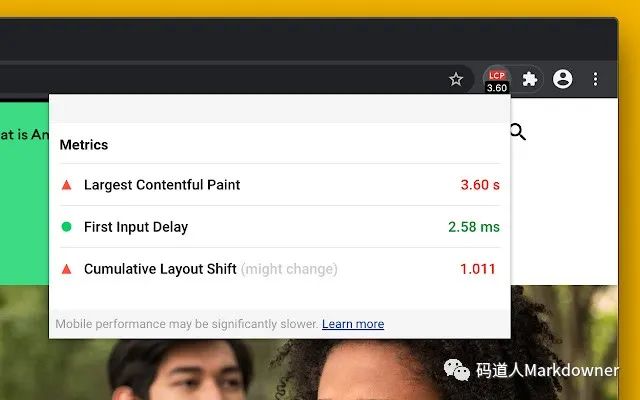
如果你使用 chrome,还可以使用这个chrome 插件[4],可以直接看到网页的指标,如图:
怎样的指标才算好?
一般可以按下面表格评估应用的用户体验:
| 良好 | 需要改进 | 速度慢 | |
| LCP | <=2.5 秒 | <=4 秒 | >4 秒 |
| FID | <=100 毫秒 | <=300 毫秒 | >300 毫秒 |
| CLS | <=0.1 | <=0.25 | >0.25 |
怎么用?
简单打印指标
React 17 开箱代码已经提供了基本使用方法:
import { ReportHandler } from 'web-vitals';const reportWebVitals = (onPerfEntry?: ReportHandler) => {if (onPerfEntry && onPerfEntry instanceof Function) {import('web-vitals').then(({ getCLS, getFID, getFCP, getLCP, getTTFB }) => {getCLS(onPerfEntry);getFID(onPerfEntry);getFCP(onPerfEntry);getLCP(onPerfEntry);getTTFB(onPerfEntry);});}};export default reportWebVitals;
在 index.ts 中简单使用:
import React from 'react';import ReactDOM from 'react-dom';import './index.scss';import App from './App';import reportWebVitals from './reportWebVitals';ReactDOM.render(</React.StrictMode>,document.getElementById('root'));reportWebVitals(console.log);
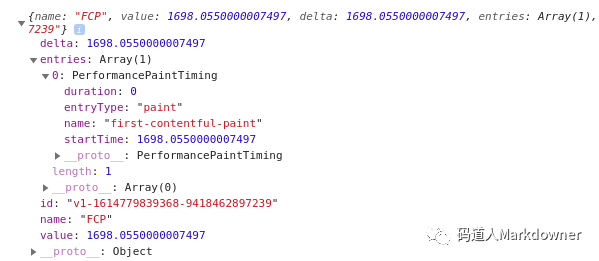
这样可以看到类似的打印信息:
与 google analytics 结合使用(前提已经部署 analytics.js 或者 gtag.js 代码)
使用 analytics.js
function sendToGoogleAnalytics({name, delta, id}) {ga('send', 'event', {eventCategory: 'Web Vitals',eventAction: name,eventLabel: id,// analytics 只能接受整数eventValue: Math.round(name === 'CLS' ? delta * 1000 : delta),nonInteraction: true,transport: 'beacon',});}
使用 gtag.js
function sendToGoogleAnalytics({name, delta, id}) {gtag('event', name, {event_category: 'Web Vitals',event_label: id,value: Math.round(name === 'CLS' ? delta * 1000 : delta),non_interaction: true,});}
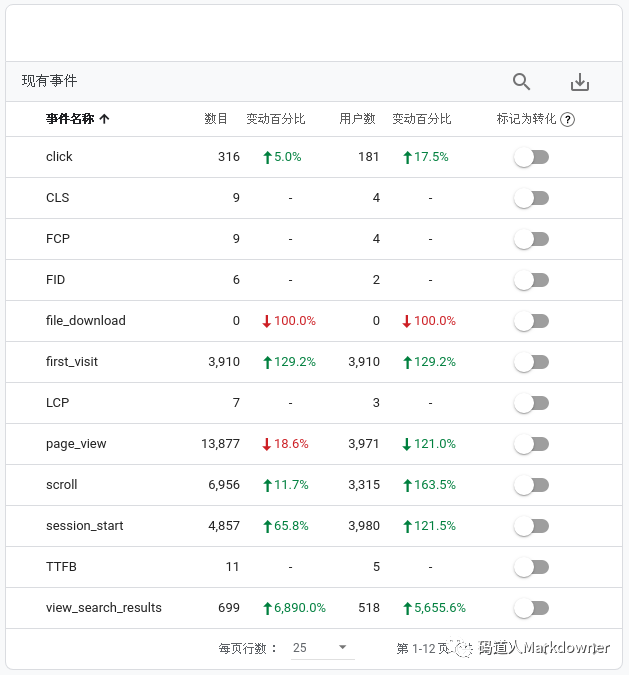
可以在 google analytics 的事件中看到:
我们随便点进一个事件 CLS,可以看到监控数据:
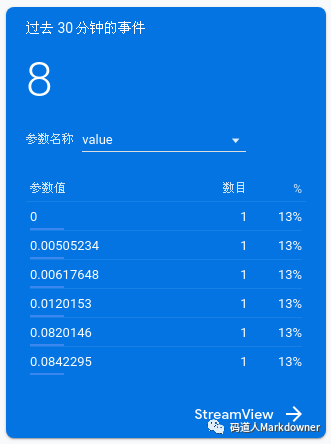
可以看到整体 CLS <= 0.1,说明网页加载过程中没有过大的页面跳动,用户体验较好
参考资料
Web Vitals[5]
GoogleChrome/web-vitals[6]
Getting started with measuring Web Vitals[7]
Measuring Performance[8]
"核心网页指标"报告[9]
Google Analytics中gtag.js和analytics.js到底有什么区别[10]
References
[1] web vitals: https://web.dev/vitals/[2] serviceWorker: https://developer.mozilla.org/en-US/docs/Web/API/Service_Worker_API[3] 这里: https://github.com/GoogleChrome/web-vitals[4] chrome 插件: https://chrome.google.com/webstore/detail/web-vitals/ahfhijdlegdabablpippeagghigmibma?hl=en[5] Web Vitals: https://web.dev/vitals/[6] GoogleChrome/web-vitals: https://github.com/GoogleChrome/web-vitals[7] Getting started with measuring Web Vitals: https://web.dev/vitals-measurement-getting-started/[8] Measuring Performance: https://create-react-app.dev/docs/measuring-performance/[9] "核心网页指标"报告: https://support.google.com/webmasters/answer/9205520?hl=zh-Hans[10] Google Analytics中gtag.js和analytics.js到底有什么区别: https://www.guozhenyi.com/p/anb8h35744d8

