
超赞!Python中的6个三维可视化工具!

来源:pythonic生物人
Python拥有很多优秀的三维图像可视化工具,主要基于图形处理库 WebGL、OpenGL或者VTK。这些工具主要用于 大规模空间标量数据、向量场数据、张量场数据等等的可视化,实际运用场景主要在海洋大气建模、飞机模型设计、桥梁设计、电磁场分析等等。工具背后的算法逻辑非常复杂,由于小编是非专业的,不敢造次 。 本文简单介绍几个Python三维图像可视化工具,工具都有大量demo、完善的使用文档、功能非常强大,系统学习请戳文中链接。
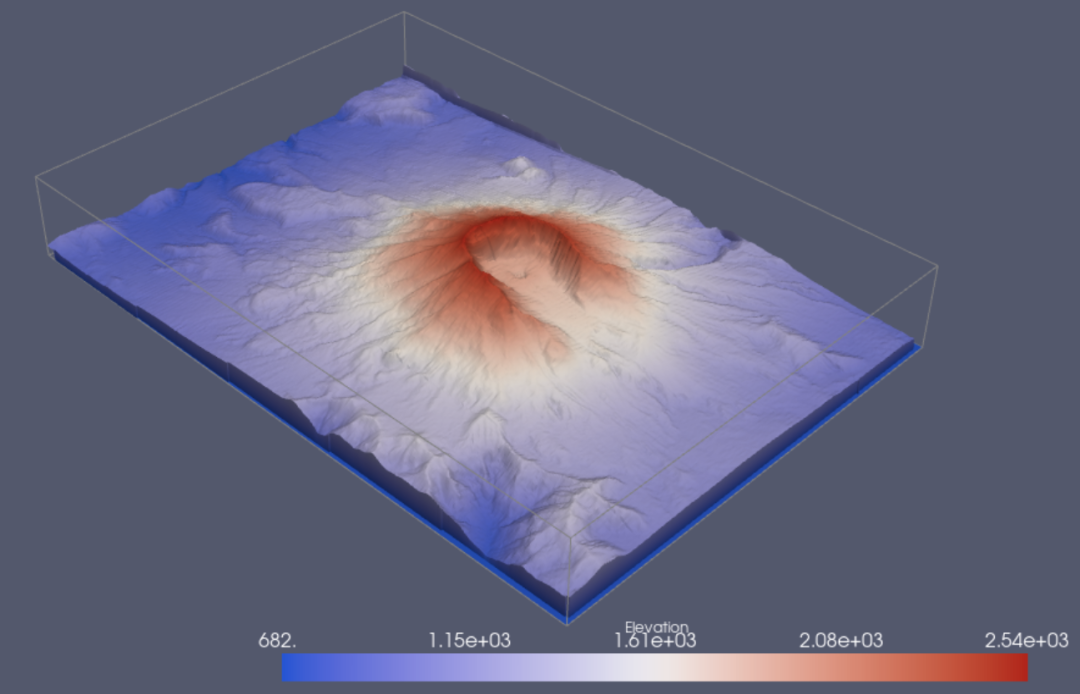
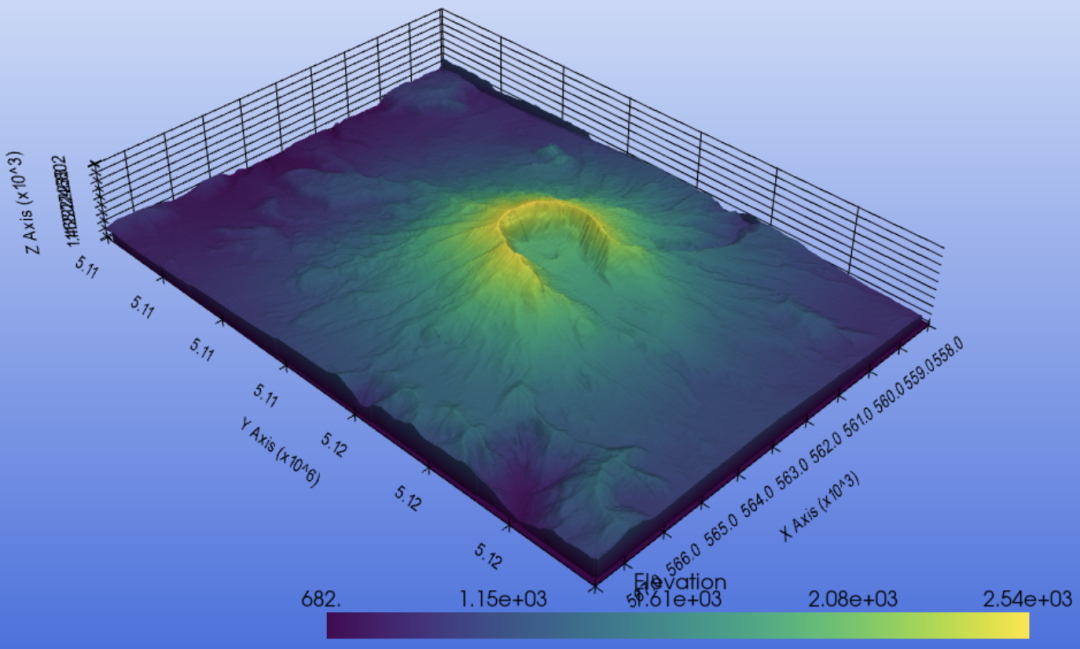
pyvista
专注于3D可视化和mesh分析,底层是VTK👉VTK: 三维图像处理和可视化利器
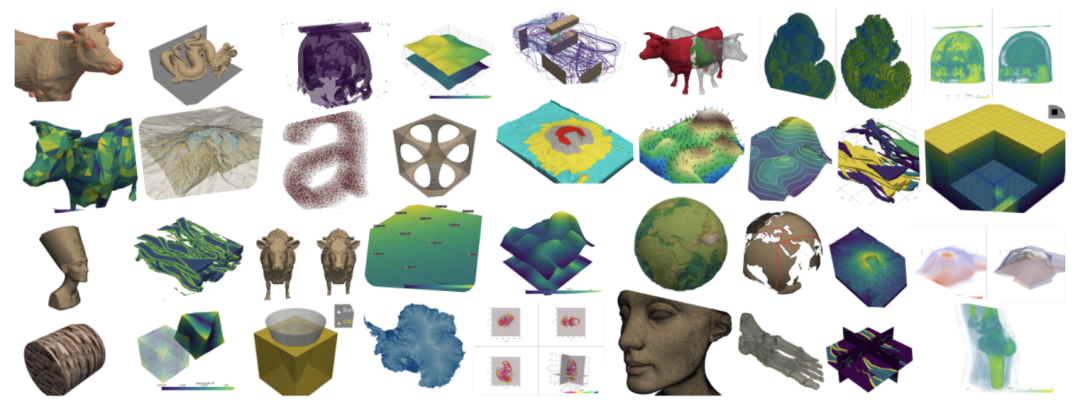
进一步学习:https://github.com/pyvista/pyvista
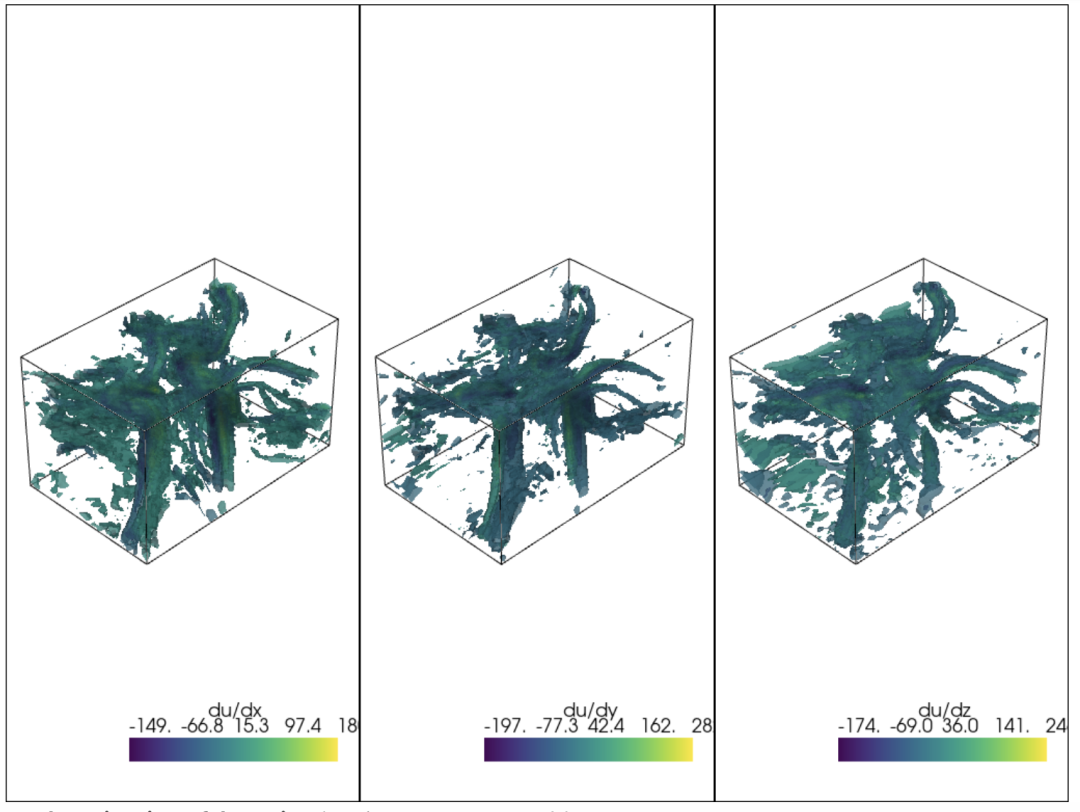
Glumpy
作者为Nicolas P. Rougier,Glumpy是Python、Numpy和OpenGL的完美结合,支持GPU加速,让可视化变得快速、美观、动态、可交互等。
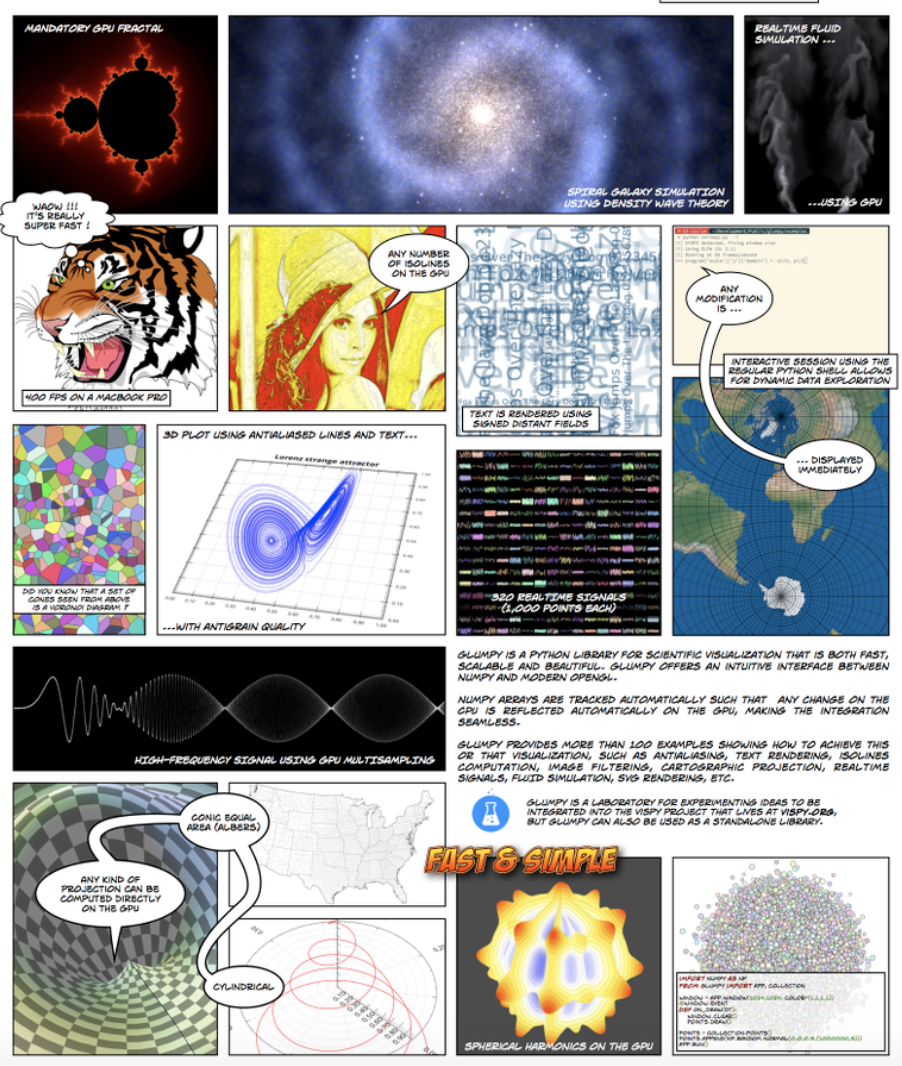
进一步学习:https://github.com/glumpy/glumpy
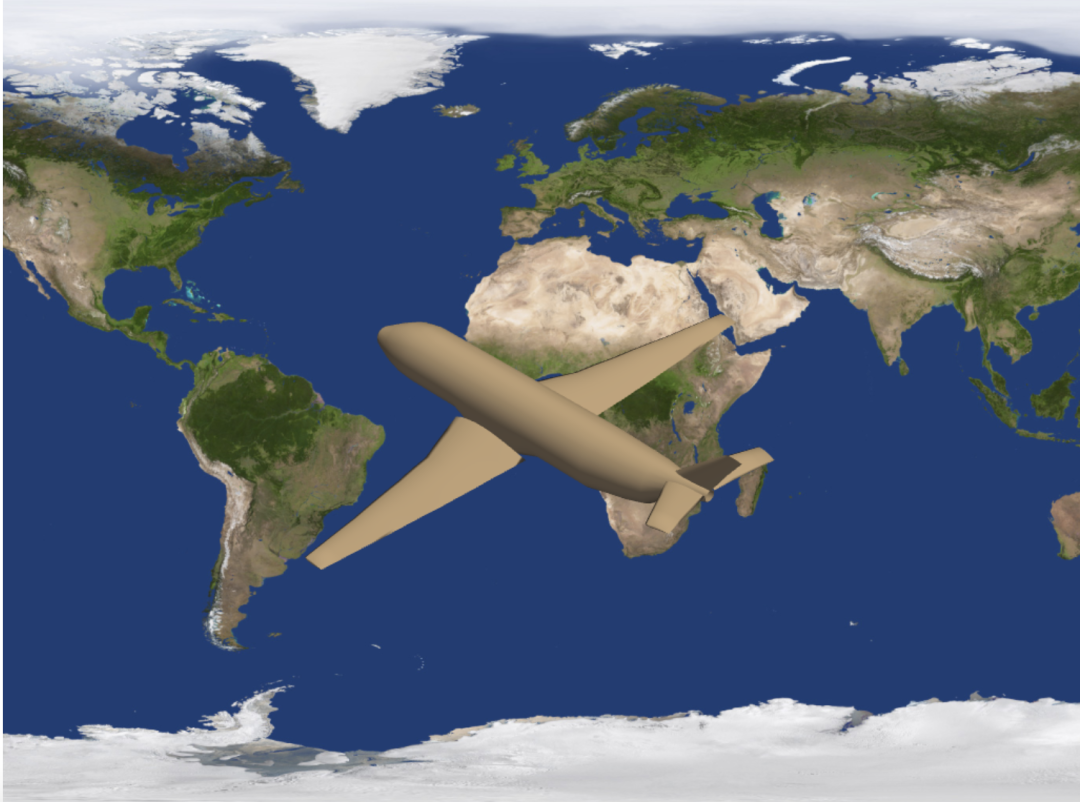
itkwidgets
itkwidgets是Jupyter的一个交互式小部件,主要运用于可视化图像、点集和mesh。
进一步学习:https://github.com/InsightSoftwareConsortium/itkwidgets
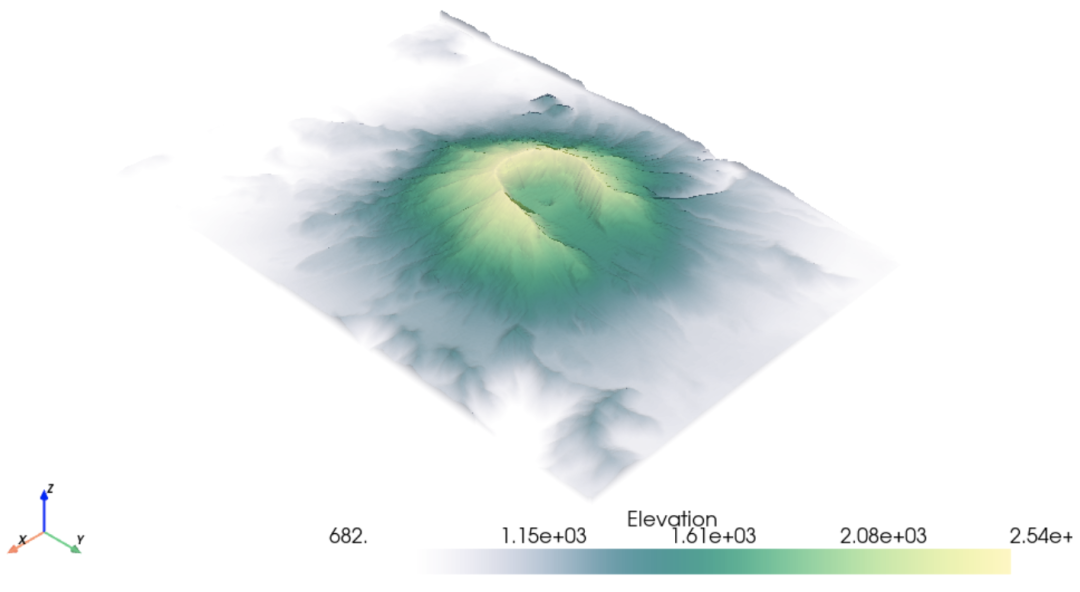
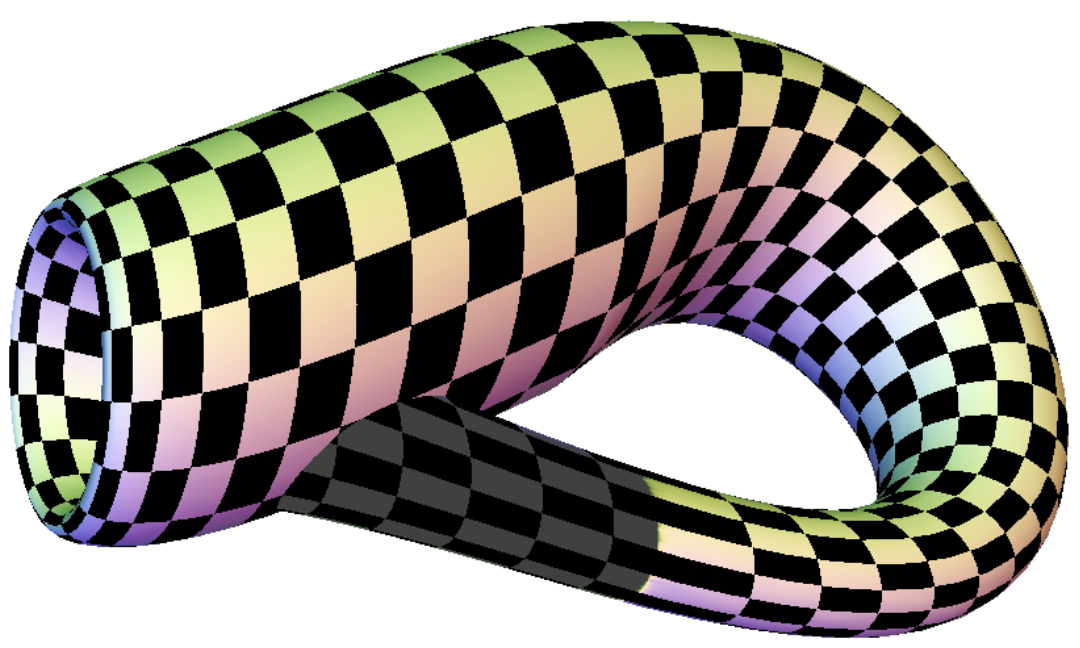
vedo
几行代码实现3D point clouds, meshes and volumes
进一步学习:https://github.com/marcomusy/vedo
ipyvolume
可在Jupyter Notebook中渲染3D图,基于WebGL,功能较少。
进一步学习:https://github.com/widgetti/ipyvolume
mayavi
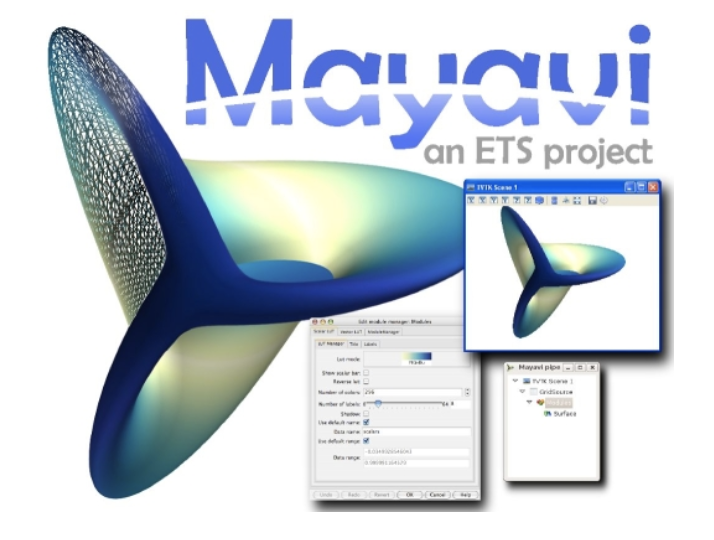 mayavi主要有两大部分功能:
mayavi.mlab用于处理图形可视化和图形操作,类似于matlab和matplotlib;mayavi.tools.pipeline用于操作管线对象窗口对象。
进一步学习:http://docs.enthought.com/mayavi/mayavi/index.html
END
推荐阅读
吴恩达deeplearining.ai的经典总结资料
Ps:从小程序直接获取下载
评论