如何快速定位当前数据库消耗 CPU 最高的 SQL 语句?
点击下方“IT牧场”,选择“设为星标”

来源:https://www.toutiao.com/i6923526305795293707?wid=1623686217615
概述
如果是Oracle数据库我们可以很容易通过sql来定位到当前数据库中哪些消耗CPU高的语句,而mysql数据库可以怎么定位呢?这里用一个简单例子说明下...
主要是了解如何定位的思路,具体看官网介绍..
参考:https://www.percona.com/blog/2020/04/23/a-simple-approach-to-troubleshooting-high-cpu-in-mysql/
One of our customers recently asked whether it is possible to identify, from the MySQL side, the query that is causing high CPU usage on his system. The usage of simple OS tools to find the culprit has been a widely used technique for a long time by PostgreSQL and Oracle DBAs, but it didn’t work for MySQL as historically we’ve lacked the instrumentation to match an OS thread with an internal processlist thread – until recently.
Percona added support to map processlist ids to OS thread ids through column TID of the information_schema.processlist table starting on Percona Server for MySQL 5.6.27. With the release of 5.7, MySQL followed with its own implementation by extending the PERFORMANCE_SCHEMA.THREADS table and adding a new column named THREAD_OS_ID, which Percona Server for MySQL adopted in place of its own, as it usually does remain as close to upstream as possible.
The following approach is useful for cases where there is a query overloading one particular CPU while other cores are performing normally. For cases where it is a general CPU usage issue, different methods can be used, such as the one in this other blog post Reducing High CPU on MySQL: A Case Study.
主要意思是针对定位CPU的问题,Percona增加了对通过信息的TID列将processlist ID映射到OS线程ID的支持,而MySQL在5.7版本后在 PERFORMANCE_SCHEMA.THREADS表加了一个THREAD_OS_ID新列来实现,以下方法适用于在其他内核正常运行时,某个特定CPU的查询过载的情况。
find out which session is using the most CPU resources in my database?
1、定位线程
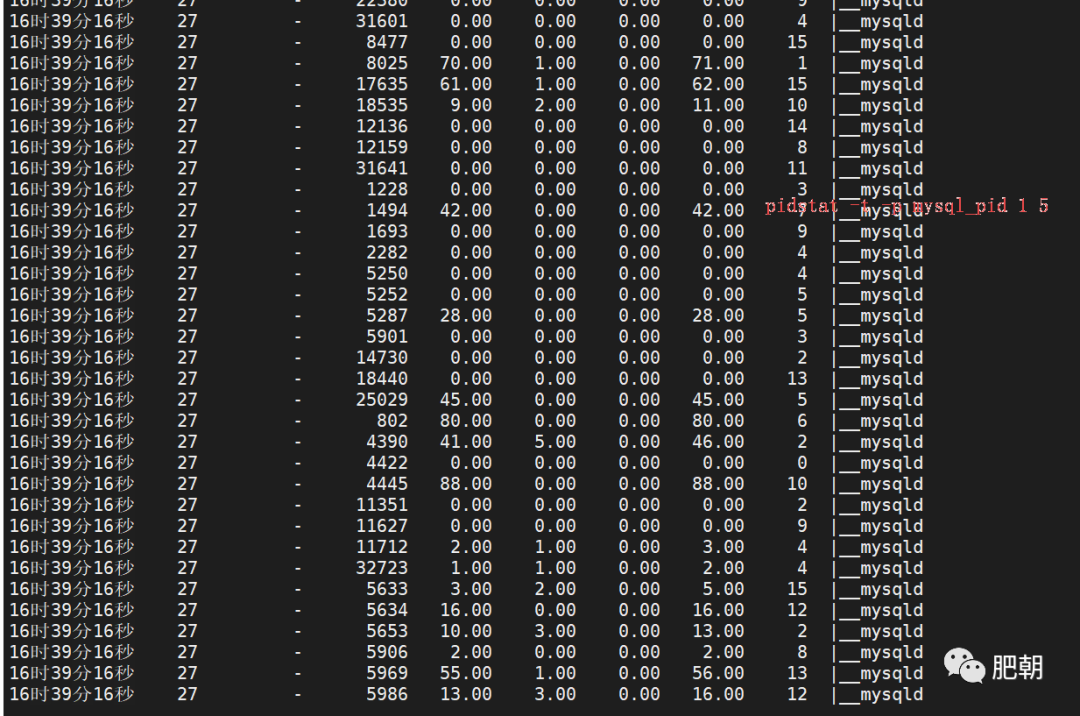
pidstat -t -p <mysqld_pid> 1 5

通过该命令我们可以定位到802、4445等线程消耗了大量的CPU,这里尽量确保在pidstat的多个样本中验证消耗是恒定的。根据这些信息,我们可以登录到数据库,并使用以下查询找出哪个MySQL线程是罪魁祸首。
2、定位问题sql
select * from performance_schema.threads where thread_os_id = xx ;
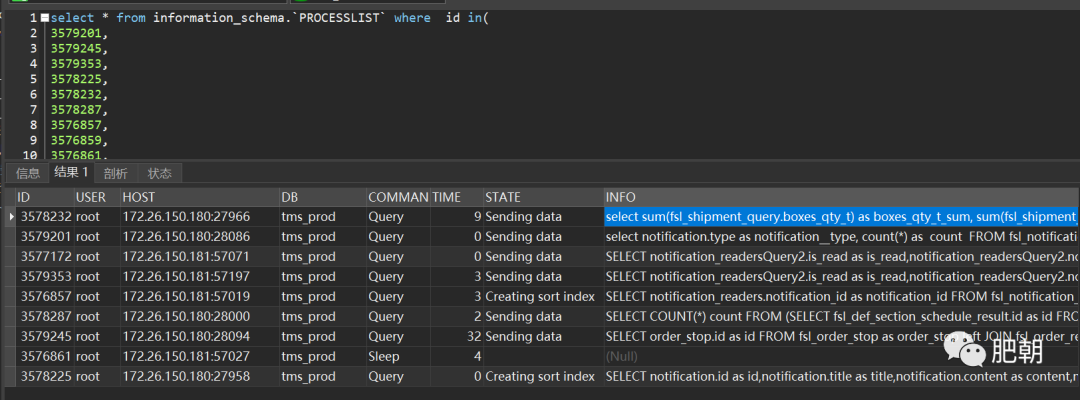
select * from information_schema.`PROCESSLIST` where  id=threads.processlist_id

根据操作系统id可以到processlist表找到对应的会话,如下:

3、查看问题sql执行计划
这里对应看一下执行计划基本就可以判断当前数据库CPU为什么消耗这么高了...
至于优化的点只需要在dock建一个索引即可,这里就不介绍了。

干货分享
最近将个人学习笔记整理成册,使用PDF分享。关注我,回复如下代码,即可获得百度盘地址,无套路领取!
•001:《Java并发与高并发解决方案》学习笔记;•002:《深入JVM内核——原理、诊断与优化》学习笔记;•003:《Java面试宝典》•004:《Docker开源书》•005:《Kubernetes开源书》•006:《DDD速成(领域驱动设计速成)》•007:全部•008:加技术群讨论
加个关注不迷路
喜欢就点个"在看"呗^_^
