
【Python】嫦娥探月数据(PDS)处理与可视化
大家好,本鲸来蹭嫦娥5号的热度了。
2020年11月24日4时30分,我国在中国文昌航天发射场,用长征五号遥五运载火箭成功发射探月工程嫦娥五号探测器。正式开启我国首次地外天体采样返回之旅。(并在12月1日23时11分,成功着陆月球并传回着陆影像图)
随后,美国国家航空航天局(NASA)在其官方推特账号上对中国航天取得的新突破进行了一番点评。

“随着嫦娥五号的发射升空,中国开始努力加入美国和前苏联获取月面样本的行列。我们希望中国和全球科学界分享中国探月工程所获得的数据,以增进我们对于月球的了解,就像美国的阿波罗计划和阿尔忒弥斯计划所做的那样。”
这话。。。中国探月工程数据发布与信息服务系统(http://moon.bao.ac.cn/)表示有些莫名奇妙。。。
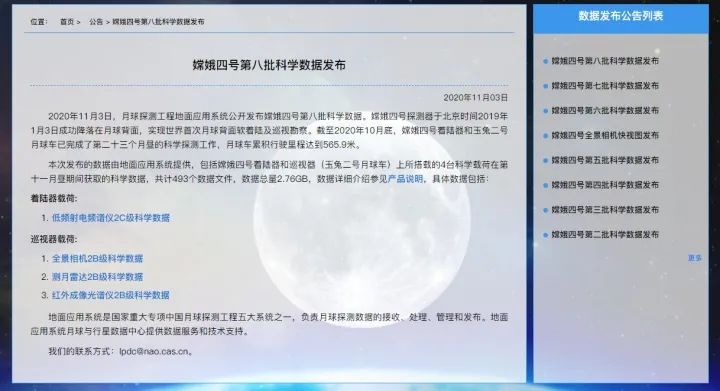
早在2018年4月04日,该网站就发布了“嫦娥二号全月50米分辨率DEM数据”,并且就在前不久的11月3日,该网站还发布了嫦娥四号第八批科学数据。
这不由地让我想关心一句“NASA你是这个格式的数据读不出”吗?
这不,和鲸社区的 @lqy 大佬制作了在线项目,专题介绍了中国探月工程数据发布与信息服务系统(http://moon.bao.ac.cn/)如何使用,如何获取数据,如何读取数据的问题,希望NASA的同学全文阅读,尽量减少不必要的误会,靴靴。
项目链接
嫦娥探月数据(PDS)处理与可视化
https://www.kesci.com/mw/project/5fc081b065710400309ef8e7
示例数据链接
嫦娥四号探月工程数据
https://www.kesci.com/mw/dataset/5fc4ec4b6571040030a1bd5f
项目概览
(数据获取略)
安装模块
!pip install --upgrade pip
!pip install pds4-tools==1.2
!pip install colour-demosaicing==0.1.6
导入模块
from pds4_tools import pds4_read
import matplotlib.pyplot as plt
import matplotlib
%matplotlib inline

import numpy as np
from PIL import Image

from skimage import exposure
from skimage import data, img_as_float
import colour

from colour_demosaicing import (
    demosaicing_CFA_Bayer_bilinear,
    demosaicing_CFA_Bayer_Malvar2004,
    demosaicing_CFA_Bayer_Menon2007,
    mosaicing_CFA_Bayer)
cctf_encoding = colour.cctf_encoding
_ = colour.utilities.filter_warnings()
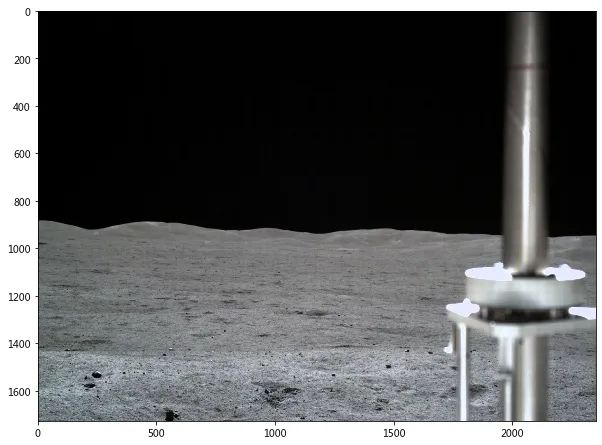
灰度图像
path = 'CE4_GRAS_TCAM-I-023_SCI_N_20190106035123_20190106035123_0004_A.2CL'
d = pds4_read(path, quiet=True)
fig, axes = plt.subplots(1,1,figsize=(10,10))
img = np.array(d[0].data)
axes.imshow(img, cmap='gray')
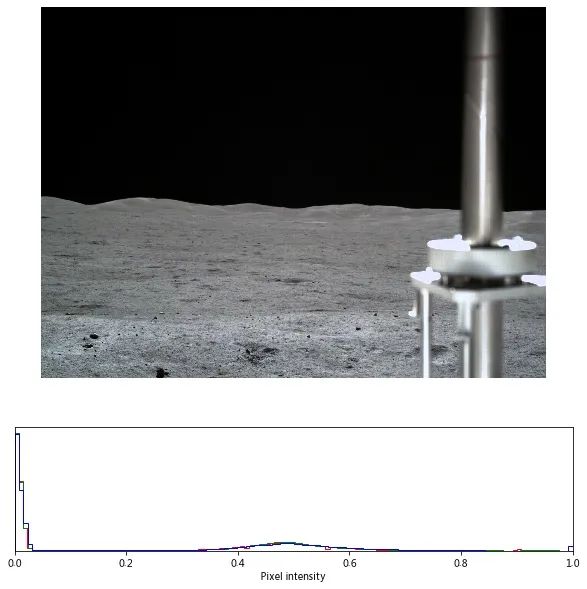
灰度图+直方图
def read_pds(path):
    data = pds4_read(path, quiet=True)
    img = np.array(data[0].data)
    img = img_as_float(img)
    return img

def plot_img_and_hist(image, hist=True, bins=128):
    """Plot an image along with its histogram.
    """
    if hist:
        fig, axes = plt.subplots(2,1, figsize=(10,10), gridspec_kw={'height_ratios': [3, 1]})
        ax_img, ax_hist = axes
    else:
        fig, ax_img = plt.subplots(figsize=(10,10))

    # Display image
    ax_img.imshow(image, cmap='gray')
    ax_img.set_axis_off()

    if hist:
        # Display histogram
        ax_hist.hist(image[:,:,0].ravel(), bins=bins, histtype='step', color='red')
        ax_hist.hist(image[:,:,1].ravel(), bins=bins, histtype='step', color='green')
        ax_hist.hist(image[:,:,2].ravel(), bins=bins, histtype='step', color='blue')

        ax_hist.ticklabel_format(axis='y', style='scientific', scilimits=(0, 0))
        ax_hist.set_xlabel('Pixel intensity')
        ax_hist.set_xlim(0, 1)
        ax_hist.set_yticks([])

def export_img(name, img):
    pil_img = Image.fromarray(np.uint8(img*255))
    pil_img.save(name)

path = 'CE4_GRAS_TCAM-I-023_SCI_N_20190106035123_20190106035123_0004_A.2CL'
img = read_pds(path)
plot_img_and_hist(img, hist=True)
plt.show()
export_img(f"{path}.png", img)
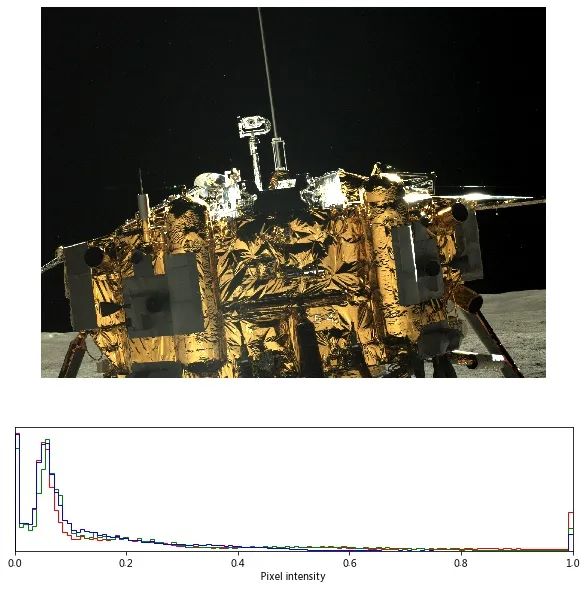
彩色图
def debayer_img(img, CFA='RGGB'):
    # Menon2007 yields better edges than bilinear
    debayered = cctf_encoding(demosaicing_CFA_Bayer_Menon2007(img, CFA))
    return debayered
def stretch_img(img):
    p2, p98 = np.percentile(img, (2, 98))
    img = exposure.rescale_intensity(img, in_range=(p2, p98))
    return img

path = '/home/kesci/input/CE44057/CE4_GRAS_PCAML-C-006_SCI_N_20190104084559_20190104084559_0001_B.2BL'
img = read_pds(path)
print(img.shape)
debayered = debayer_img(img)
final = stretch_img(debayered)
plot_img_and_hist(final, hist=True)
plt.show()
export_img(f"{path}.png", final)
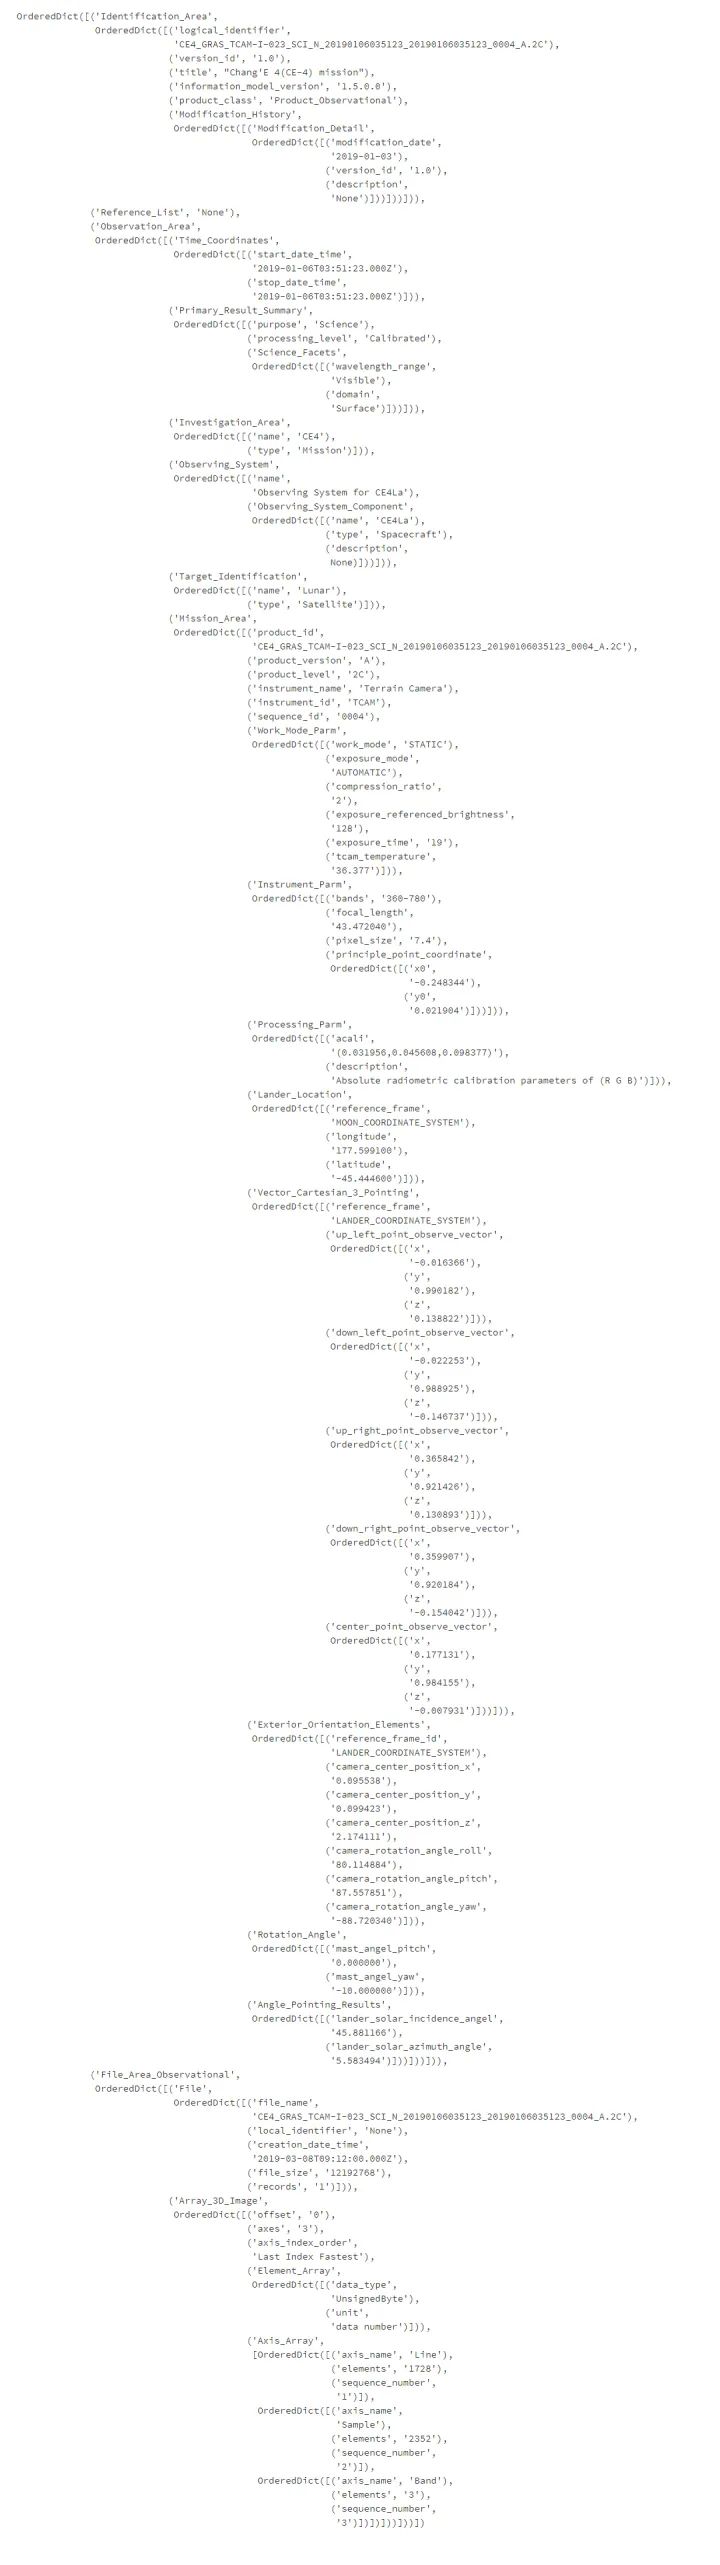
查看属性
d.label.to_dict()['Product_Observational']
参考资料
[1]用Python打开嫦娥玉兔的科学数据:
https://zhuanlan.zhihu.com/p/106395591
[2]ChangE_4_data_playground
https://github.com/siyu6974/ChangE_4_data_playground
[3]嫦娥探月数据(PDS)处理与可视化:
https://www.kesci.com/mw/project/5fc081b065710400309ef8e7
往期精彩回顾
获取本站知识星球优惠券,复制链接直接打开:
https://t.zsxq.com/qFiUFMV
本站qq群704220115。
加入微信群请扫码: