
搭建Prometheus+Grafana的云平台监控系统
1.1 Prometheus和Grafana概述
1.2 安装配置Prometheus监控服务
1.3 启动用于采集linux系统和mysql服务状态的exporter服务
1.4 实战-使用Grafana可视化工具美化监控数据显示效果
1.5 实战-Grafana配置邮件告警
1.1 Prometheus和Grafana概述
1.1.1 Prometheus概述
Prometheus(普罗米修斯)是一套开源的监控&报警&时间序列数据库的组合,起始是由SoundCloud公司开发的。现在最常见的Docker、Mesos、Kubernetes容器管理系统中,通常会搭配Prometheus进行监控。 Prometheus [prəˈmiθju:s] 普罗米修斯
Prometheus基本原理是通过HTTP协议周期性抓取被监控组件的状态,这样做的好处是任意组件只要提供HTTP接口就可以接入监控系统,不需要任何SDK或者其他的集成过程。这样做非常适合虚拟化环境比如VM或者Docker 。
输出被监控组件信息的HTTP接口被叫做exporter。目前互联网公司常用的组件大部分都有exporter可以直接使用,比如Varnish、Haproxy、Nginx、MySQL、Linux 系统信息 (包括磁盘、内存、CPU、网络等等),具体支持的源看:
https://github.com/prometheus。
exporter ([ekˈspɔ:tə(r)] 出口商)
对比主流的监控工具的操作界面:
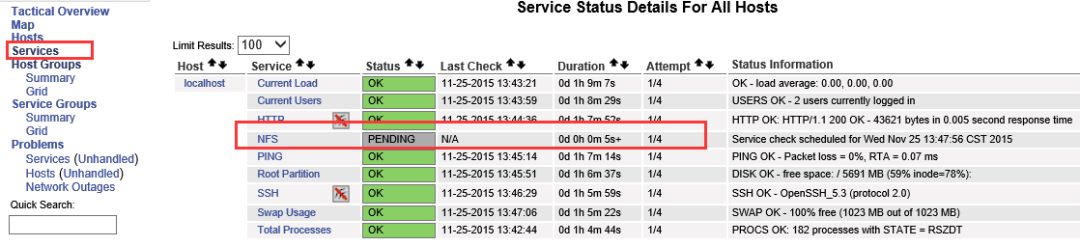
nagios监控界面:
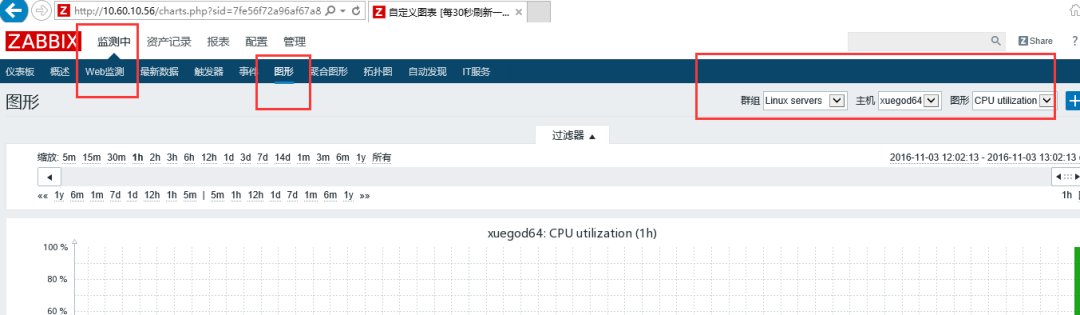
zabbix监控界面
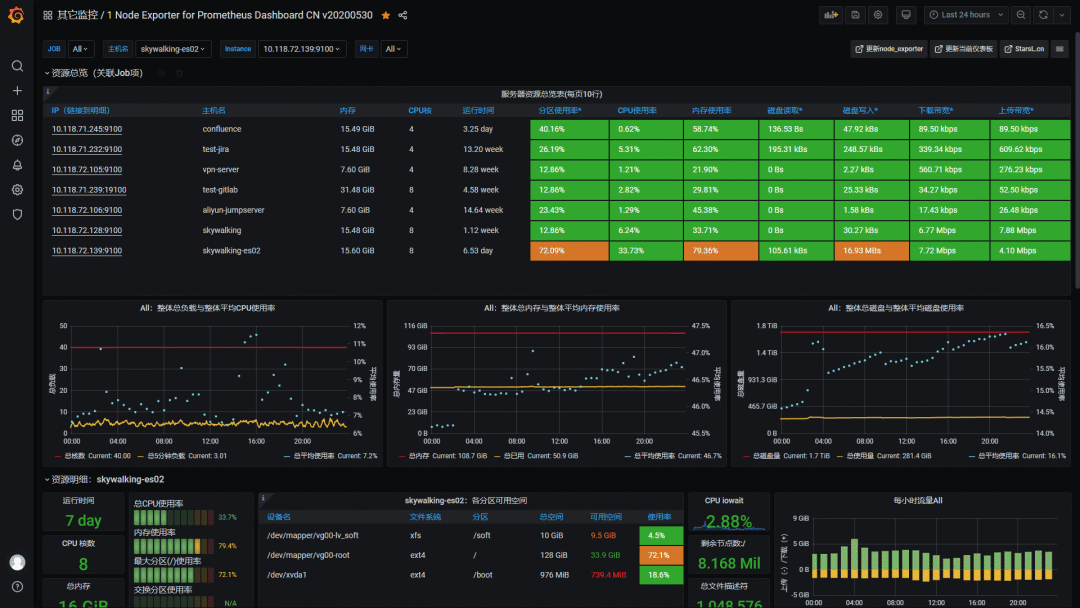
Grafana+Prometheus监控界面:
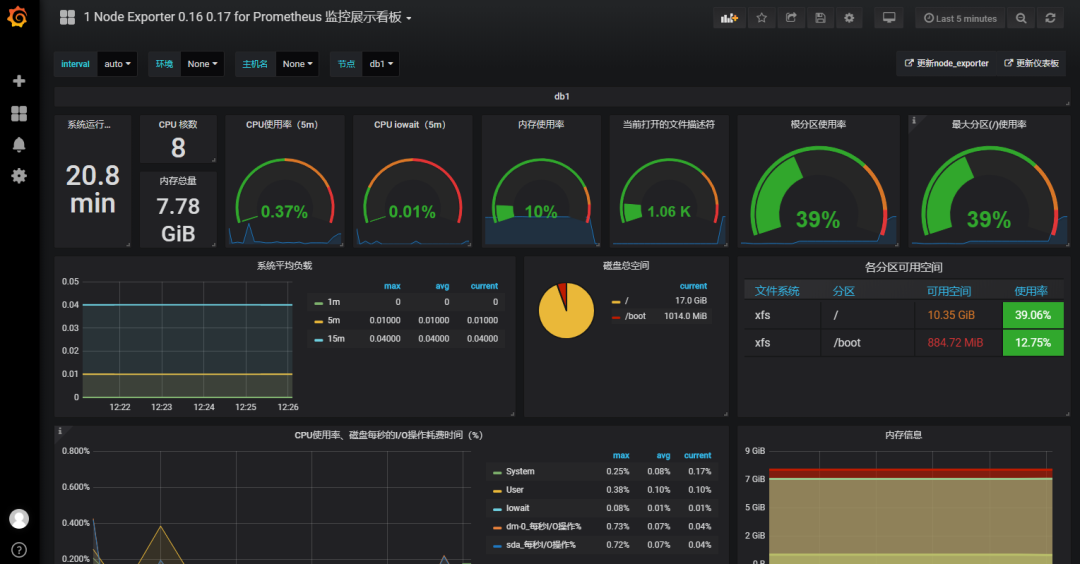
通过上面的界面,我们可以看出来Grafana+Prometheus展示界面更美观
1.1.2 Prometheus 架构图解
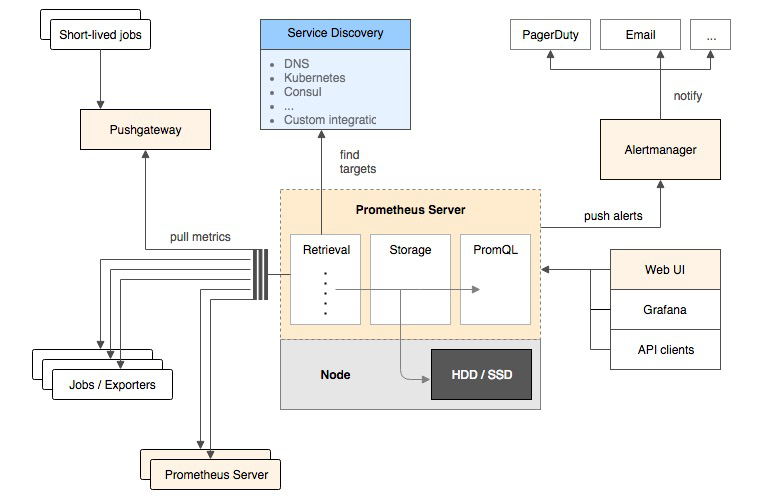
普罗米修斯(Prometheus)及其一些生态系统组件的整体架构:
retrieval [rɪˈtriːvl] 数据检索
Prometheus各组件运行流程如下:
1、Prometheus Server:Prometheus Sever是Prometheus组件中的核心部分,负责实现对监控数据的获取,存储及查询。Prometheus Server可以通过静态配置管理监控目标,也可以配合使用Service Discovery(服务发现)的方式动态管理监控目标,并从这些监控目标中获取数据。其次Prometheus Sever需要对采集到的数据进行存储,Prometheus Server本身就是一个实时数据库,将采集到的监控数据按照时间序列的方式存储在本地磁盘当中。Prometheus Server对外提供了自定义的PromQL,实现对数据的查询以及分析。另外Prometheus Server的联邦集群能力可以使其从其他的Prometheus Server实例中获取数据。
2、Exporters:Exporter将监控数据采集的端点通过HTTP服务的形式暴露给Prometheus Server,Prometheus Server通过访问该Exporter提供的Endpoint端点,即可以获取到需要采集的监控数据。可以将Exporter分为2类:
(1)、直接采集:这一类Exporter直接内置了对Prometheus监控的支持,比如cAdvisor,Kubernetes,Etcd,Gokit等,都直接内置了用于向Prometheus暴露监控数据的端点。
(2)、间接采集:原有监控目标并不直接支持Prometheus,因此需要通过Prometheus提供的Client Library编写该监控目标的监控采集程序。例如:Mysql Exporter,JMX Exporter,Consul Exporter等。
3、AlertManager:在Prometheus Server中支持基于Prom QL创建告警规则,如果满足Prom QL定义的规则,则会产生一条告警。常见的接收方式有:电子邮件,webhook 等。
4、PushGateway:Prometheus数据采集基于Prometheus Server从Exporter pull数据,因此当网络环境不允许Prometheus Server和Exporter进行通信时,可以使用PushGateway来进行中转。
Prometheus的工作流:
1.Prometheus server定期从配置好的jobs和exporters中拉取metrics,或者接收来自Pushgateway发送过来的metrics,或者从其它的Prometheus server中拉metrics。
metrics [ˈmetrɪks] 衡量指标
2.Prometheus server在本地存储收集到的metrics,并运行定义好的alerts.rules,记录新的时间序列或者向Alert manager推送警报。
3.Alertmanager根据配置文件,对接收到的警报进行处理,发出告警。
4.在图形界面中,可视化采集数据。
实验拓扑图:
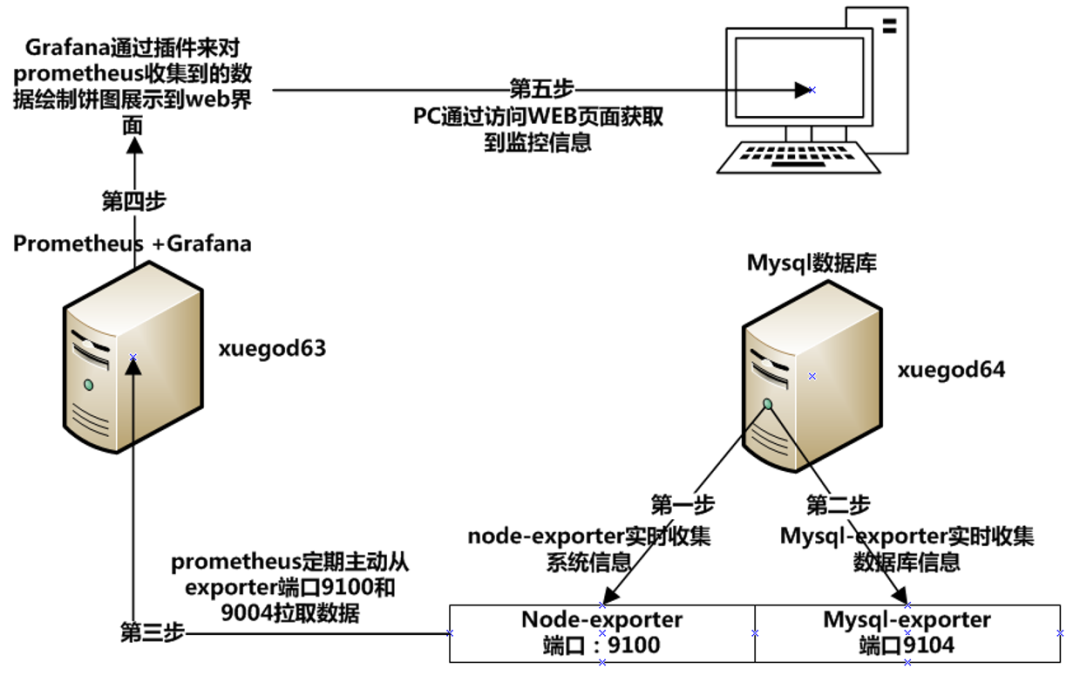
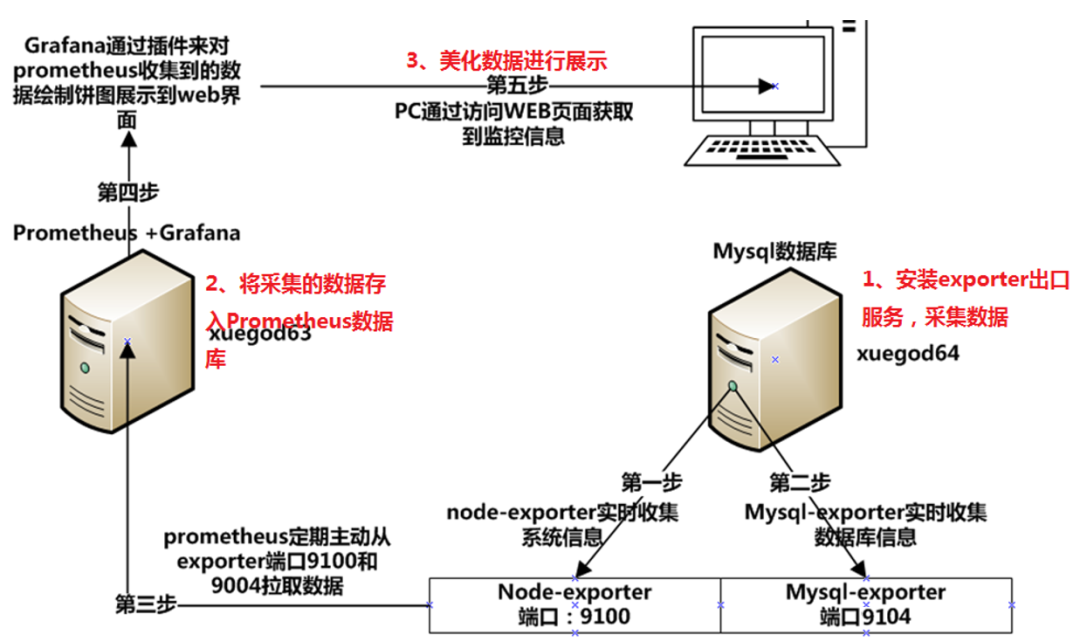
搭建Prometheus+Grafana的云平台监控系统工作流程:
1、安装exporter(出口)采集数据
2、美化采集到的数据
3、在web界面查看
懂:1不懂:2
1.2 安装配置Prometheus监控服务
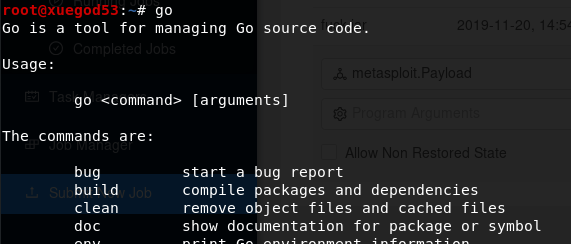
1、安装go语言环境
方法1:使用tar包安装go语言环境
上传到go1.13.3.linux-amd64.tar.gz到linux服务器上
或在线下载:
[root@xuegod63 ~][root@xuegod63 ~][root@xuegod63 ~][root@xuegod63 ~][root@xuegod63 ~]
方法2:使用yum安装go语言环境
[root@xuegod63 ~][root@xuegod63 ~][root@xuegod63 ~]
扩展:
Go(又称Golang)是Google开发的一种静态强类型、编译型、并发型,并具有垃圾回收功能的编程语言。
下载安装:
Prometheus(https://prometheus.io/download/)[root@xuegod63 ~][root@xuegod63 ~][root@xuegod63 ~]
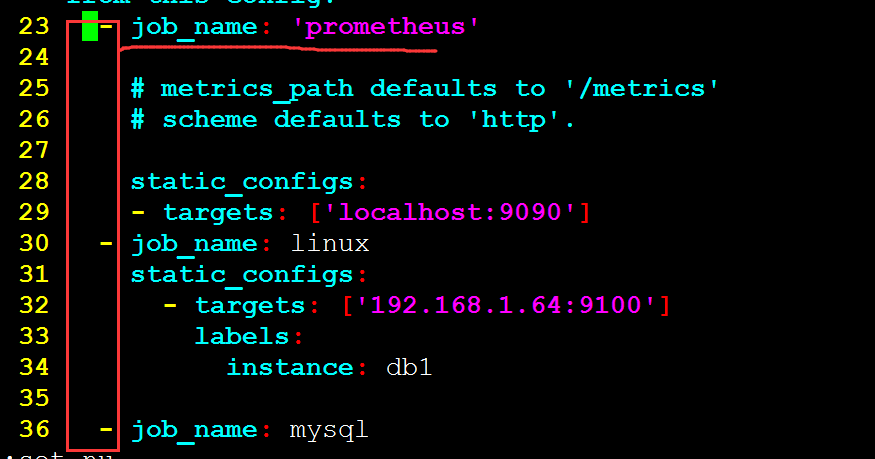
修改prometheus配置文件,配置监控linux主机和mysql数据库,配置文件为yml语法,注意缩进对齐
[root@xuegod63 prometheus-2.7.1.linux-amd64]# vim prometheus.yml #在文档的最后插入以下内容
- job_name: system-statusstatic_configs:- targets: ['192.168.1.64:9100']labels:instance: xuegod64- job_name: mysql-statusstatic_configs:- targets: ['192.168.1.64:9104']labels:instance: xuegod64-mysql
插入时,要和文件之前的job_name保持对齐,如下图:
注释:
- job_name: system-status #
每一个job_name都是一个监控项,这里代表监控操作系统状态
static_configs:
- targets: ['192.168.1.64:9100'] #
被监控主机IP地址和端口
labels:
instance: xuegod64 #
实例名称,在grafana中表示对应的主机。
- job_name: mysql-status #
监控mysql数据库状态
static_configs:
- targets: ['192.168.1.64:9104'] #
目标主机IP地址和端口
labels:
instance: xuegod64-mysql #
实例名称,在grafana中表示对应的主机。
[root@xuegod63prometheus-2.7.1.linux-amd64]# ./prometheus --config.file=prometheus.yml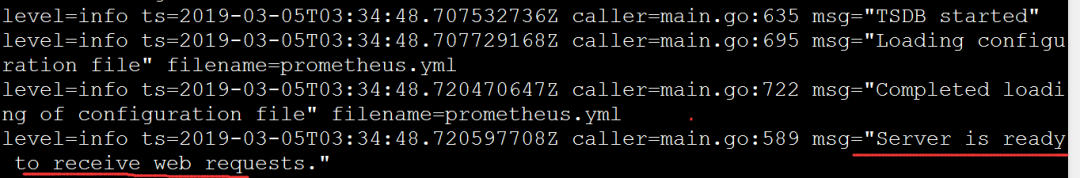
出现以下信息吧表示启动成功。
或直接后台运行:
[root@xuegod63prometheus-2.7.1.linux-amd64][root@xuegod63 ~]浏览器输入http://192.168.1.63:9090
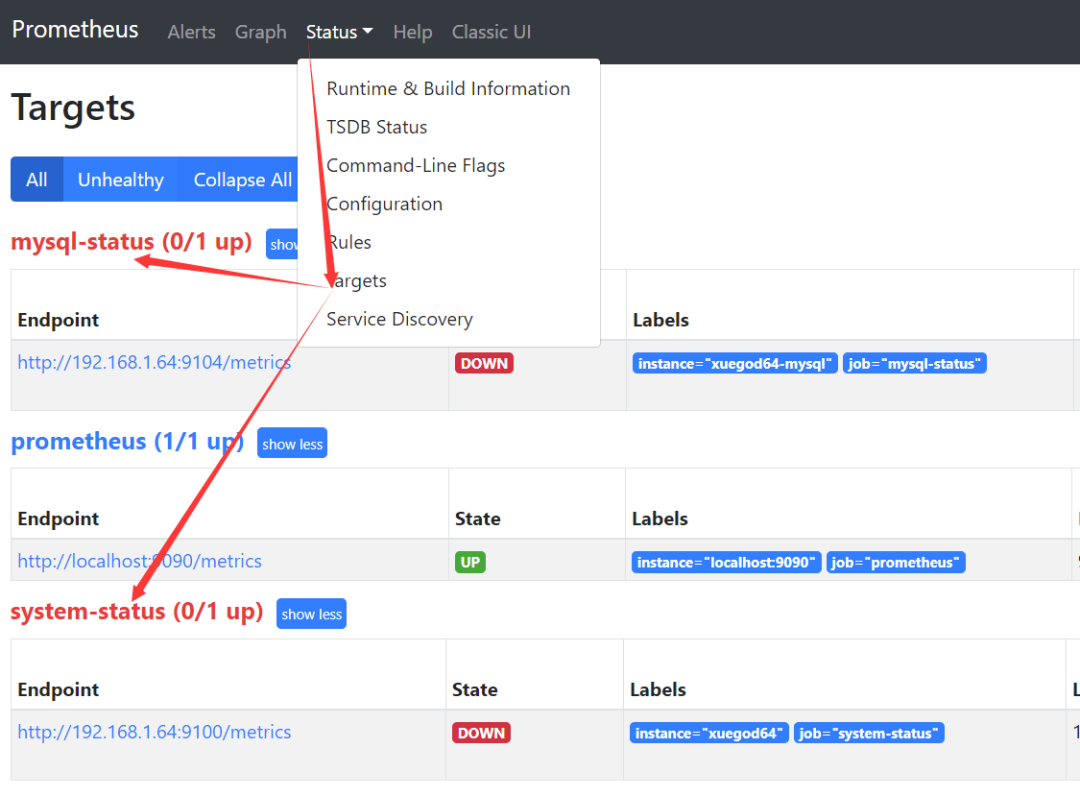
注:因为我们还没有开始配置xuegod64了,所以现在还获取不到xuegod64的信息
1.3 启动用于采集linux系统和mysql服务状态的exporter服务
prometheus常见的exporter及作用:
(1)、node_exporter用于监控操作系统的性能和运行状态
(2)、mysqld_exporter用于监控mysql服务
(3)、snmp_exporter用于监控网络设备
更多exporter可在官网下载:
https://prometheus.io/download/#node_exporter
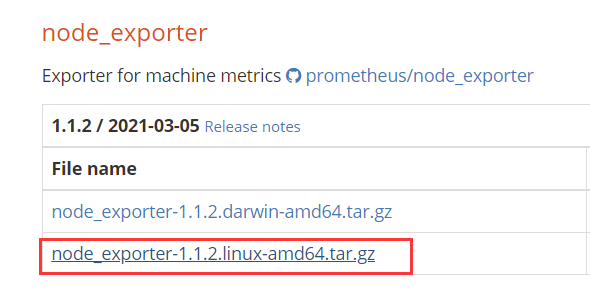
1、配置 node_exporter监控xuegod64运行状态
[root@xuegod64 ~]上传node_exporter-1.1.2.linux-amd64.tar.gz到linux上。[root@xuegod64 ~][root@xuegod64 ~]
2、配置mysqld_exporter用于监控xuegod64上的mysql服务
(1)、安装数据库服务
[root@xuegod64 ~][root@xuegod64 ~][root@xuegod64 ~]mysql> GRANT REPLICATION CLIENT,PROCESS ON *.* TO 'mysql_monitor'@'localhost' identified by '123456';mysql> GRANT SELECT ON *.* TO 'mysql_monitor'@'localhost';MariaDB [(none)]> exit;
注:mysql 用户权限说明:
(1)、replication client权限 #拥有此权限可以查询master server、slave server状态。
(2)、PROCESS权限 #通过这个权限,用户可以执行SHOW PROCESSLIST和KILL命令。默认情况下,每个用户都可以执行SHOW PROCESSLIST命令,但是只能查询本用户的进程。如:
mysql> show processlist;
另外,管理权限 process不能够指定某个数据库,on后面必须跟*.*
(3)、select权限 #必须有select的权限,才可以使用select * from table 查看数据
(2)、安装mysqld_exporter
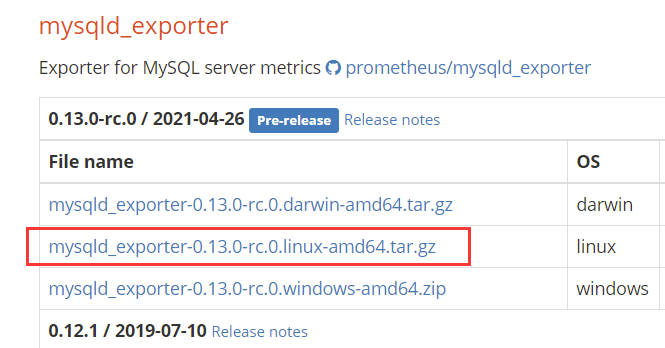
上传mysqld_exporter到linux系统上
[root@xuegod64 ~]创建隐藏配置文件.my.cnf,用于mysqld_exporter连接mysql采集数据。
[root@xuegod64 ~][client]user=mysql_monitorpassword= 123456[root@xuegod64 ~]
在web界面,再次查看监控信息已经成功添加linux 和mysql节点,已经up了
浏览器输入:
http://192.168.1.63:9090
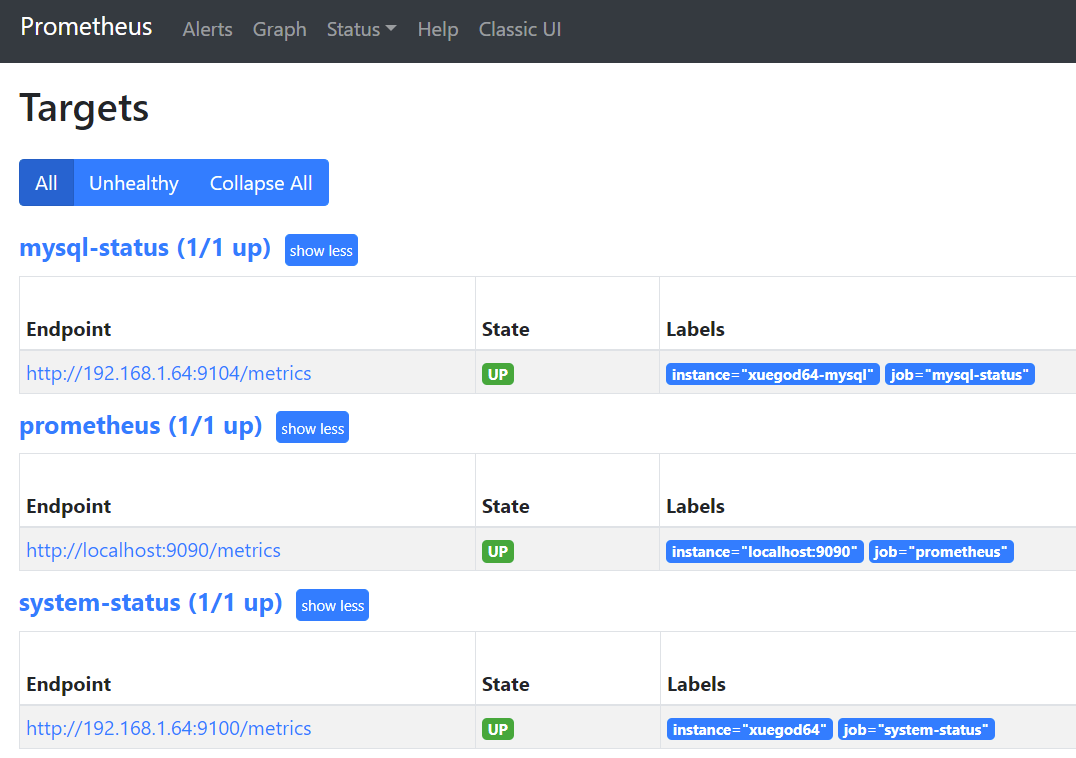
查看网络端口:
[root@xuegod64 ~]tcp6 0 0 :::9100 :::* LISTEN 2158/node_exportertcp6 0 0 :::9104 :::* LISTEN 41308/mysqld_export
总结prometheus使用方法:
1、想监控操作系统,只需要一步:
在被监控系统上安装node_exporter并启动,就ok了
2、想监控操mysql数据库,只需要两步:
(1)、创建一个mysql用户
(2)、安装mysqld_exporter并启动
1.4 实战-使用Grafana可视化工具美化监控数据显示效果
1.4.1 配置grafana
1、上传grafana到linux系统/root/下
[root@xuegod63 ~]或在线下载:[root@xuegod64 ~]
2、安装图形饼状图插件,方便显示饼状图
方法1:离线安装
下载:
https://grafana.com/api/plugins/grafana-piechart-panel/versions/1.6.1/download
然后上传grafana-piechart-panel-1.6.1.zip到linux系统上
[root@xuegod63 ~][root@xuegod63 ~][root@xuegod63 ~][root@xuegod63 ~]
方法2:在线安装
[root@xuegod63 ~][root@xuegod63 ~]
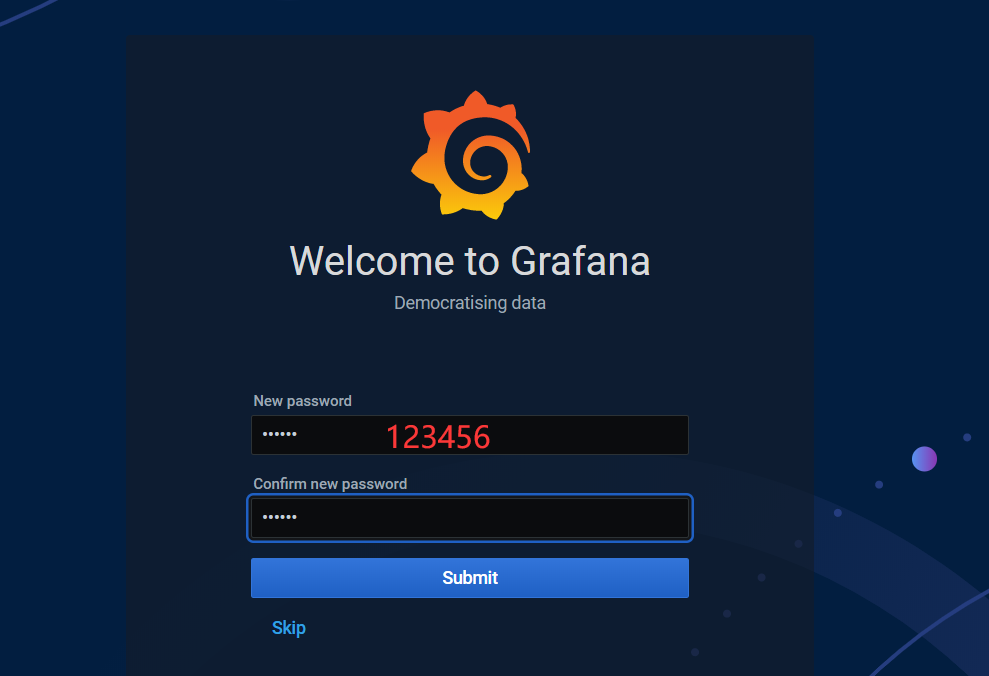
3、访问:
http://192.168.1.63:3000/login
用户名:admin密码admin

第一次登陆会提示修改密码,咱们改成123456
配置数据源
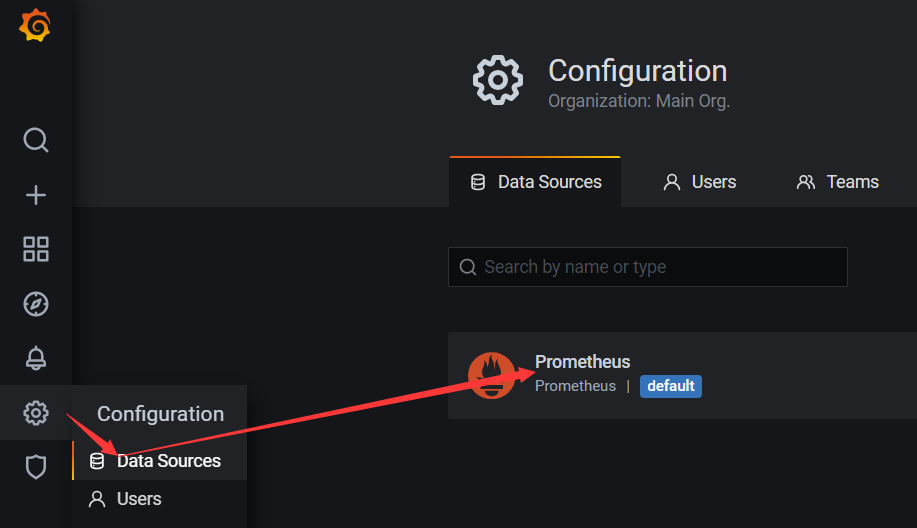
url地址:http://192.168.1.63:9090
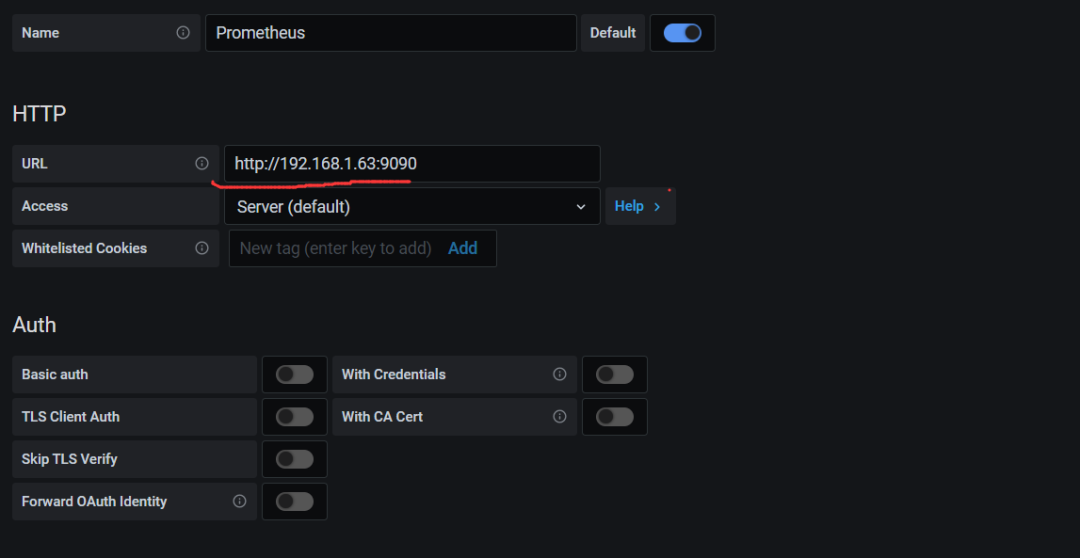
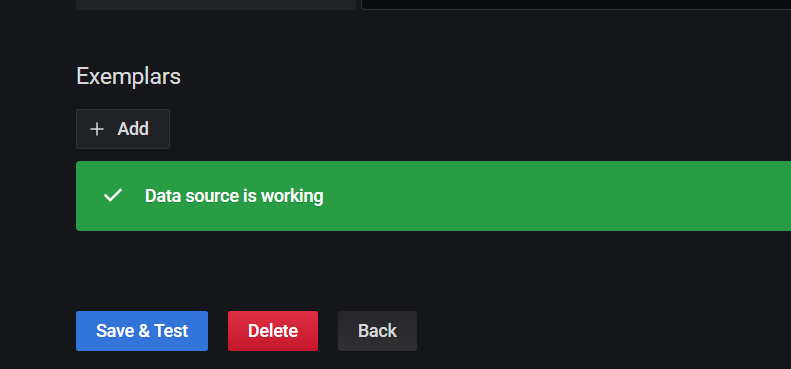
在页面最下面,点:Save & Test
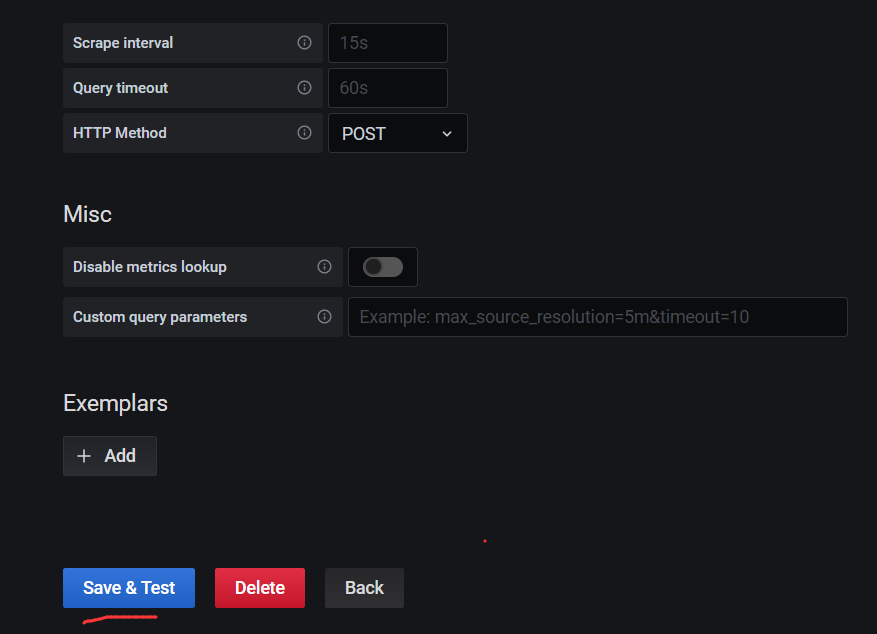
Scrape [skreɪp] 刮擦 ;
interval [ˈɪntəvl] 间隔;
Scrape interval 抓取数据间隔
弹出下面信息,说明成功了
1.4.2 将监控Linux系统和mysql服务运行状态的web仪表盘插件导入grafana
1、查找可以美化Linux系统监控数据的仪表盘插件
打开官方网站:
https://grafana.com/grafana/dashboards
在页面中找到这个:
https://grafana.com/grafana/dashboards?search=node
输入关键字node,进行查询,查看自已想要的展示看板:
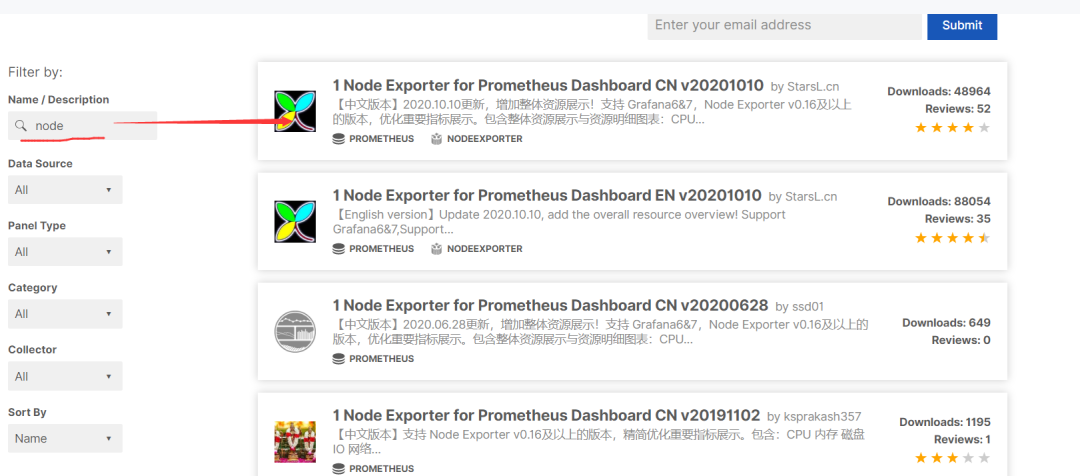
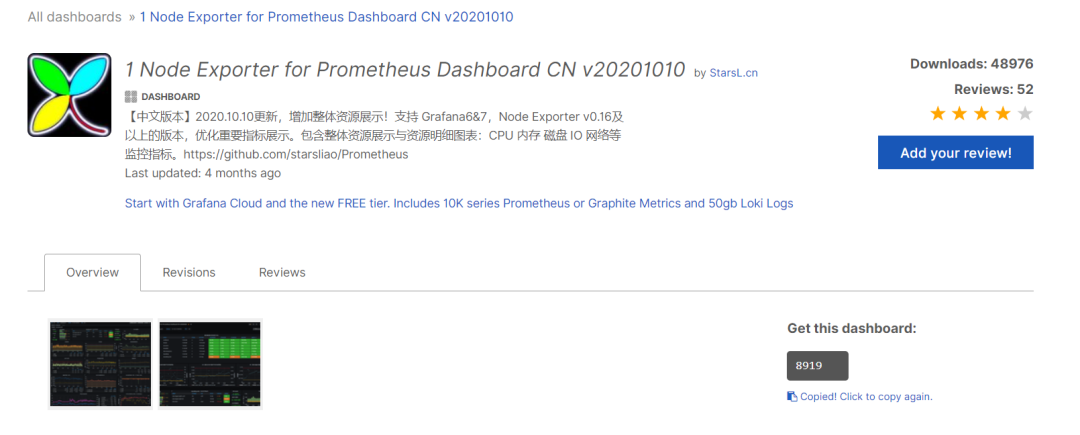
我使用们这个ID:8919
打开这个链接:
https://grafana.com/grafana/dashboards/8919
也可以直接下载JSON文件,然后后期,直接导入这个离线文件:
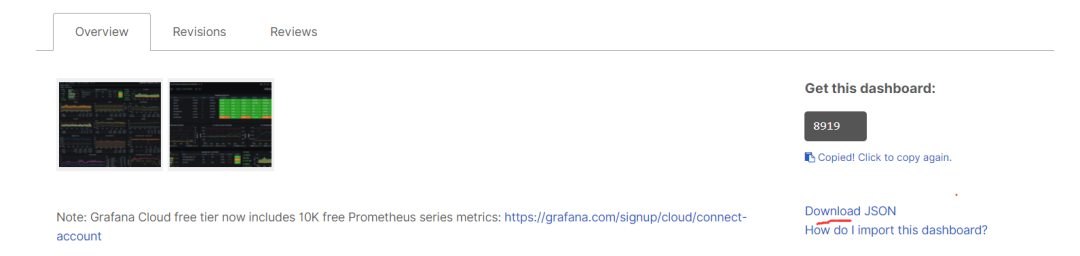
ID号是: 8919。 注: 如果在线导入的看板,看不到数据,可以换一个ID号,再试试。
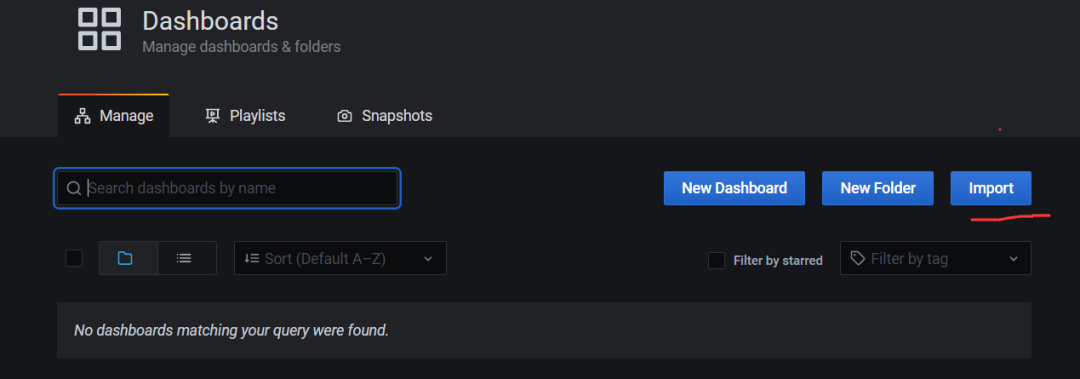
开始导入:
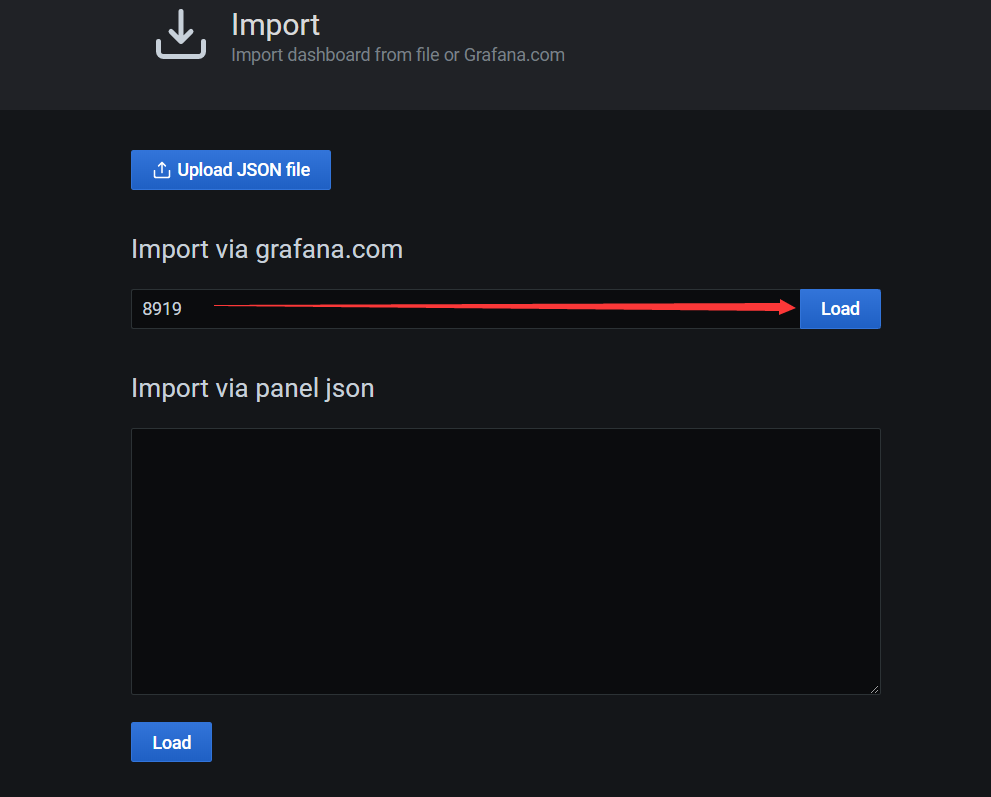
点load,
刷新浏览器界面:
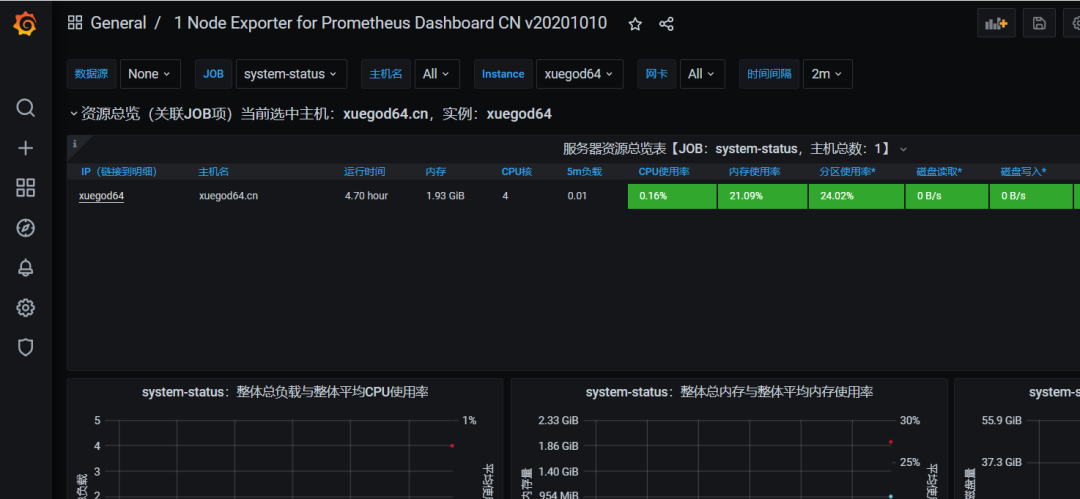
注:也可以导入之前下载的
node-exporter-for-prometheus-dashboard-cn-v20201010_rev24.json离线文件上传。
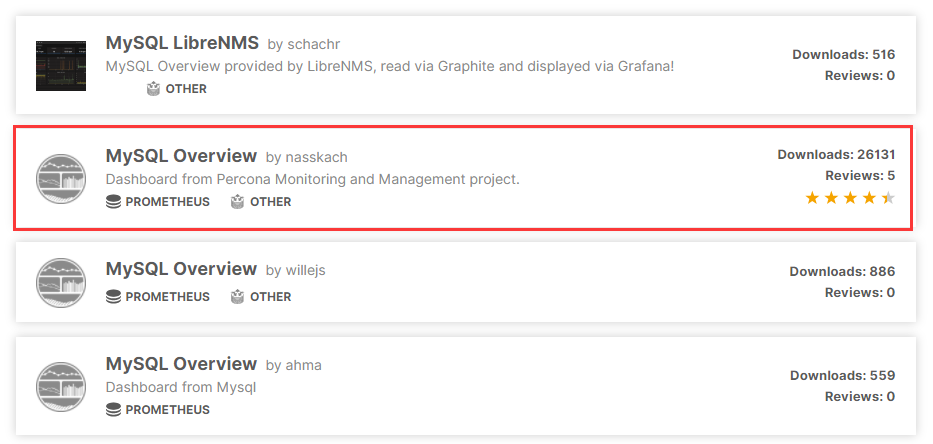
2、查出mysql的 Web仪表盘插件的ID号
打开此链接可直接搜索到与课程对应版本的仪表盘
https://grafana.com/grafana/dashboards?search=mysql%20overview&utm_source=grafana_search然后选择这个由nasskach开发的界面
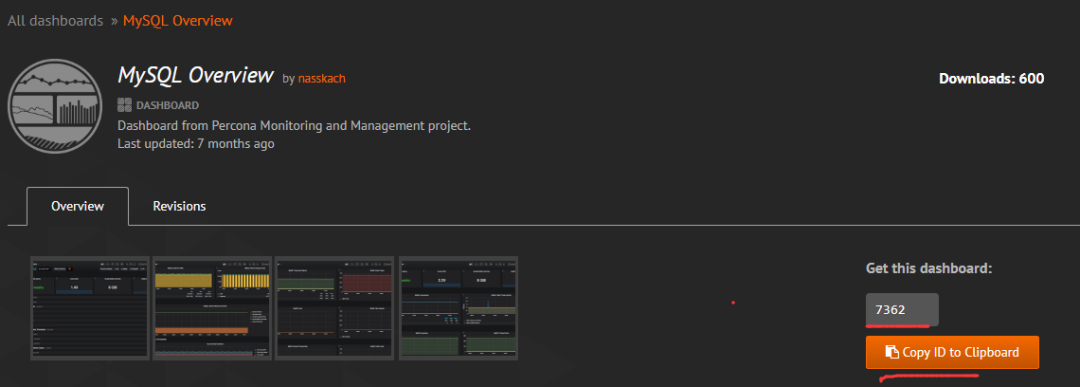
打开链接:
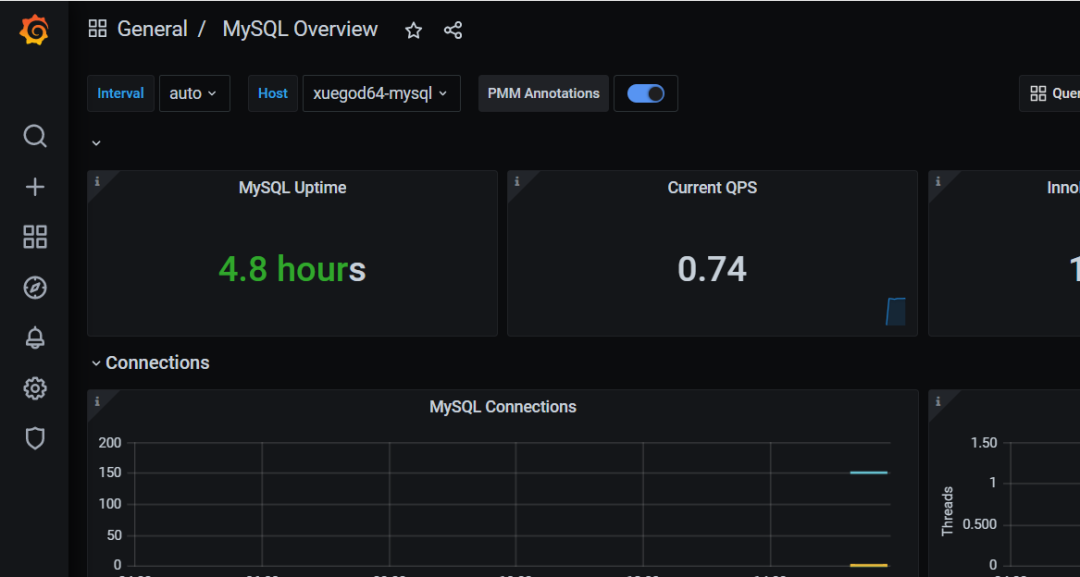
https://grafana.com/grafana/dashboards/7362
复制7362 的ID
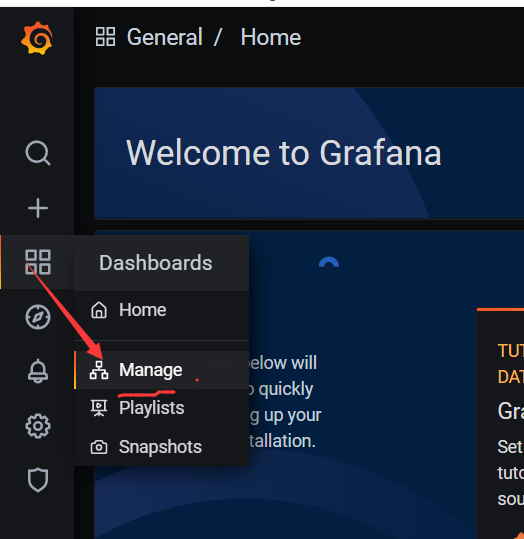
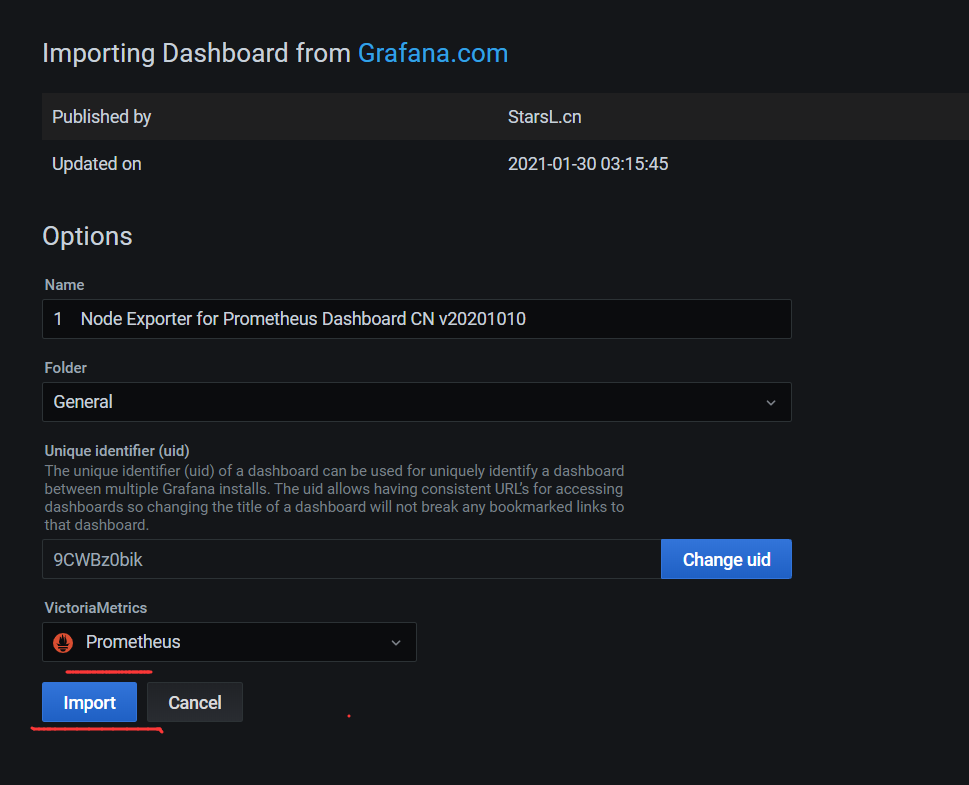
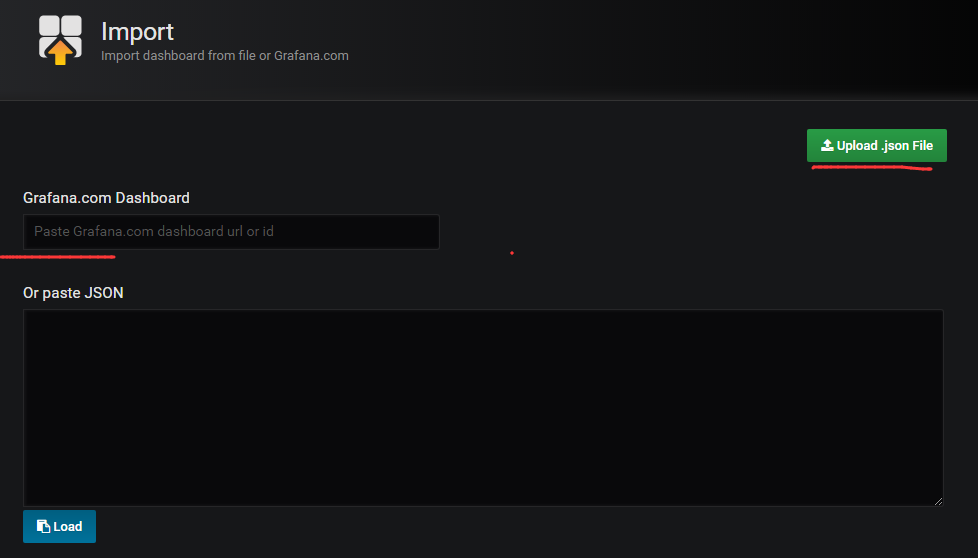
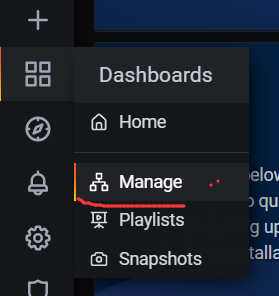
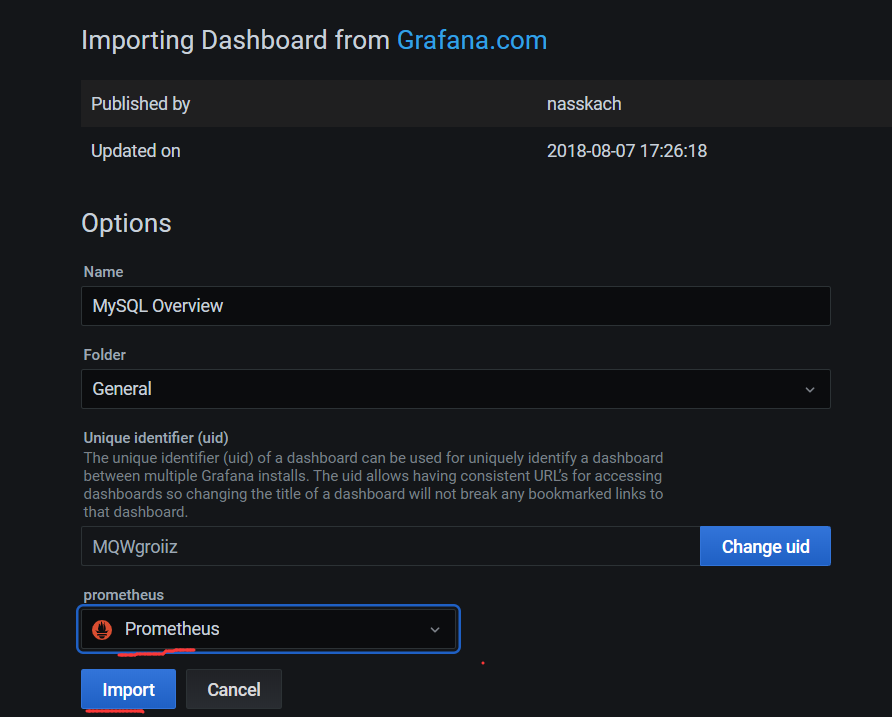
来到grafana主界面,导入dashboard:


下拉选择Prometheus
1.5 实战-Grafana配置邮件告警
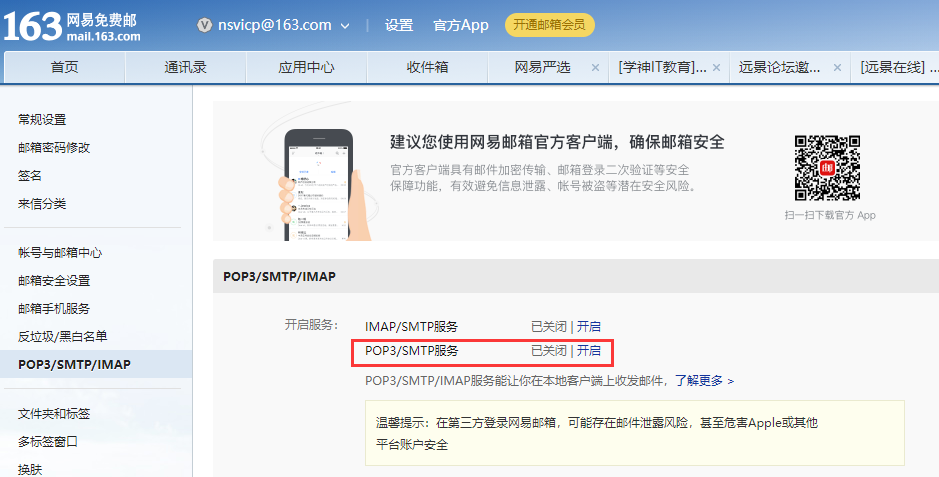
1.5.1 配置SMTP发送邮件
配置163邮箱smtp服务
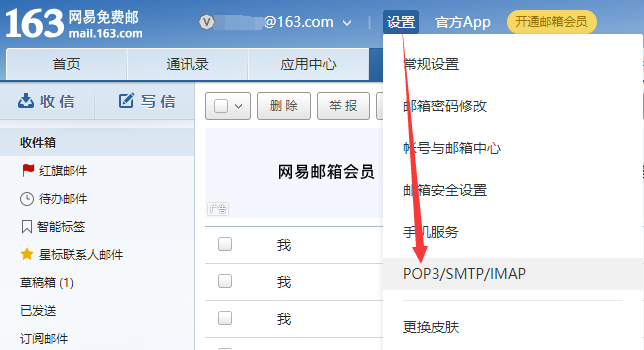
点击开启SMTP服务,点击开启后会提示我们下载手机APP,我们点继续开启不需要下载APP。
根据提示发送手机验证码即可开启成功
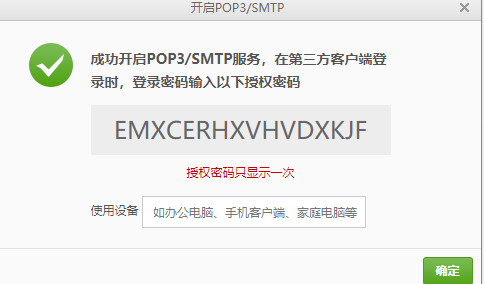
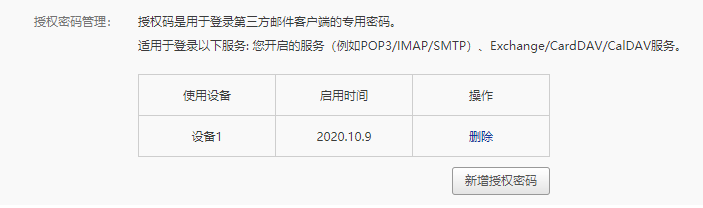
EMXCERHXVHVDXKJF
开启成功后会新增授权密码管理的选项,如果你之前已经开启过,直接点击新增授权密码即可。
Grafana配置SMTP账户
[root@xuegod63 ~]第522行修改smtp配置
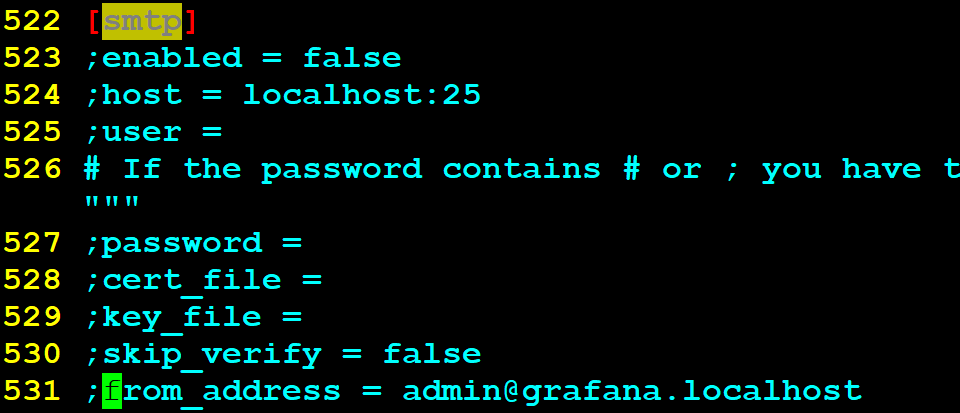
注:所有修改配置前 ; 注释符号需要取消,将对应行,改为以下内容:
[smtp]enabled = true #启用smtphost = smtp.163.com:465 #163 smtp服务地址user = jianmingbasic@163.com #163邮箱用户名# If the password containspassword = EMXCERHXVHVDXKJF #授权密码; cert_file =; key_file =; skip_verify = falsefrom_address = jianmingbasic@163.com #邮件From地址,和登录用户一致即可。;from_name = Grafana; ehlo_identity =
修改完邮件配置后修改domain信息,邮件内容中包含Grafana的访问地址,默认地址为localhost。
改:
41 ;domain = localhost
为:
41 domain = 192.168.1.63
1.5.2 配置图片渲染功能
配置插件地址
改:
813 ;server_url =
为:
813 server_url = http://192.168.1.63:8081/render
配置callback_url,该地址为Grafana地址。
改:
815 ;callback_url =
815 callback_url =
http://192.168.1.63:3000/
修改默认语言,默认配置渲染图片时不支持中文。
改:
840 ;rendering_language =
为:
840 rendering_language = zh
安装图片渲染插件(经测试仅docker方式搭建的插件支持中文渲染)
安装docker环境
[root@xuegod63 ~]配置国内docker的yum源(阿里云)[root@xuegod63 ~]安装docker-ce[root@xuegod63 ~][root@xuegod63 ~][root@xuegod63 ~][root@xuegod63 ~]{"registry-mirrors":["https://rsbud4vc.mirror.aliyuncs.com","https://registry.docker-cn.com","https://docker.mirrors.ustc.edu.cn","https://dockerhub.azk8s.cn","http://hub-mirror.c.163.com","http://qtid6917.mirror.aliyuncs.com","https://rncxm540.mirror.aliyuncs.com","https://e9yneuy4.mirror.aliyuncs.com"]}EOF[root@xuegod63 ~][root@xuegod63 ~]运行docker版本的图片渲染插件上传课程资料中的grafana-image-renderer.tar.gz[root@xuegod63 ~][root@xuegod63 ~]重启Grafana使配置生效[root@xuegod63 ~]
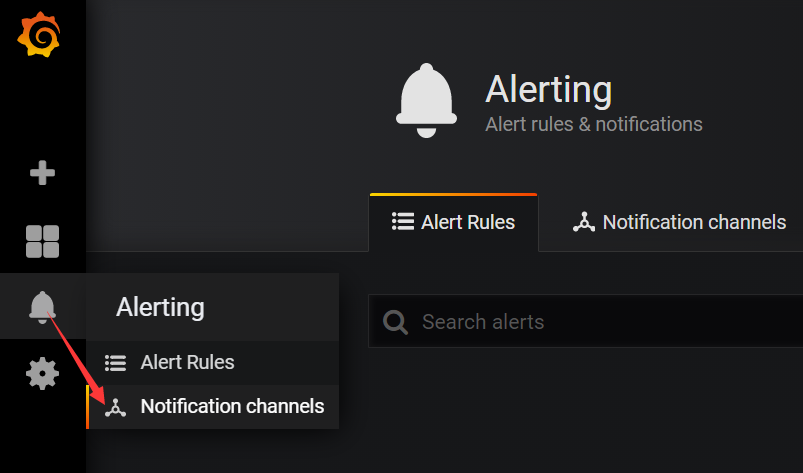
检查邮件服务是否配置成功,添加告警频道。
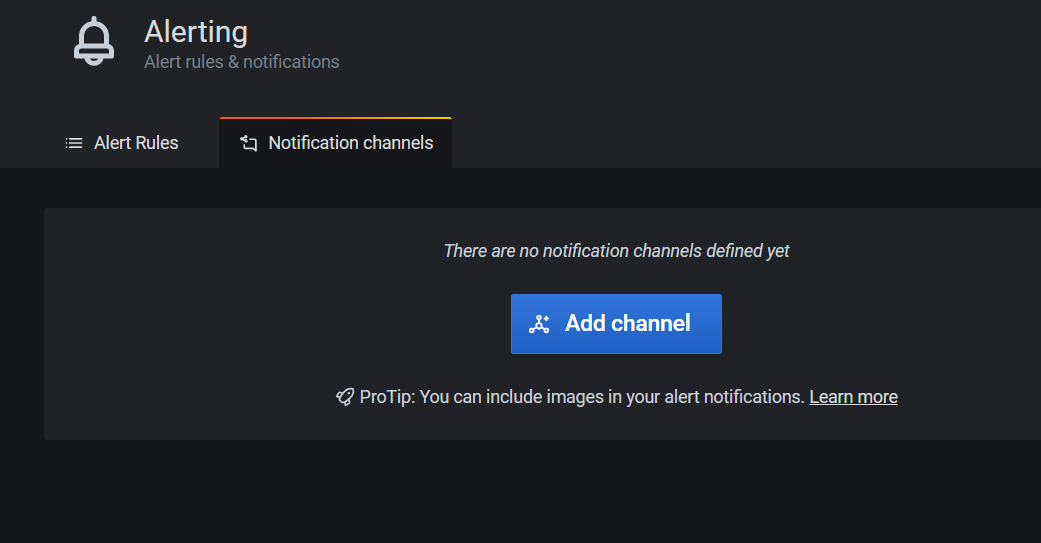
取任意名称,选择Email发送,填写收件人地址即可发送测试邮件。Include image需要手动勾选,这样发送邮件时才会附带监控图表信息。新版本中默认不勾选,因为需要安装插件。
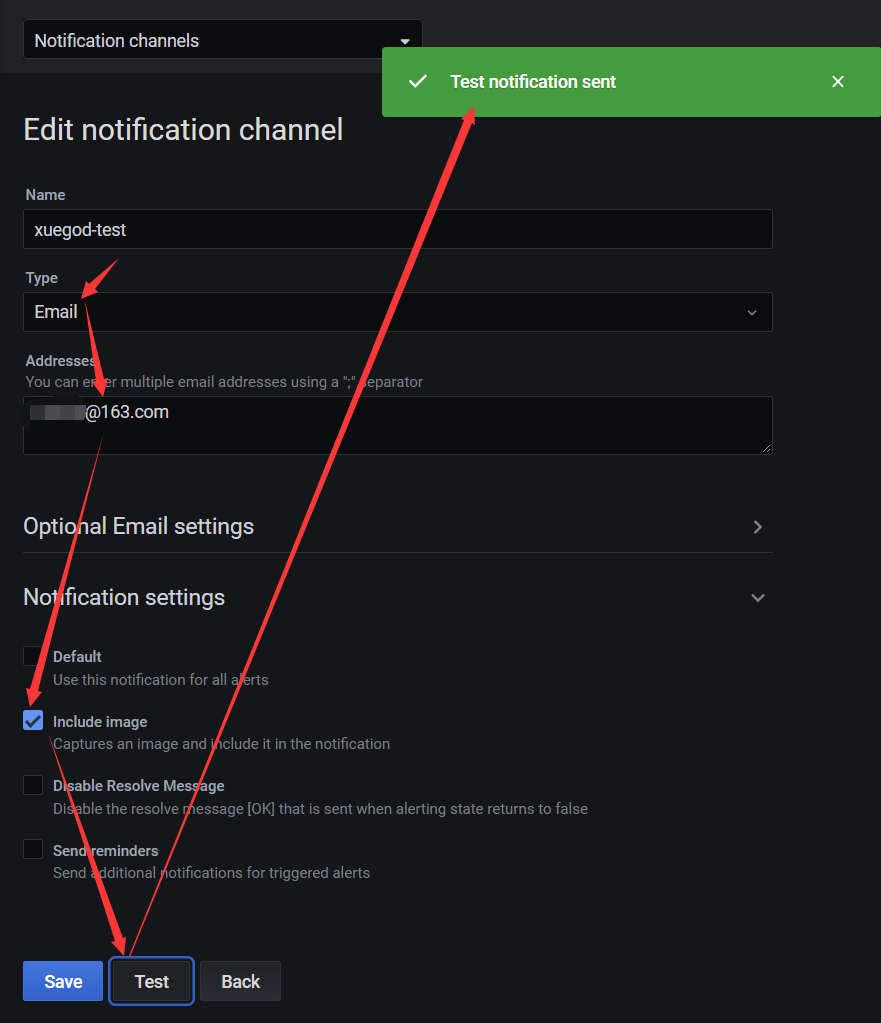
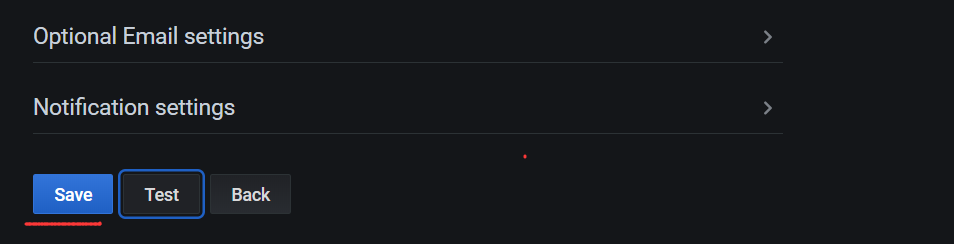
测试成功后点击保存即可。
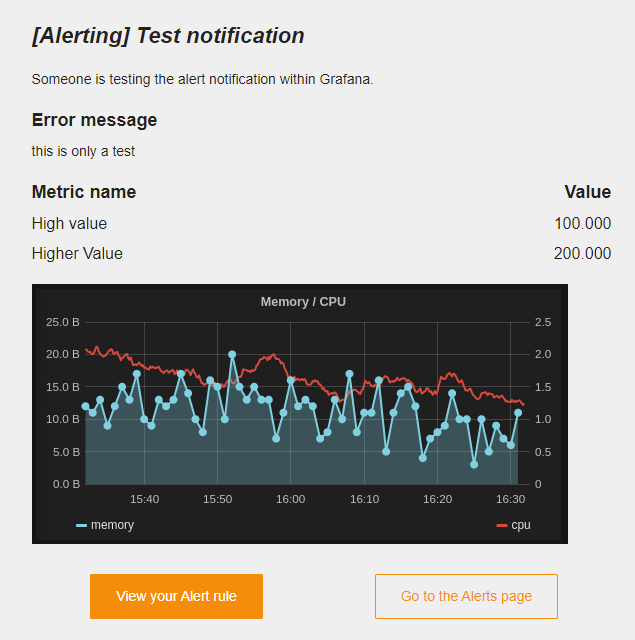
收到Grafana邮件
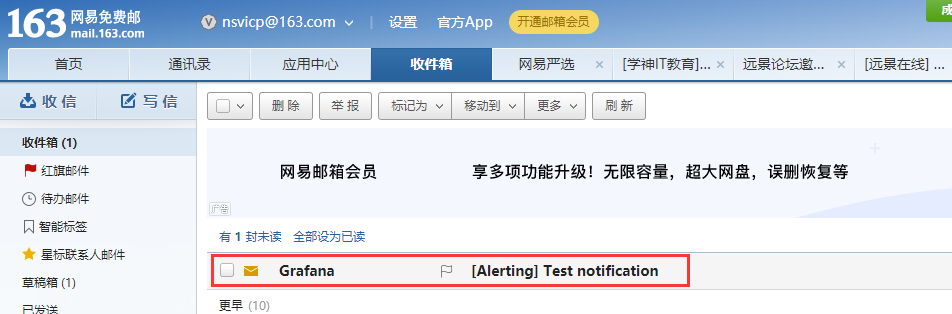
内容是测试信息
1.5.3 自定义监控项与告警规则
配置告警,回到仪表盘进行操作。
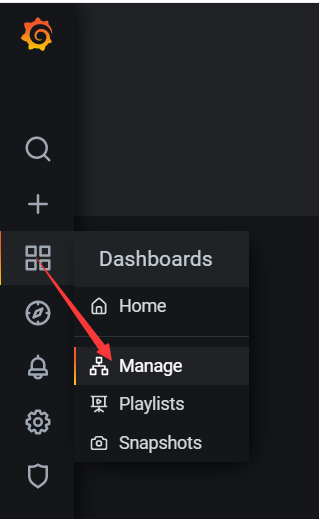
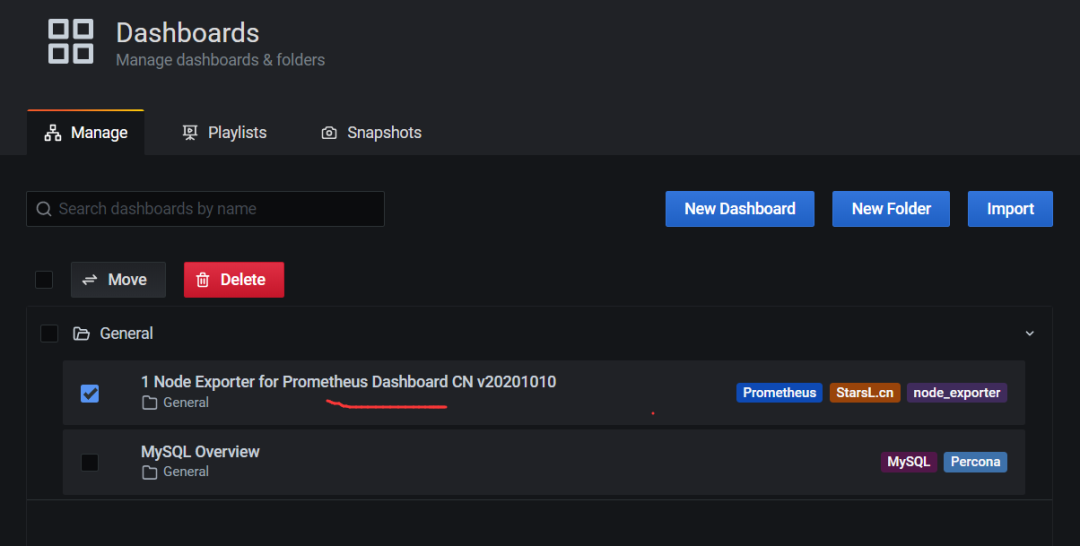
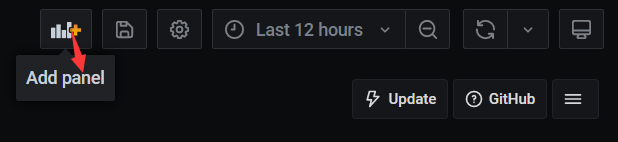
添加panel
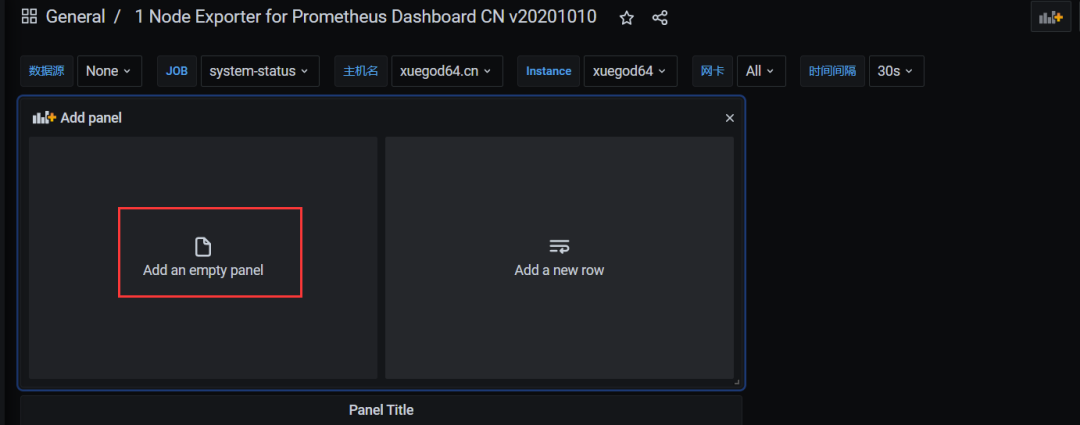
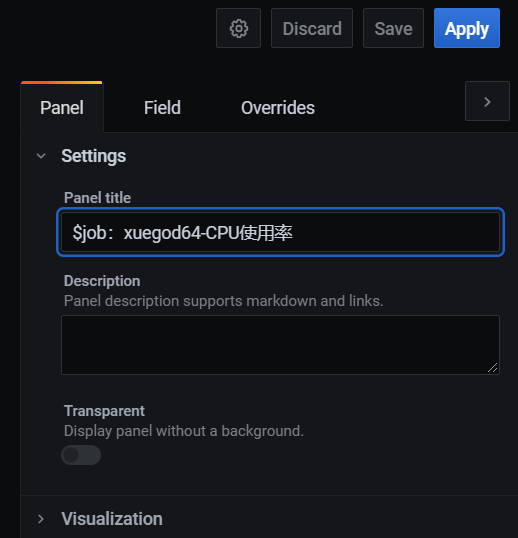
修改一个新的标题
Panel title: xuegod64-CPU使用率
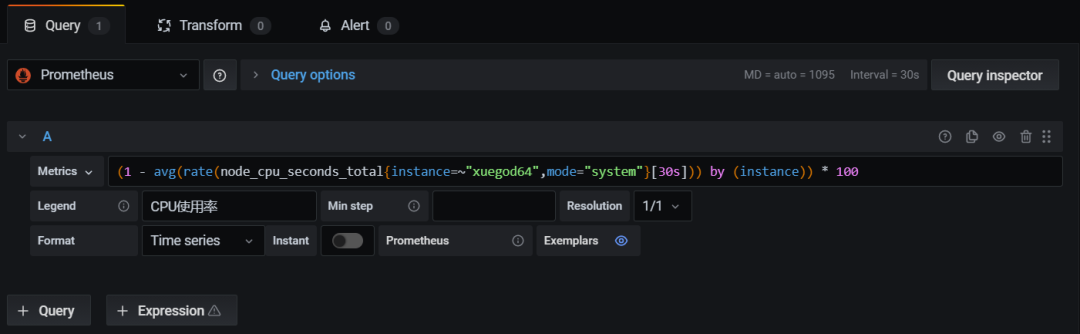
修改监控项配置。删除监控项。保留user配置即可。因为我们手工测试只能测试到User监控项。删除AFDC保留B
metrics [ˈmetrɪks] 衡量指标
Metrics: (1 - avg(rate(node_cpu_seconds_total{instance=~"xuegod64",mode="idle"}[30s])) by (instance)) * 100Legend: CPU使用率注:idle表示总负载,system表示系统使用率,user表示用户使用率。
只留这个监控项参数
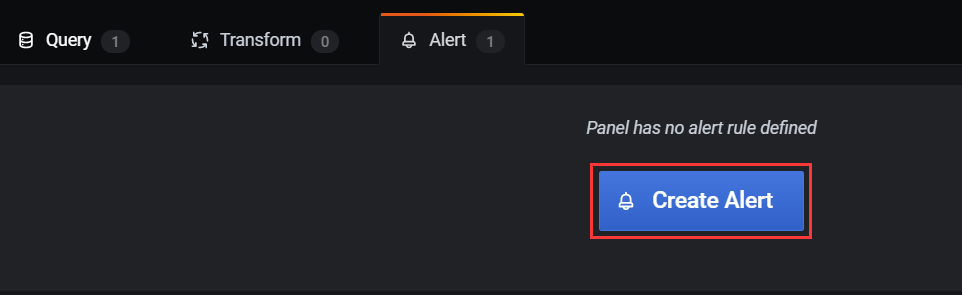
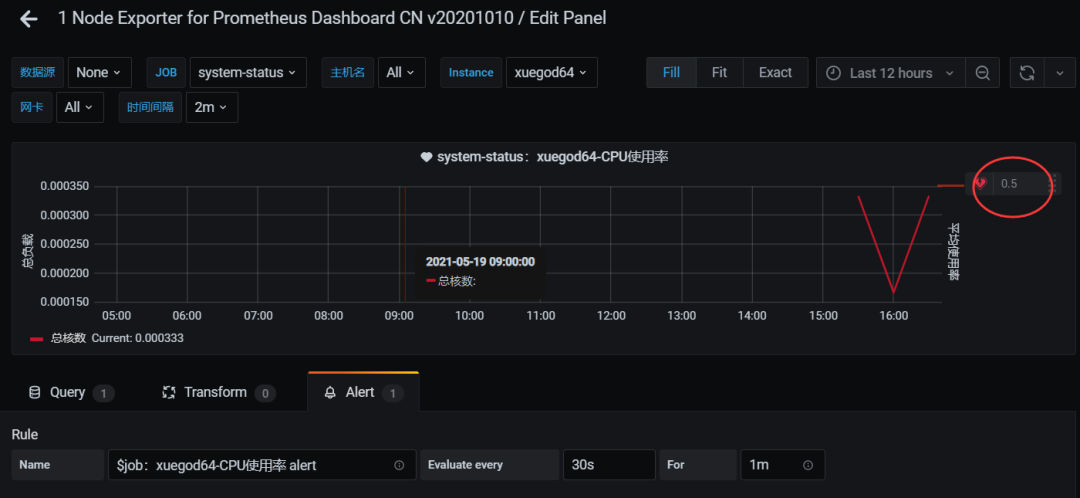
添加告警
配置告警规则。
xuegod64-cpu使用率报警
随便输出点告警描述信息:
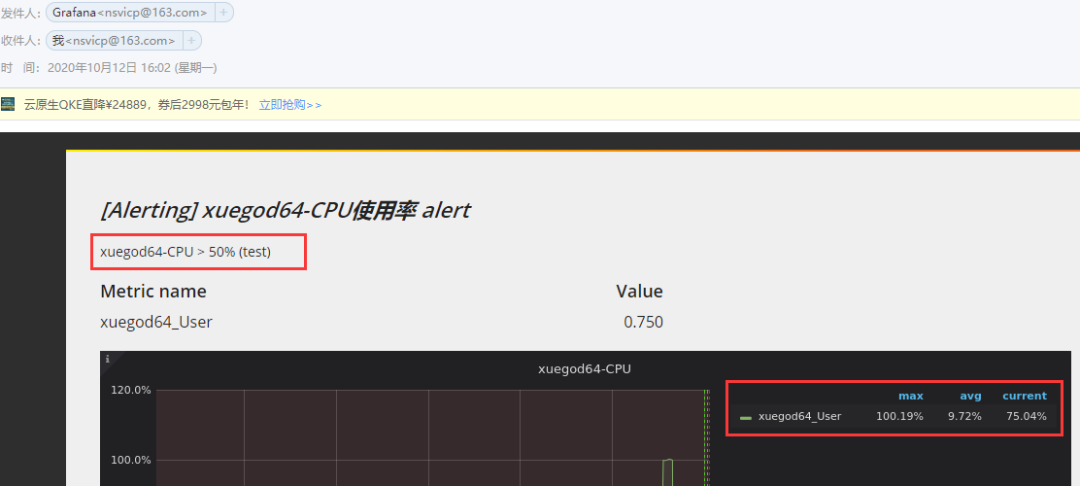
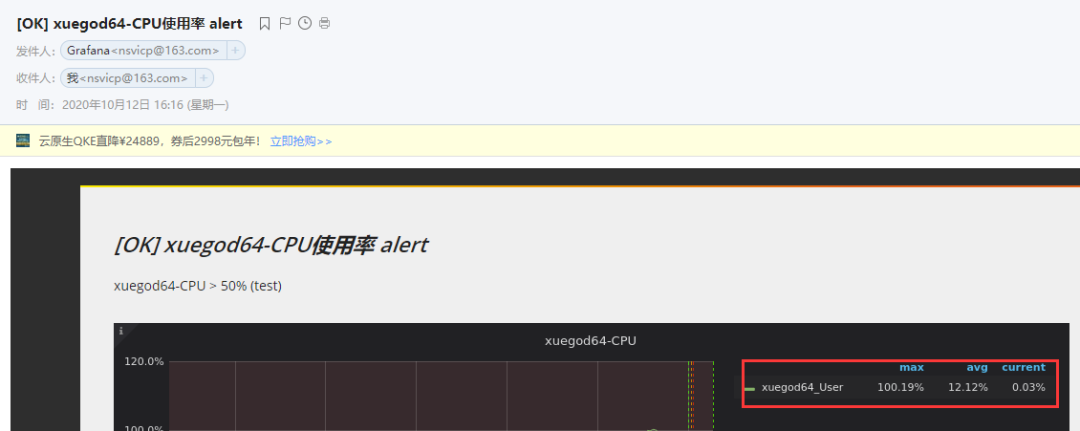
xuegod64-CPU > 50% (test)
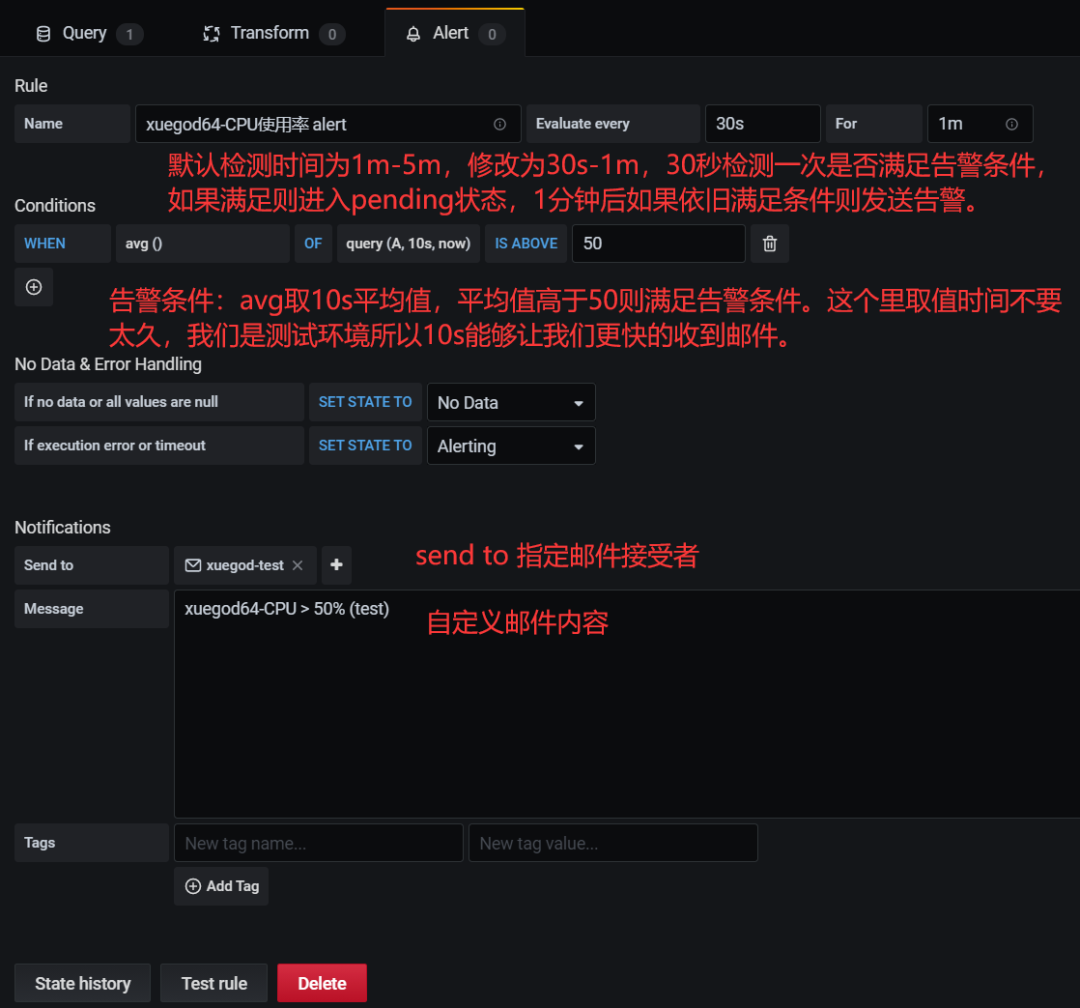
注:query查询的时间默认是5分钟的平均数据,如果想快速触发报警可以时间缩短至1m。0.5=50%
保存配置,点击按钮
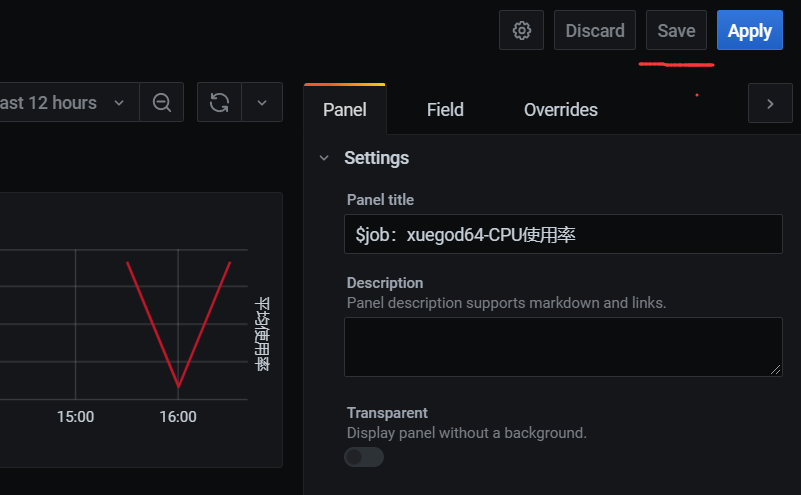
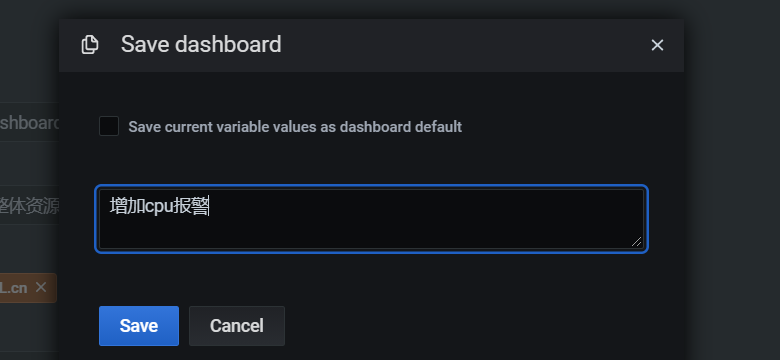
点击save保存即可
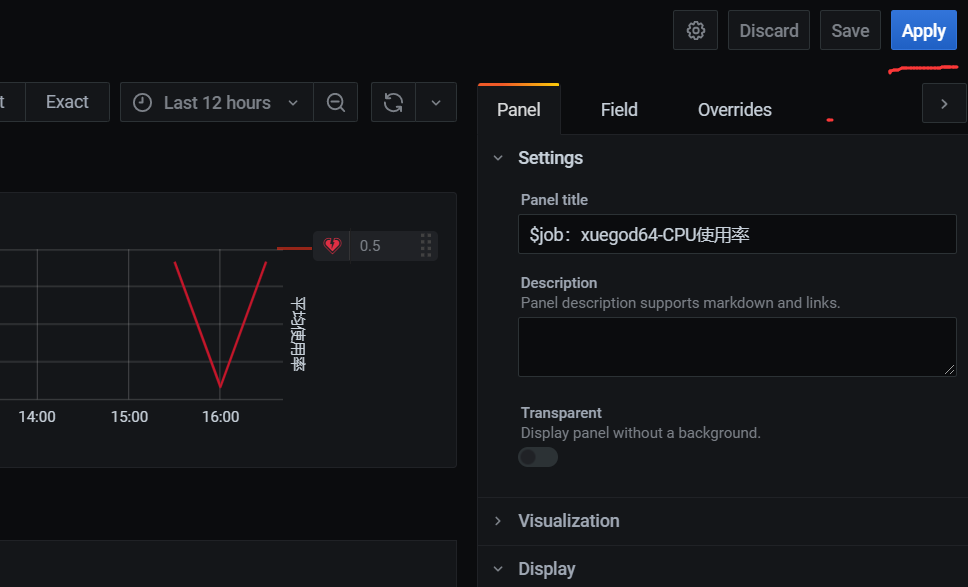
可以看到这里有这个标识:
应用一下:
1.5.4 压力测试触发告警
安装压力测试工具
[root@xuegod64 ~][root@xuegod64 ~]
对CPU进行压力测试。注:教学环境中xuegod64分配了8核心CPU,我们的监控指标配置的是超过50%告警,则需要将超过半数的CPU资源耗尽,所以-c参数大于虚拟机中CPU核心数量的一半即可,同学们根据自己学习环境进行调整。
[root@xuegod64 ~]# stress -c 6
新建终端窗口使用top命令查看系统负载
[root@xuegod64 ~]# top
已经创建了6个占用CPU100%的进程。
查看状态信息,可以看到pending和发送邮件间隔了1分钟。
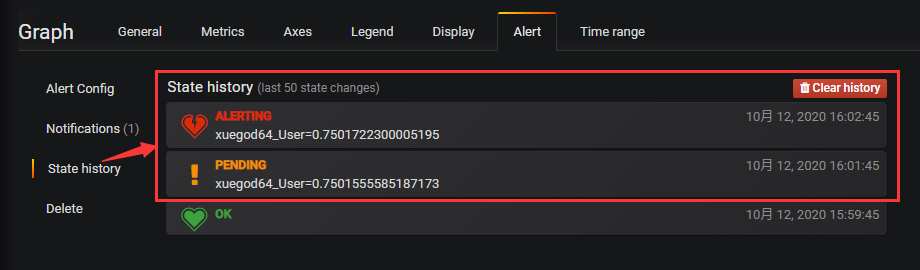
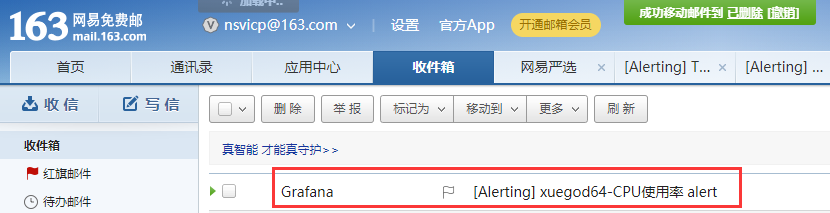
查看邮箱
邮件中可以看到监控指标数据
Ctrl+C关闭压力测试工具

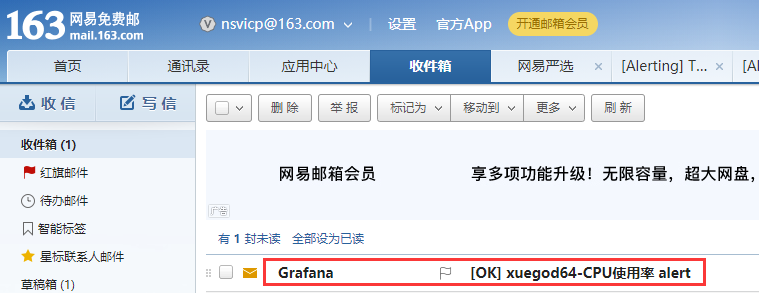
等待平均负载指标下来后就会收到恢复邮件。
-------- THE END --------