
安利一个Python大数据分析神器!


conda install dask
conda install dask-core
git clone https://github.com/dask/dask.git
cd dask
python -m pip install .
import dask.array as da
x = da.random.uniform(low=0, high=10, size=(10000, 10000),  # normal numpy code
                      chunks=(1000, 1000))  # break into chunks of size 1000x1000

y = x + x.T - x.mean(axis=0)  # Use normal syntax for high level algorithms

# DataFrames
import dask.dataframe as dd
df = dd.read_csv('2018-*-*.csv', parse_dates='timestamp',  # normal Pandas code
                 blocksize=64000000)  # break text into 64MB chunks

s = df.groupby('name').balance.mean()  # Use normal syntax for high level algorithms

# Bags / lists
import dask.bag as db
b = db.read_text('*.json').map(json.loads)
total = (b.filter(lambda d: d['name'] == 'Alice')
          .map(lambda d: d['balance'])
          .sum())
def inc(x):
    return x + 1

def double(x):
    return x * 2

def add(x, y):
    return x + y

data = [1, 2, 3, 4, 5]

output = []
for x in data:
    a = inc(x)
    b = double(x)
    c = add(a, b)
    output.append(c)

total = sum(output)
45
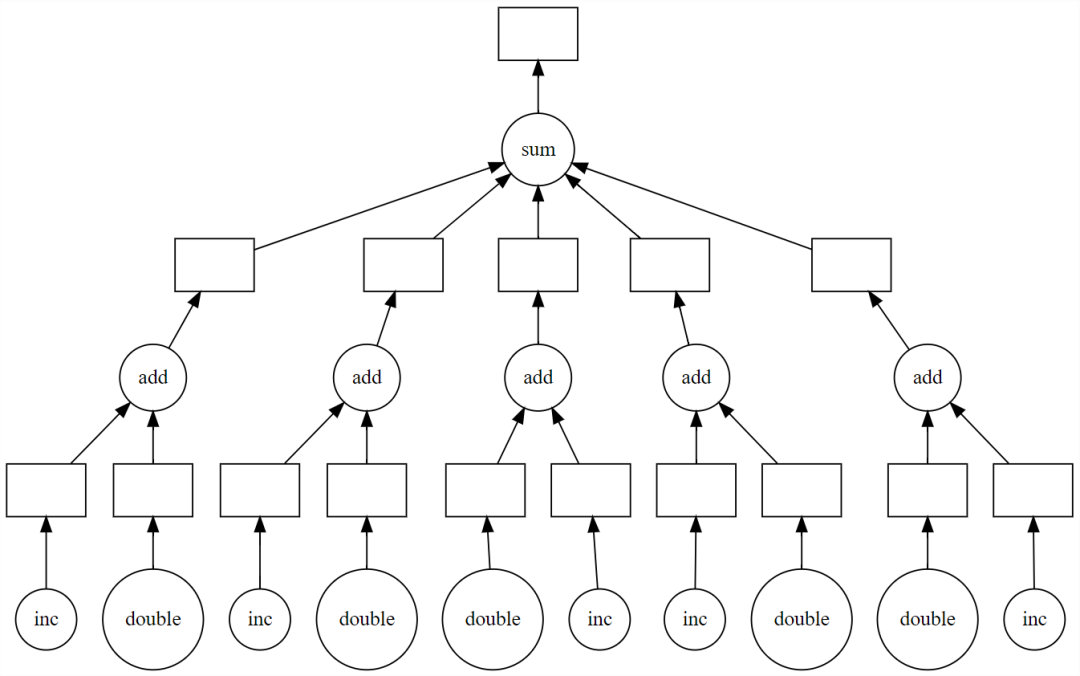
import dask

output = []
for x in data:
    a = dask.delayed(inc)(x)
    b = dask.delayed(double)(x)
    c = dask.delayed(add)(a, b)
    output.append(c)

total = dask.delayed(sum)(output)
total.visualize()
>>> total.compute()
45
# from sklearn.grid_search import GridSearchCV
  from dklearn.grid_search import GridSearchCV
# from sklearn.pipeline import Pipeline
  from dklearn.pipeline import Pipeline
from sklearn.datasets import make_classification

X, y = make_classification(n_samples=10000,
                           n_features=500,
                           n_classes=2,
                           n_redundant=250,
                           random_state=42)

from sklearn import linear_model, decomposition
from sklearn.pipeline import Pipeline
from dklearn.pipeline import Pipeline

logistic = linear_model.LogisticRegression()
pca = decomposition.PCA()
pipe = Pipeline(steps=[('pca', pca),
                       ('logistic', logistic)])


grid = dict(pca__n_components=[50, 100, 150, 250],
            logistic__C=[1e-4, 1.0, 10, 1e4],
            logistic__penalty=['l1', 'l2'])

# from sklearn.grid_search import GridSearchCV
from dklearn.grid_search import GridSearchCV

estimator = GridSearchCV(pipe, grid)

estimator.fit(X, y)
from dask.distributed import Client
c = Client('scheduler-address:8786')
评论