
【Node.js】如何调试你的 Node.js 代码?
很多时候,我苦恼于 Node.js 的调试,只会使用 console.log 这种带有侵入性的方法,但是其实 Node.js 也可以做到跟浏览器调试一样的方便。
本文环境:
mac
Chrome 94.0.4606.81
node v12.12.0
vscode Version: 1.61.1
本文示例
本文示例采用的是之前探索洋葱模型的,仅有一个文件,就是根目录下 index.js,如下:
const Koa = require('koa');

const app = new Koa();
console.log('test')

// 中间件1
app.use((ctx, next) => {
  console.log(1);
  next();
  console.log(2);
});

// 中间件 2
app.use((ctx, next) => {
  console.log(3);
  next();
  console.log(4);
});

app.listen(9000, () => {
    console.log(`Server is starting`);
});
V8 Inspector Protocol + Chrome DevTools
v8 Inspector Protocol 是 nodejs v6.3 新加入的调试协议,通过 websocket与 Client/IDE 交互,同时基于 Chrome/Chromium 浏览器的 devtools 提供了图形化的调试界面。
我们进入项目根目录,执行(留意这个 8888 端口,后面会用到):
node --inspect=8888 index.js
结果如下:
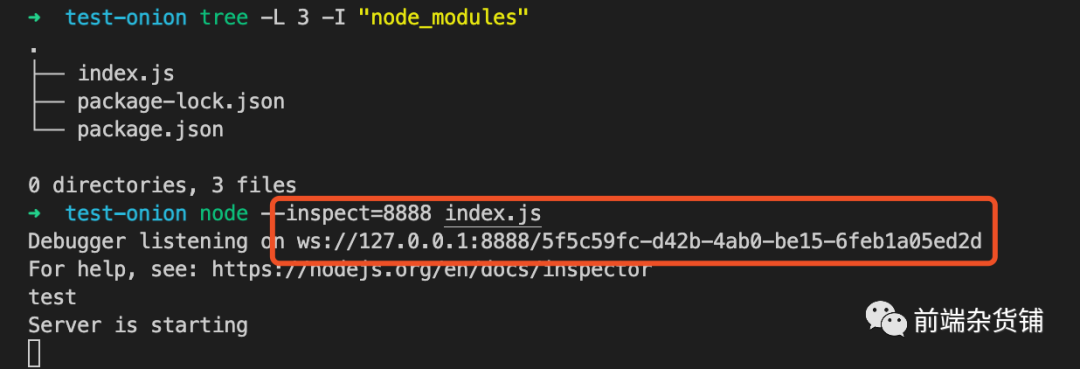
结果出来一个链接——ws://127.0.0.1:8888/5f5c59fc-d42b-4ab0-be15-6feb1a05ed2d。这个链接是 Node.js 和 Chrome 之前通信的 websocket 地址,通过 websocket 通信,我们可以在 Chrome 中实时看到 Node.js 的结果。
如何进入 Chrome 的调试界面
第一种方式(自己尝试无效)
打开 http://localhost:8888/json/list,其中 8888 是上面 --inspect 的参数。
[
    {
        "description": "node.js instance",
        "devtoolsFrontendUrl": "chrome-devtools://devtools/bundled/js_app.html?experiments=true&v8only=true&ws=localhost:8888/5f5c59fc-d42b-4ab0-be15-6feb1a05ed2d",
        "devtoolsFrontendUrlCompat": "chrome-devtools://devtools/bundled/inspector.html?experiments=true&v8only=true&ws=localhost:8888/5f5c59fc-d42b-4ab0-be15-6feb1a05ed2d",
        "faviconUrl": "https://nodejs.org/static/images/favicons/favicon.ico",
        "id": "5f5c59fc-d42b-4ab0-be15-6feb1a05ed2d",
        "title": "index.js",
        "type": "node",
        "url": "file:///Users/gpingfeng/Documents/Personal/Test/test-onion/index.js",
        "webSocketDebuggerUrl": "ws://localhost:8888/5f5c59fc-d42b-4ab0-be15-6feb1a05ed2d"
    }
]
很多资料说,可以通过 devtoolsFrontendUrl 就可以直接访问到,但尝试了一下,并没有成功。【可能跟我的环境有关】
第二种方式
查了一下资料,在 stackoverflow[1] 找到对应的方案,如下:
devtools://devtools/bundled/inspector.html?experiments=true&ws=127.0.0.1:8888/5f5c59fc-d42b-4ab0-be15-6feb1a05ed2d
其中 devtools://devtools/bundled/inspector.html?experiments=true 是固定的,ws 参数对应的就是 websocket 地址。
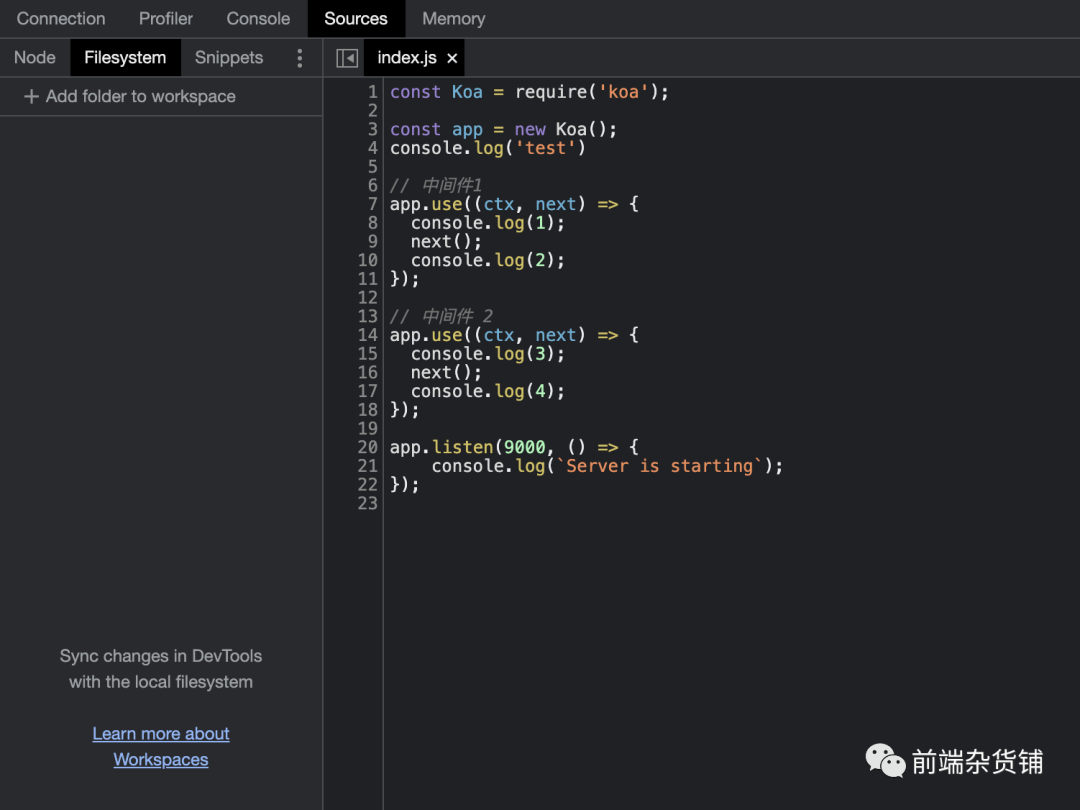
可以看到界面如下:
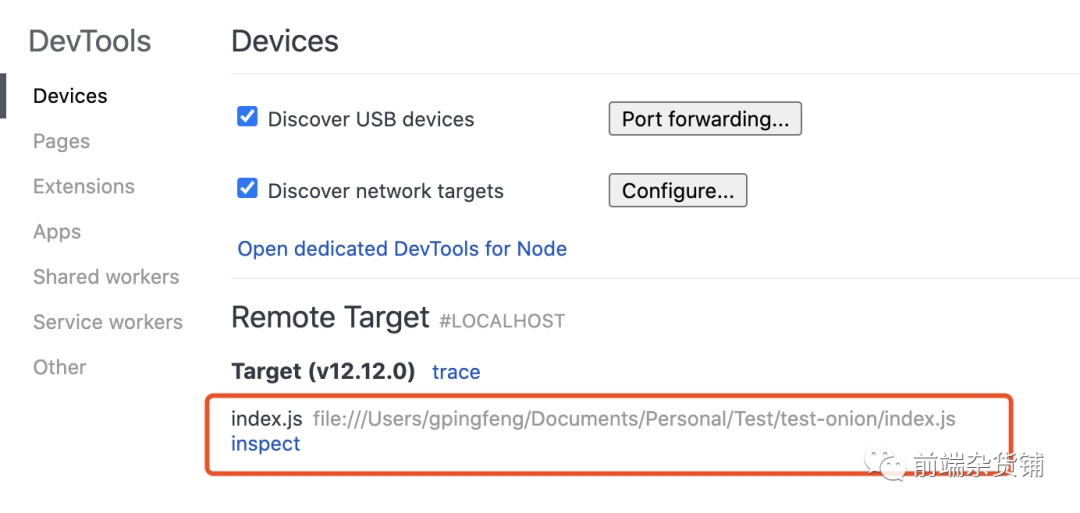
第三种方式
Chrome 浏览器打开 HTTP 监听接口页面,打开 dev tool,执行完 node --inspect=8888 index.js 后可以看到这个图标,点击一下:
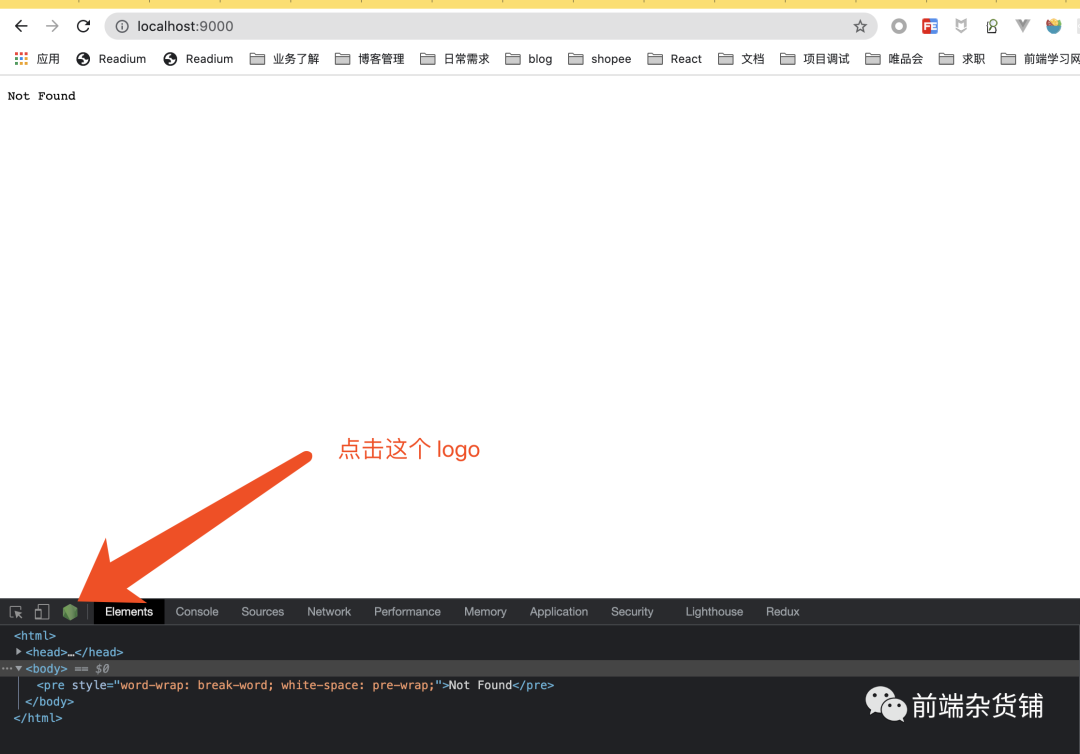
就可以出现跟浏览器一样的调试页面,比如 Sources Panel查看脚本、Profile Panel 监测性能等。
另外,可以访问访问 chrome://inspect/#devices,可以看到当前浏览器监听的所有 inspect。
Vscode 调试
除了浏览器之外,各大主流的 IDE 都支持 Node.js 的调试,本文以 Vscode 为例。
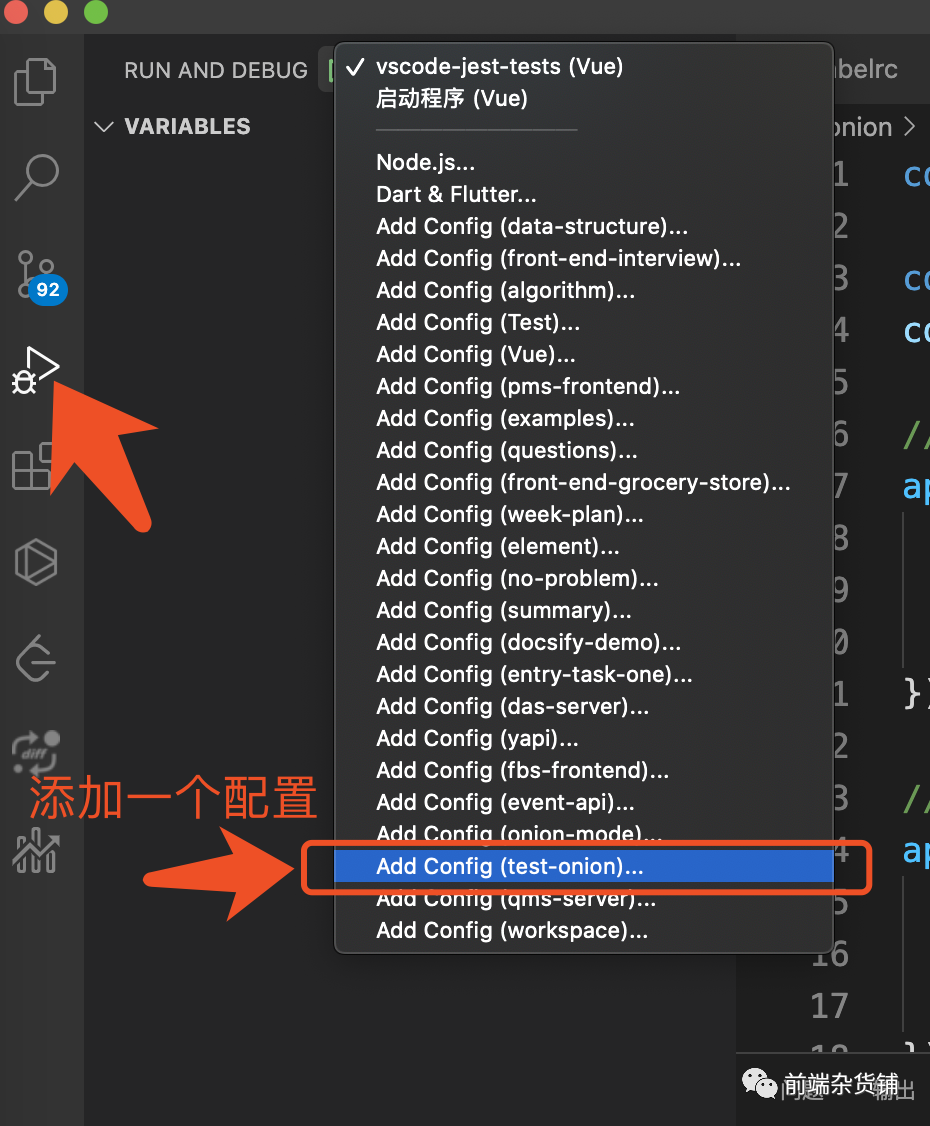
Launch Configuration
打开调试页面,给我们 Node 项目添加一个 launch 配置:
选择 Node.js
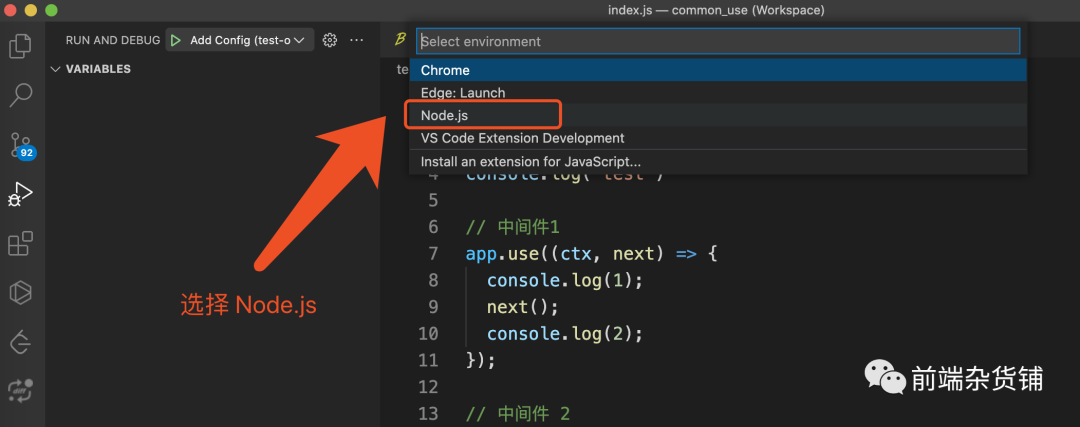
这样就会在项目根目录生成对应的文件 .vscode/launch.json(当然你也可以手动创建),其中 program 指的就是文件入口,${workspaceFolder} 指的是根目录。
{
  // Use IntelliSense to learn about possible attributes.
  // Hover to view descriptions of existing attributes.
  // For more information, visit: https://go.microsoft.com/fwlink/?linkid=830387
  "version": "0.2.0",
  "configurations": [
    {
      "type": "pwa-node",
      "request": "launch",
      "name": "Launch Program",
      "skipFiles": [
        "/**"
      ],
      "program": "${workspaceFolder}/index.js"
    }
  ]
}
按 F5、或者点击如下按钮:
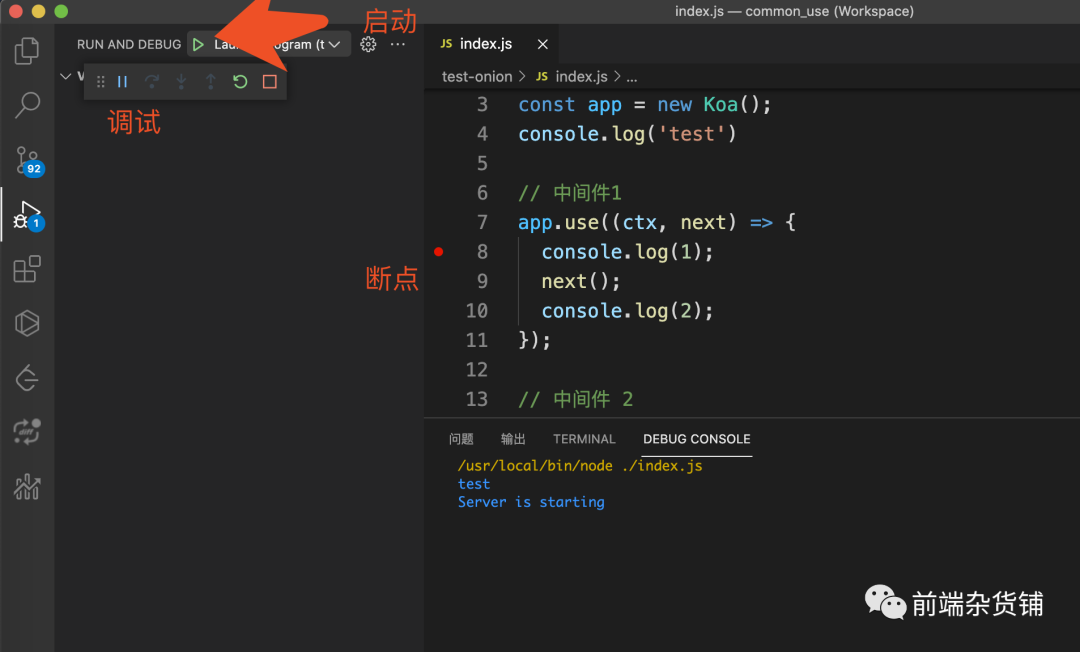
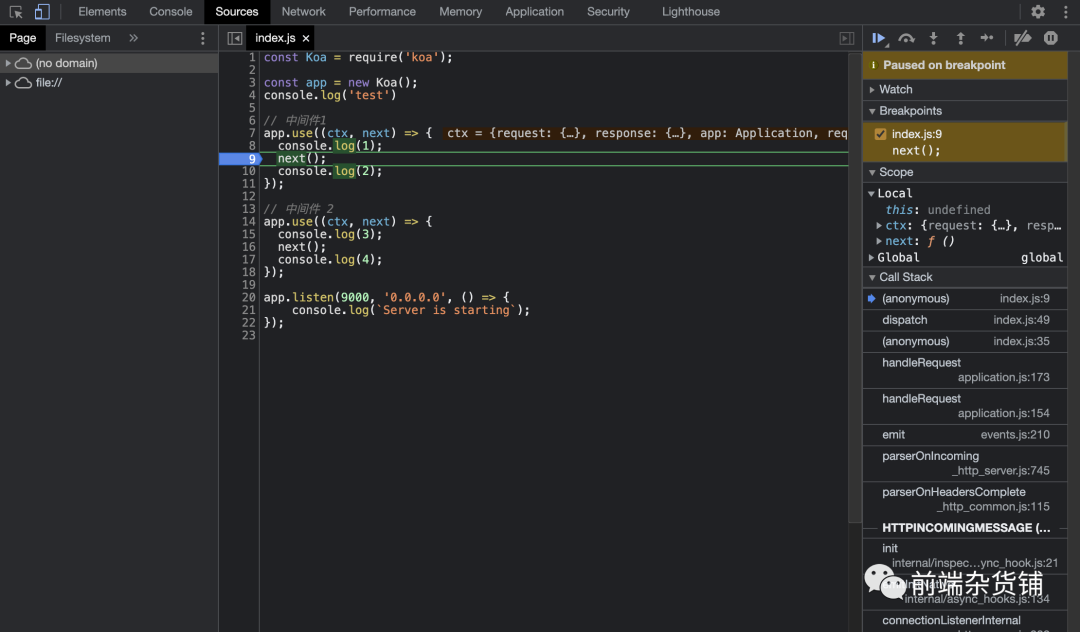
结果:
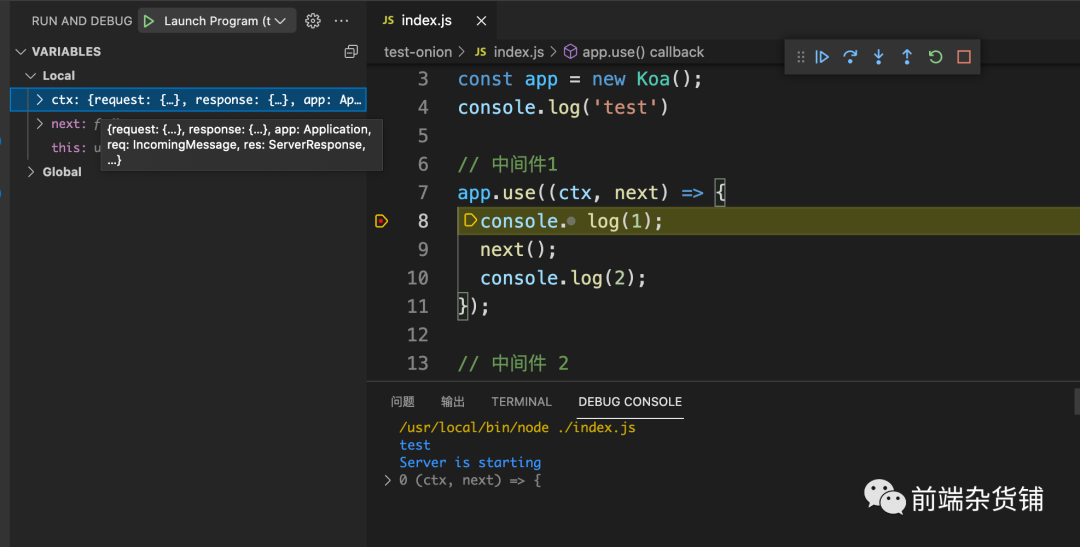
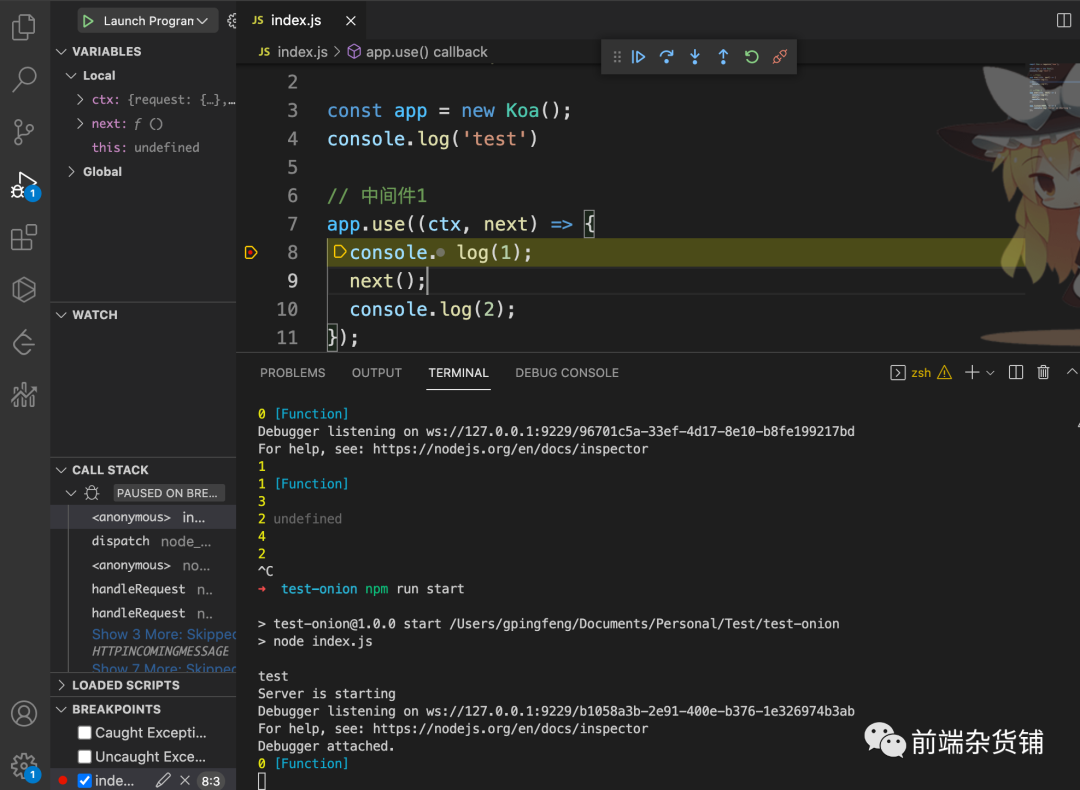
可以看到,在左侧可以显示当前作用域的值,调用堆栈等信息,右上方亦可逐步调试函数、重启等功能,非常强大。
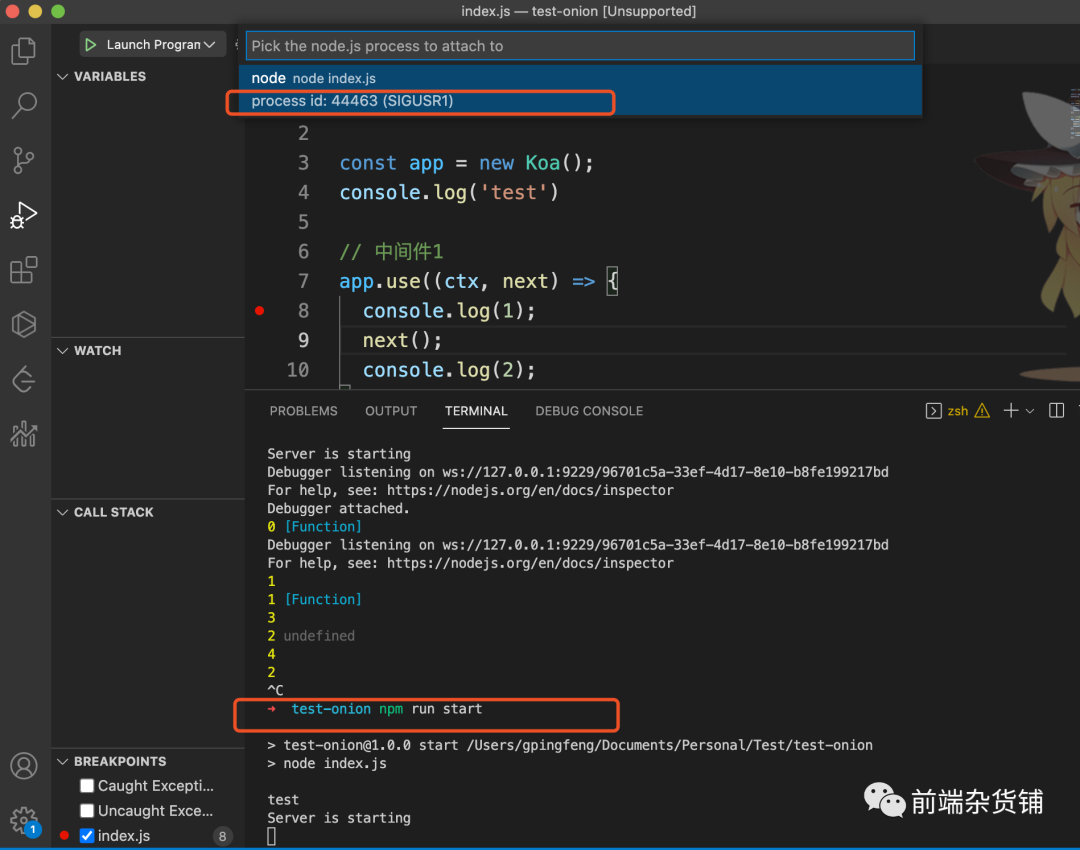
Attach to Node Process Action
通过 Attach to Node Process Action 的方式,我们可以直接调试运行中的 Node.js 进程。
比如我们先启动项目——npm run start。
然后 command + shift + p(window Ctrl+Shift+p),输入 Attach to Node Process Action,回车,然后选中运行中进程再回车,就可以跟上面配置一样调试代码了。
总结
本文总结了两种常见的调试 Node.js 的方式。第一种 Node.js 通过 websocket 的方式将信息传递给 Chrome 浏览器,我们直接在 Chrome 中进行调试。第二种就是通过 Vscode Launch Configuration,自定义配置的方式进行调试。通过 Attach to Node Process Action 的方式,可以便捷的调试正在运行的 Node.js 代码,而不需要配置。
参考资料
[1]stackoverflow: https://stackoverflow.com/questions/62066780/chrome-devtools-opens-as-a-search-rather-then-the-dev-tools-themselves