
ggplot2绘制流图
使用的是ggstream中的blockbusters数据集。
library(ggstream)

blockbusters
该包的geom_stream功能ggstrean允许 在 ggplot2 中创建流图。
library(ggstream)
# install.packages("ggplot2")
library(ggplot2)

ggplot(blockbusters, aes(x = year, y = box_office, fill = genre)) +
  geom_stream()

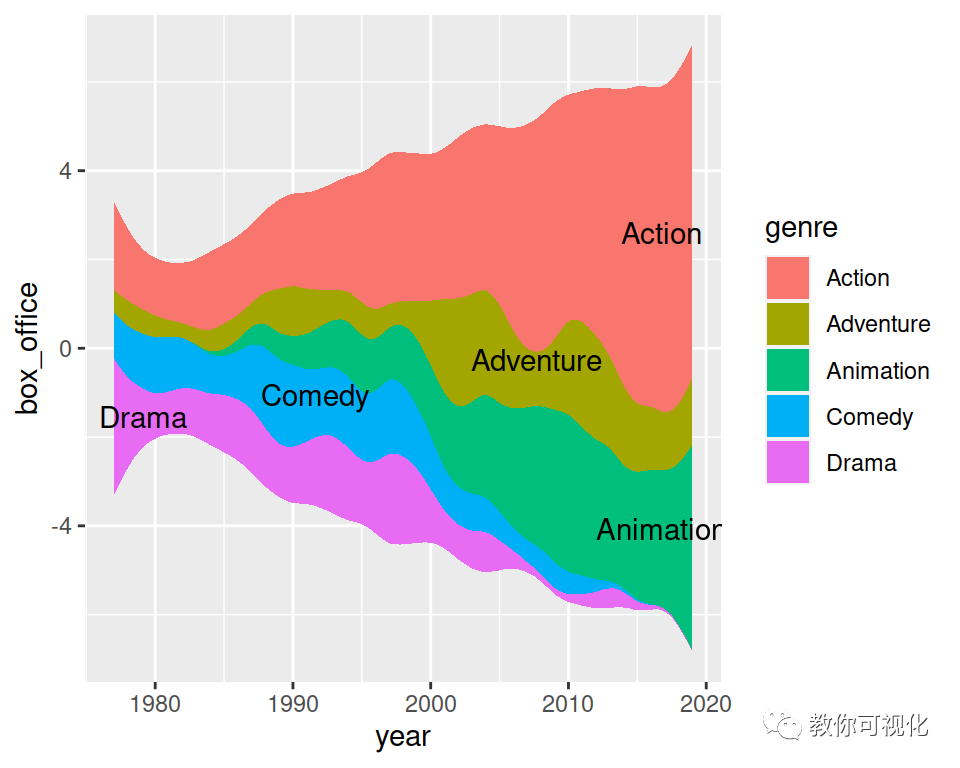
该包包含一个名为的附加函数geom_stream_label,可用于将标签添加到流图的每个区域。
ggplot(blockbusters, aes(x = year, y = box_office, fill = genre)) +
  geom_stream() +
  geom_stream_label(aes(label = genre))
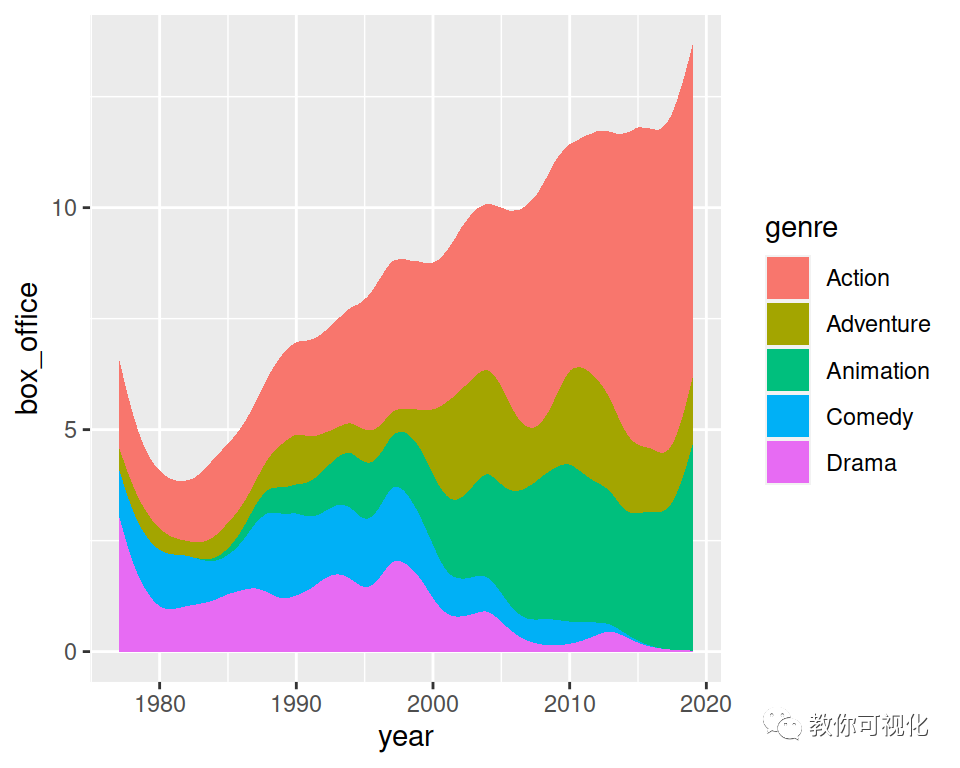
默认情况下,该geom_stream函数使用"mirror"类型,它围绕 X 轴对称地堆叠流。其他替代方案是"ridge",它从 X 轴堆叠,并且"proportional",它使流总和为 1。
ggplot(blockbusters, aes(x = year, y = box_office, fill = genre)) +
  geom_stream(type = "ridge")
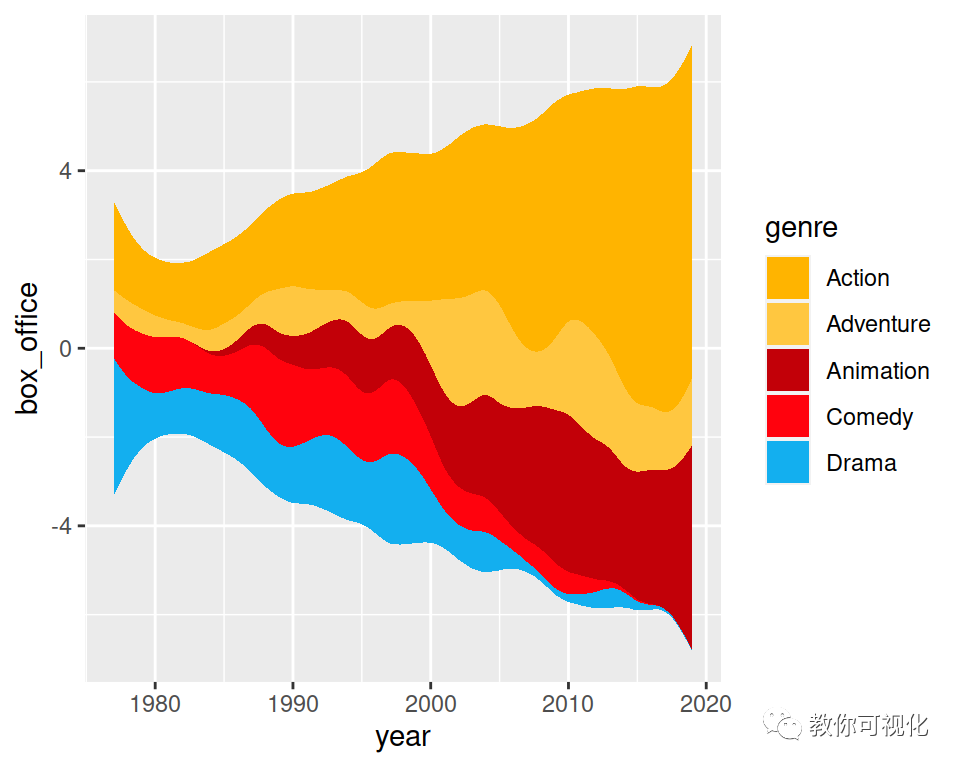
scale_fill_manual可以使用或等效函数更改流图的填充颜色。
cols <- c("#FFB400", "#FFC740", "#C20008", "#FF020D", "#13AFEF")

ggplot(blockbusters, aes(x = year, y = box_office, fill = genre)) +
  geom_stream() +
  scale_fill_manual(values = cols)
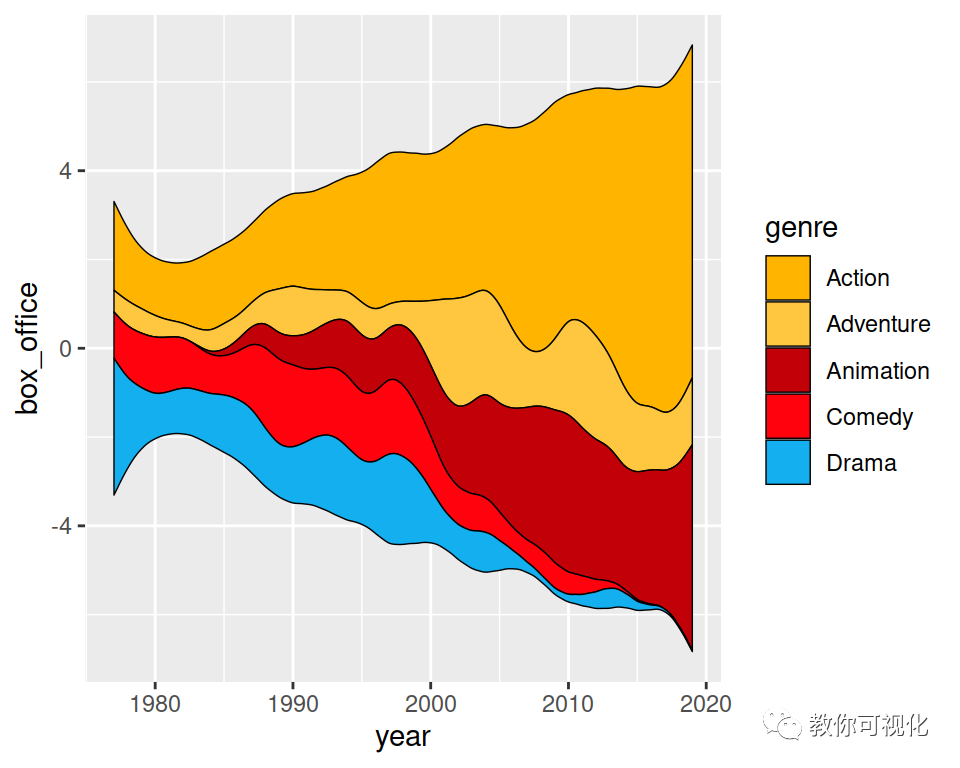
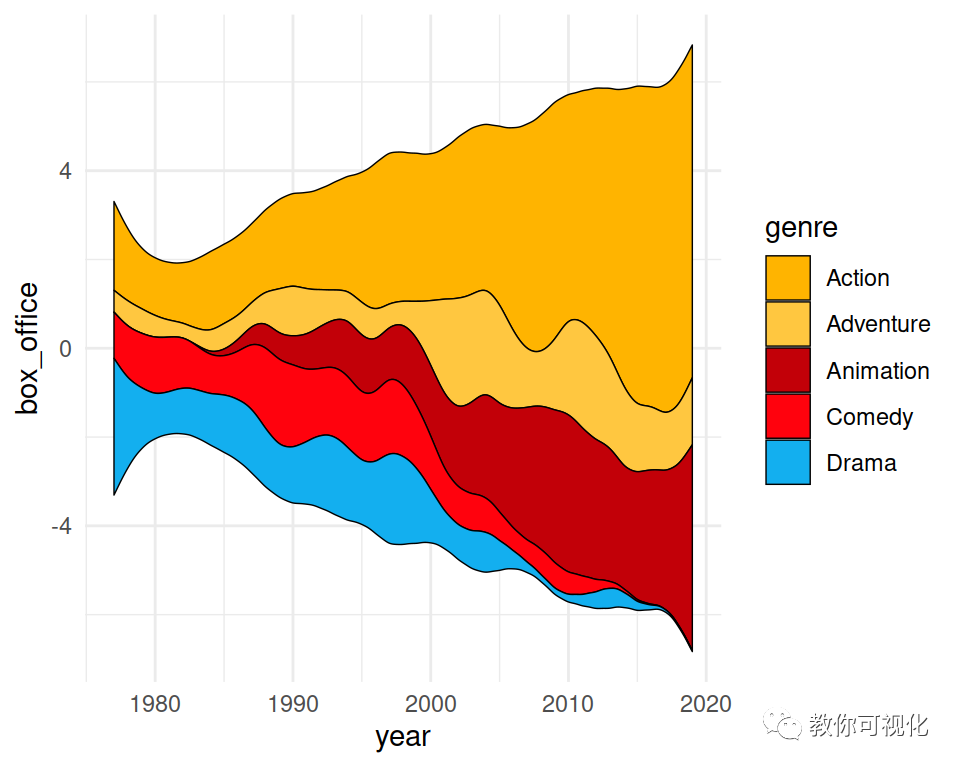
默认情况下,这些区域没有边框,但可以使用函数的color参数添加边框颜色geom_stream并使用 修改其宽度lwd。
cols <- c("#FFB400", "#FFC740", "#C20008", "#FF020D", "#13AFEF")

ggplot(blockbusters, aes(x = year, y = box_office, fill = genre)) +
  geom_stream(color = 1, lwd = 0.25) +
  scale_fill_manual(values = cols)
请注意,还可以更改主题以修改图表的外观。
cols <- c("#FFB400", "#FFC740", "#C20008", "#FF020D", "#13AFEF")

ggplot(blockbusters, aes(x = year, y = box_office, fill = genre)) +
  geom_stream(color = 1, lwd = 0.25) +
  scale_fill_manual(values = cols) +
  theme_minimal()
评论