数据科学家解决数据质量问题的实操指南
作者:Arunn Thevapalan
翻译:陈超
校对:王紫岳
本文介绍了Python中的Ydata-quality库如何应用于数据质量诊断,并给出数据实例进行详细的一步步解释。

如果你在处理现实数据的AI行业工作,那么你会理解这种痛苦。无论数据收集过程多么精简 ,我们用于建模的数据总是一片狼藉。
就像IBM描述的那样,80/20规则在数据科学领域同样适用。数据科学家80%的宝贵时间都花费在发现、清洗以及组织数据上。仅仅留下了20%的时间用于真正的数据分析。
整理数据并不有趣。对于“垃圾输入进去,垃圾输出出来”这句话,我知道它的重要性,但是我真的不能享受清洗空白格,修正正则表达式,并且解决数据中无法预料的问题的过程。
根据谷歌研究:“每个人都想做建模工作,而不是数据工作”——我对此感到非常愧疚。另外 ,本文介绍了一种叫做数据级联(data cascade)的现象,这种现象是指由底层数据问题引发的不利的后续影响的混合事件。实际上,该问题目前有三个方面 :
绝大多数数据科学技术并不喜欢清理和整理数据; 只有20%的时间是在做有用的分析; 数据质量问题如果不尽早处理,将会产生级联现象并影响后续工作。
只有解决了这些问题才能确保清理数据是容易,快捷,自然的。我们需要工具和技术来帮助我们这些数据科学家快速识别并解决数据质量问题,并以此将我们宝贵的时间投入到分析和AI领域——那些我们真正喜欢的工作当中。
在本文当中,我将呈现一种帮助我们基于预期优先级来提前识别数据质量问题的开源工具(https://github.com/ydataai/ydata-quality)。我很庆幸有这个工具存在,并且我等不及要跟你们分享它。

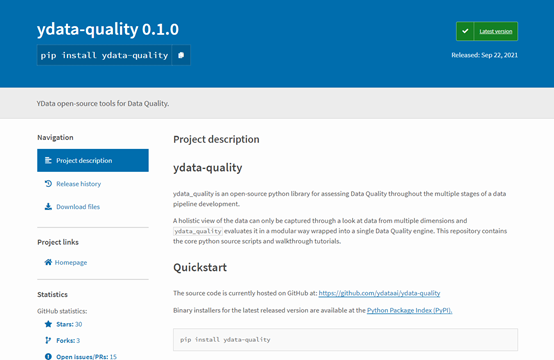
Ydata-quality是一个开源的Python库,用于数据管道发展的多个阶段来评估数据质量。该库是直观、易用的,并且你可以直接将其整合进入你的机器学习工作流。
对我个人而言,这个库的好处在于它可以基于数据质量问题(接下来展开)的优先级排序。在我们时间有限时,这是很有帮助的,并且我们也想优先处理对我们数据质量影响较大的问题。
让我向你们展示一下如何使用一团乱麻的数据的现实例子。在这个例子当中,我们将会:
加载一个混乱的数据集; 分析数据质量问题; 进一步挖掘警告信息; 应用策略来减轻这些问题; 检查在半清洗过后的数据的最终质量分析报告。
在安装任何库之前,最好使用venv或者conda来为项目创建虚拟环境,一旦这一步完成,在你的终端输入下面这行代码来安装库:
pip install ydata-quality现实生活中混乱的数据

第一步:加载数据集
第一步中,我们将会加载数据集以及必要的库。注意,这个库有多个模块(偏差&公正,数据期望,数据关系,漂移分析,错误数据,标签,缺失值)用于单独的数据质量问题,但是我们可以从DataQuality引擎开始,该引擎把所有的个体引擎打包成了一个类。
from ydata_quality import DataQualityimport pandas as pddf = pd.read_csv('../datasets/transformed/census_10k.csv')
第二步:分析数据质量问题
这是一个漫长的过程,但是DataQuality引擎在抽取所有细节方面确实做的很好 。只要简单地创建主类并使用evaluate() 方法。
# create the main class that holds all quality modulesdq = DataQuality(df=df)# run the testsresults = dq.evaluate()
Warnings:TOTAL: 5 warning(s)Priority 1: 1 warning(s)Priority 2: 4 warning(s)Priority 1 - heavy impact expected:* [DUPLICATES - DUPLICATE COLUMNS] Found 1 columns with exactly the same feature values as other columns.Priority 2 - usage allowed, limited human intelligibility:* [DATA RELATIONS - HIGH COLLINEARITY - NUMERICAL] Found 3 numerical variables with high Variance Inflation Factor (VIF>5.0). The variables listed in results are highly collinear with other variables in the dataset. These will make model explainability harder and potentially give way to issues like overfitting. Depending on your end goal you might want to remove the highest VIF variables.* [ERRONEOUS DATA - PREDEFINED ERRONEOUS DATA] Found 1960 ED values in the dataset.* [DATA RELATIONS - HIGH COLLINEARITY - CATEGORICAL] Found 10 categorical variables with significant collinearity (p-value < 0.05). The variables listed in results are highly collinear with other variables in the dataset and sorted descending according to propensity. These will make model explainability harder and potentially give way to issues like overfitting. Depending on your end goal you might want to remove variables following the provided order.* [DUPLICATES - EXACT DUPLICATES] Found 3 instances with exact duplicate feature values.
让我们来仔细分析一下这个报告:
警告(Warning):其中包括数据质量分析过程中检测到的问题细节。
优先级(Priority):对每一个检测到的问题,基于该问题预期的影响来分配一个优先级(越低的值表明越高的优先性)。
模块(Modules):每个检测到的问题与某一个模块(例如:数据关系,重复值,等)执行的数据质量检验相关联。
把所有的东西联系在一起,我们注意到有五个警告被识别出来,其中之一就是高优先级问题。它被“重复值”模块被检测出来,这意味着我们有一整个重复列需要修复。为了更深入地处理该问题,我们使用get_warnings() 方法。
dq.get_warnings(test="DuplicateColumns")[QualityWarning(category='Duplicates', test='Duplicate Columns', description='Found 1 columns with exactly the same feature values as other columns.', priority=<Priority.P1: 1>, data={'workclass': ['workclass2']})]第三步:使用特定的模块分析数据质量问题
数据质量的全貌需要多个角度分析,因此我们需要八个不同的模块。虽然它们被封装在DataQuality 类当中,但一些模块并不会运行,除非我们提供特定的参数。
from ydata_quality.bias_fairness import BiasFairness#create the main class that holds all quality modulesbf = BiasFairness(df=df, sensitive_features=['race', 'sex'], label='income')# run the testsbf_results = bf.evaluate()
Warnings:TOTAL: 2 warning(s)Priority 2: 2 warning(s)Priority 2 - usage allowed, limited human intelligibility:* [BIAS&FAIRNESS - PROXY IDENTIFICATION] Found 1 feature pairs of correlation to sensitive attributes with values higher than defined threshold (0.5).* [BIAS&FAIRNESS - SENSITIVE ATTRIBUTE REPRESENTATIVITY] Found 2 values of 'race' sensitive attribute with low representativity in the dataset (below 1.00%).
bf.get_warnings(test='Proxy Identification')[QualityWarning(category='Bias&Fairness', test='Proxy Identification', description='Found 1 feature pairs of correlation to sensitive attributes with values higher than defined threshold (0.5).', priority=<Priority.P2: 2>, data=featuresrelationship_sex 0.650656Name: association, dtype: float64)]
第四步:解决识别的问题
def improve_quality(df: pd.DataFrame):"""Clean the data based on the Data Quality issues found previously."""# Bias & Fairnessdf = df.replace({'relationship': {'Husband': 'Married', 'Wife': 'Married'}}) # Substitute gender-based 'Husband'/'Wife' for generic 'Married'# Duplicatesdf = df.drop(columns=['workclass2']) # Remove the duplicated columndf = df.drop_duplicates() # Remove exact feature value duplicatesreturn dfclean_df = improve_quality(df.copy())
第五步:运行最后的质量检验
*DataQuality Engine Report:*Warnings:TOTAL: 3 warning(s)Priority 2: 3 warning(s)Priority 2 - usage allowed, limited human intelligibility:* [ERRONEOUS DATA - PREDEFINED ERRONEOUS DATA] Found 1360 ED values in the dataset.* [DATA RELATIONS - HIGH COLLINEARITY - NUMERICAL] Found 3 numerical variables with high Variance Inflation Factor (VIF>5.0). The variables listed in results are highly collinear with other variables in the dataset. These will make model explainability harder and potentially give way to issues like overfitting. Depending on your end goal you might want to remove the highest VIF variables.* [DATA RELATIONS - HIGH COLLINEARITY - CATEGORICAL] Found 9 categorical variables with significant collinearity (p-value < 0.05). The variables listed in results are highly collinear with other variables in the dataset and sorted descending according to propensity. These will make model explainability harder and potentially give way to issues like overfitting. Depending on your end goal you might want to remove variables following the provided order.*Bias & Fairness Report:*Warnings:TOTAL: 1 warning(s)Priority 2: 1 warning(s)Priority 2 - usage allowed, limited human intelligibility:* [BIAS&FAIRNESS - SENSITIVE ATTRIBUTE REPRESENTATIVITY] Found 2 values of 'race' sensitive attribute with low representativity in the dataset (below 1.00%).
结束寄语

译者简介
陈超,北京大学应用心理硕士在读。本科曾混迹于计算机专业,后又在心理学的道路上不懈求索。越来越发现数据分析和编程已然成为了两门必修的生存技能,因此在日常生活中尽一切努力更好地去接触和了解相关知识,但前路漫漫,我仍在路上。

思路+步骤,手把手教你如何快速构建用户画像?
👇👇关注后回复【大数据资料】领取数据分析学习资料包
评论

