
用 XGBoost 在 Python 中进行特征重要性分析和特征选择

如何使用梯度提升算法计算特征重要性。 如何绘制由XGBoost模型计算的Python中的特征重要性。 如何使用XGBoost计算的特征重要性来执行特征选择。
print(model.feature_importances_)
# plot
pyplot.bar(range(len(model.feature_importances_)), model.feature_importances_)
pyplot.show()
https://raw.githubusercontent.com/jbrownlee/Datasets/master/pima-indians-diabetes.csv
https://raw.githubusercontent.com/jbrownlee/Datasets/master/pima-indians-diabetes.names
# plot feature importance manually
from numpy import loadtxt
from xgboost import XGBClassifier
from matplotlib import pyplot
# load data
dataset = loadtxt('pima-indians-diabetes.csv', delimiter=",")
# split data into X and y
X = dataset[:,0:8]
y = dataset[:,8]
# fit model no training data
model = XGBClassifier()
model.fit(X, y)
# feature importance
print(model.feature_importances_)
# plot
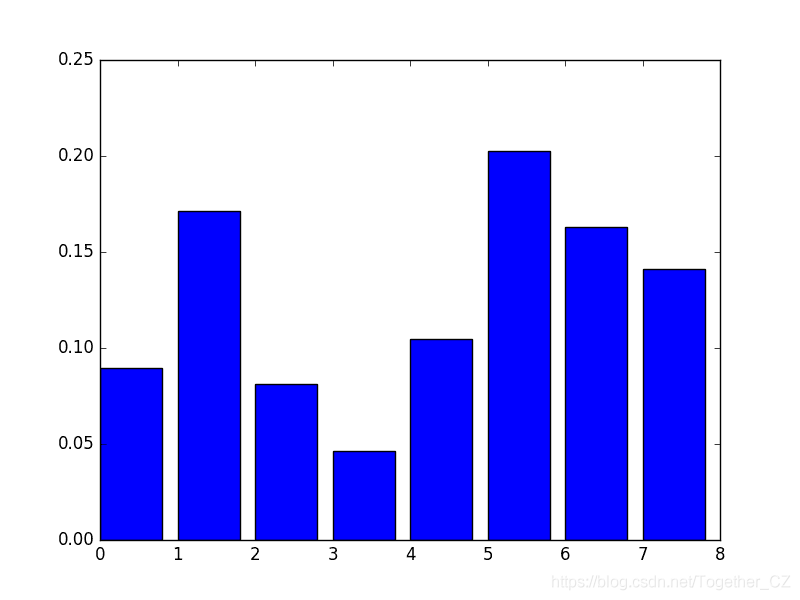
pyplot.bar(range(len(model.feature_importances_)), model.feature_importances_)
pyplot.show()
[ 0.089701 0.17109634 0.08139535 0.04651163 0.10465116 0.2026578 0.1627907 0.14119601]
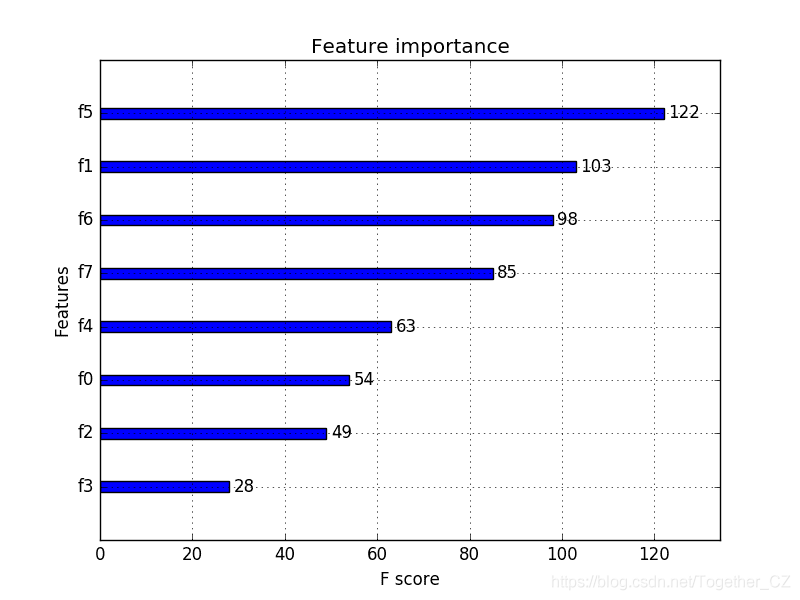
plot_importance(),可以按以下方式使用:# plot feature importance
plot_importance(model)
pyplot.show()
plot_importance()函数绘制了Pima Indians数据集的特征重要性。# plot feature importance using built-in function
from numpy import loadtxt
from xgboost import XGBClassifier
from xgboost import plot_importance
from matplotlib import pyplot
# load data
dataset = loadtxt('pima-indians-diabetes.csv', delimiter=",")
# split data into X and y
X = dataset[:,0:8]
y = dataset[:,8]
# fit model no training data
model = XGBClassifier()
model.fit(X, y)
# plot feature importance
plot_importance(model)
pyplot.show()
SelectFromModel类完成的,该类采用一个模型,并且可以将数据集转换为具有选定要素的子集。此类可以采用预训练的模型,例如在整个训练数据集上进行训练的模型。然后,它可以使用阈值来确定要选择的特征。当您在SelectFromModel实例上调用transform()方法以一致地选择训练数据集和测试数据集上的相同要素时,将使用此阈值。SelectFromModel实例中。我们使用它来选择训练数据集上的特征,从选定的特征子集中训练模型,然后在测试集上评估模型,并遵循相同的特征选择方案。# select features using threshold
selection = SelectFromModel(model, threshold=thresh, prefit=True)
select_X_train = selection.transform(X_train)
# train model
selection_model = XGBClassifier()
selection_model.fit(select_X_train, y_train)
# eval model
select_X_test = selection.transform(X_test)
y_pred = selection_model.predict(select_X_test)
# use feature importance for feature selection
from numpy import loadtxt
from numpy import sort
from xgboost import XGBClassifier
from sklearn.model_selection import train_test_split
from sklearn.metrics import accuracy_score
from sklearn.feature_selection import SelectFromModel
# load data
dataset = loadtxt('pima-indians-diabetes.csv', delimiter=",")
# split data into X and y
X = dataset[:,0:8]
Y = dataset[:,8]
# split data into train and test sets
X_train, X_test, y_train, y_test = train_test_split(X, Y, test_size=0.33, random_state=7)
# fit model on all training data
model = XGBClassifier()
model.fit(X_train, y_train)
# make predictions for test data and evaluate
y_pred = model.predict(X_test)
predictions = [round(value) for value in y_pred]
accuracy = accuracy_score(y_test, predictions)
print("Accuracy: %.2f%%" % (accuracy * 100.0))
# Fit model using each importance as a threshold
thresholds = sort(model.feature_importances_)
for thresh in thresholds:
# select features using threshold
selection = SelectFromModel(model, threshold=thresh, prefit=True)
select_X_train = selection.transform(X_train)
# train model
selection_model = XGBClassifier()
selection_model.fit(select_X_train, y_train)
# eval model
select_X_test = selection.transform(X_test)
y_pred = selection_model.predict(select_X_test)
predictions = [round(value) for value in y_pred]
accuracy = accuracy_score(y_test, predictions)
print("Thresh=%.3f, n=%d, Accuracy: %.2f%%" % (thresh, select_X_train.shape[1], accuracy*100.0))
KeyError: 'weight'
XGBClassifier类来解决,该类为coef_属性返回None。下面列出了完整的示例。# use feature importance for feature selection, with fix for xgboost 1.0.2
from numpy import loadtxt
from numpy import sort
from xgboost import XGBClassifier
from sklearn.model_selection import train_test_split
from sklearn.metrics import accuracy_score
from sklearn.feature_selection import SelectFromModel
# define custom class to fix bug in xgboost 1.0.2
class MyXGBClassifier(XGBClassifier):
@property
def coef_(self):
return None
# load data
dataset = loadtxt('pima-indians-diabetes.csv', delimiter=",")
# split data into X and y
X = dataset[:,0:8]
Y = dataset[:,8]
# split data into train and test sets
X_train, X_test, y_train, y_test = train_test_split(X, Y, test_size=0.33, random_state=7)
# fit model on all training data
model = MyXGBClassifier()
model.fit(X_train, y_train)
# make predictions for test data and evaluate
predictions = model.predict(X_test)
accuracy = accuracy_score(y_test, predictions)
print("Accuracy: %.2f%%" % (accuracy * 100.0))
# Fit model using each importance as a threshold
thresholds = sort(model.feature_importances_)
for thresh in thresholds:
# select features using threshold
selection = SelectFromModel(model, threshold=thresh, prefit=True)
select_X_train = selection.transform(X_train)
# train model
selection_model = XGBClassifier()
selection_model.fit(select_X_train, y_train)
# eval model
select_X_test = selection.transform(X_test)
predictions = selection_model.predict(select_X_test)
accuracy = accuracy_score(y_test, predictions)
print("Thresh=%.3f, n=%d, Accuracy: %.2f%%" % (thresh, select_X_train.shape[1], accuracy*100.0))
Accuracy: 77.95%
Thresh=0.071, n=8, Accuracy: 77.95%
Thresh=0.073, n=7, Accuracy: 76.38%
Thresh=0.084, n=6, Accuracy: 77.56%
Thresh=0.090, n=5, Accuracy: 76.38%
Thresh=0.128, n=4, Accuracy: 76.38%
Thresh=0.160, n=3, Accuracy: 74.80%
Thresh=0.186, n=2, Accuracy: 71.65%
Thresh=0.208, n=1, Accuracy: 63.78%
作者:沂水寒城,CSDN博客专家,个人研究方向:机器学习、深度学习、NLP、CV
Blog: http://yishuihancheng.blog.csdn.net
赞 赏 作 者

更多阅读
特别推荐

点击下方阅读原文加入社区会员
评论