用Python学线性代数:自动拟合数据分布
↑↑↑点击上方蓝字,回复资料,10个G的惊喜
问题
如果有一组数据,如何确定他们来自哪个统计分布?
从数据分析的角度,我们并不想要通过严格的统计方法去找到这个分布,其实 Python 中有一个可以自动拟合数据分布的库 —— distfit 。这是一个python包,用于通过残差平方和(RSS)和拟合优度检验(GOF)对89个单变量分布进行概率密度拟合,并返回最佳分布。
distfit 简单又好用
# 安装
pip install distfit
常见用法:
.fit_transform(): 在经验数据 X 上拟合分布.summary:获得拟合数据并测试拟合优度的所有分布的分数。.predict():预测响应变量的概率.model:输出分布的最佳参数.plot(): 绘制最佳的拟合分布
示例
from distfit import distfit
import numpy as np
X = np.random.normal(0, 2, [100,10])
y = [-8,-6,0,1,2,3,4,5,6]
dist = distfit(todf=True)
dist.fit_transform(X)
dist.plot()
输出用于拟合过程的函数列表,它使用最流行的 10 个发行版的列表进行扫描。
[distfit] >[norm      ] [0.00 sec] [RSS: 0.0120713] [loc=-0.047 scale=1.984]
[distfit] >[expon     ] [0.0 sec] [RSS: 0.4092169] [loc=-7.320 scale=7.273]
[distfit] >[pareto    ] [0.06 sec] [RSS: 0.4098607] [loc=-98251992.546 scale=98251985.226]
[distfit] >[dweibull  ] [0.01 sec] [RSS: 0.0229391] [loc=-0.046 scale=1.721]
[distfit] >[t         ] [0.04 sec] [RSS: 0.0120717] [loc=-0.047 scale=1.984]
[distfit] >[genextreme] [0.05 sec] [RSS: 0.0107445] [loc=-0.755 scale=1.981]
[distfit] >[gamma     ] [0.04 sec] [RSS: 0.0118907] [loc=-191.812 scale=0.021]
[distfit] >[lognorm   ] [0.09 sec] [RSS: 0.0117103] [loc=-107.148 scale=107.084]
[distfit] >[beta      ] [0.03 sec] [RSS: 0.0116300] [loc=-14.479 scale=28.973]
[distfit] >[uniform   ] [0.0 sec] [RSS: 0.2545746] [loc=-7.320 scale=12.835]
[distfit] >[loggamma  ] [0.04 sec] [RSS: 0.0123738] [loc=-360.941 scale=54.518]
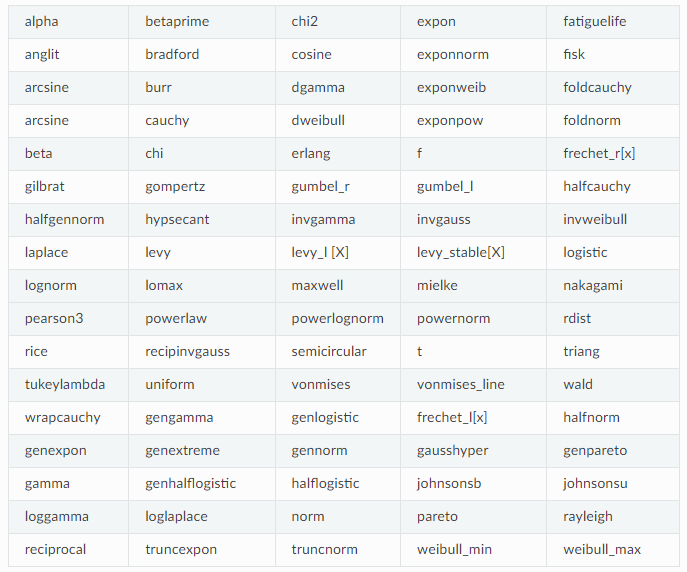
当然,distfit 支持的分布还有很多:
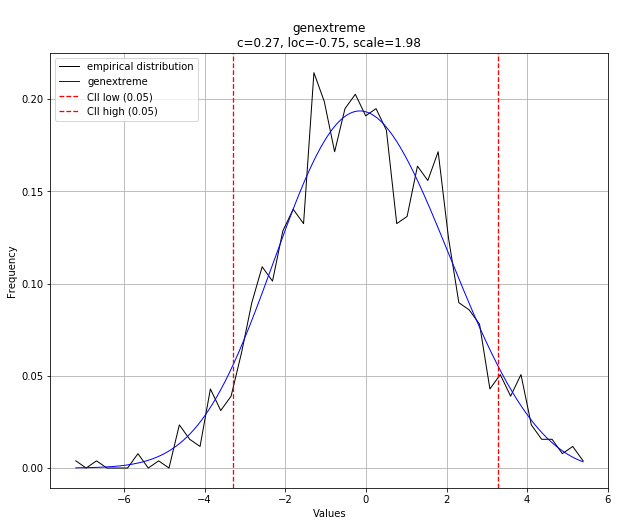
 最后绘制最佳的拟合分布
dist.summary 输出各分布的参数。
         distr      score  ...       scale                                       arg
0   genextreme  0.0107445  ...      1.9814                    (0.27387377680364405,)
1         beta    0.01163  ...     28.9726  (26.055079164665887, 26.248878389403494)
2      lognorm  0.0117103  ...     107.084                    (0.01848064379707136,)
3        gamma  0.0118907  ...   0.0205321                      (9339.777394183824,)
4         norm  0.0120713  ...     1.98429                                        ()
5            t  0.0120717  ...     1.98428                      (1863131.339823592,)
6     loggamma  0.0123738  ...     54.5178                      (750.2645425001494,)
7     dweibull  0.0229391  ...     1.72129                     (1.2898970802235787,)
8      uniform   0.254575  ...     12.8346                                        ()
9        expon   0.409217  ...     7.27316                                        ()
10      pareto   0.409861  ...  9.8252e+07                     (13542571.060345018,)
推荐阅读
(点击标题可跳转阅读)
老铁,三连支持一下,好吗?↓↓↓
评论
