机器学习中统计概率分布大全(Python代码)
-
随机变量(Random Variable) -
密度函数(Density Functions) -
伯努利分布(Bernoulli Distribution) -
二项式分布(Binomial Distribution) -
均匀分布(Uniform Distribution) -
泊松分布(Poisson Distribution) -
正态分布(Normal Distribution) -
长尾分布(Long-Tailed Distribution) -
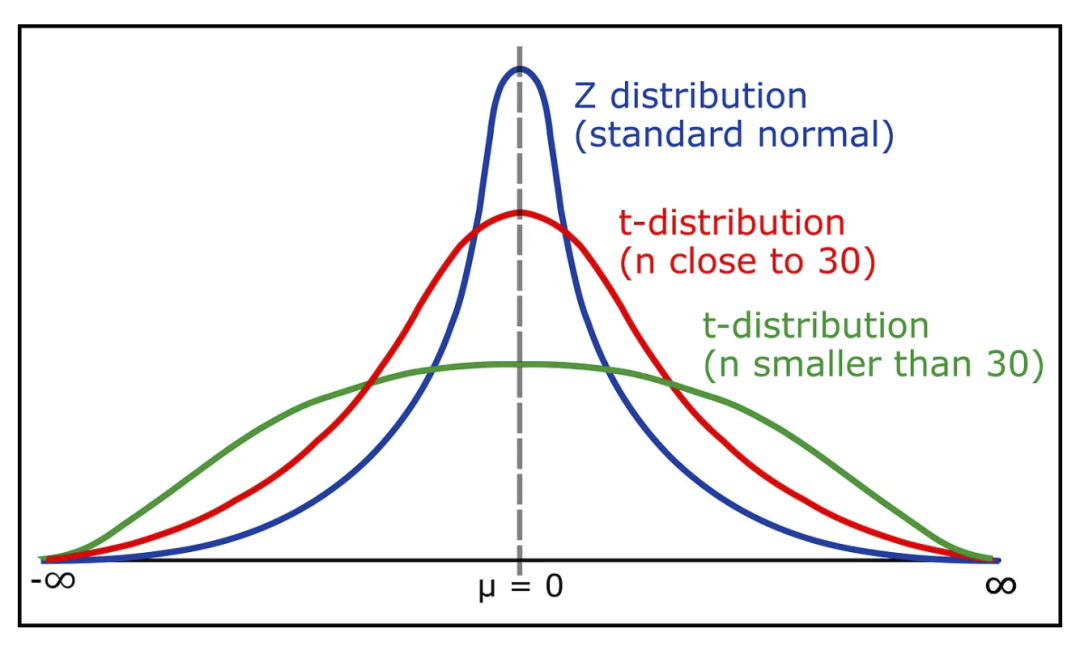
学生 t 检验分布(Student’s t-test Distribution) -
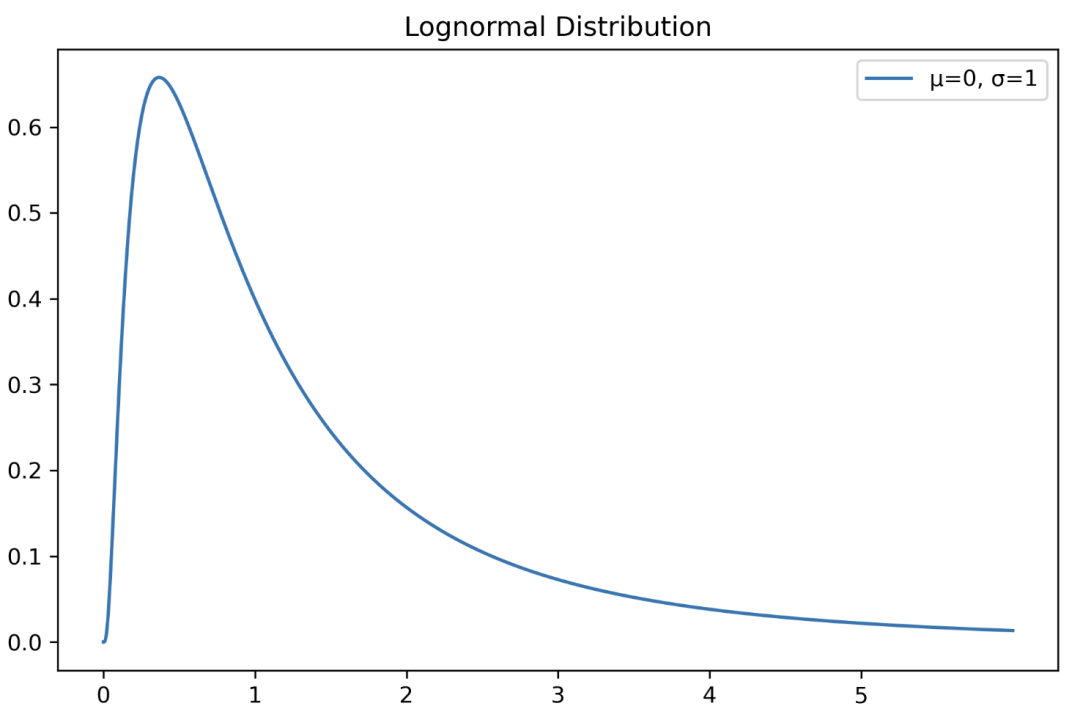
对数正态分布(Lognormal Distribution) -
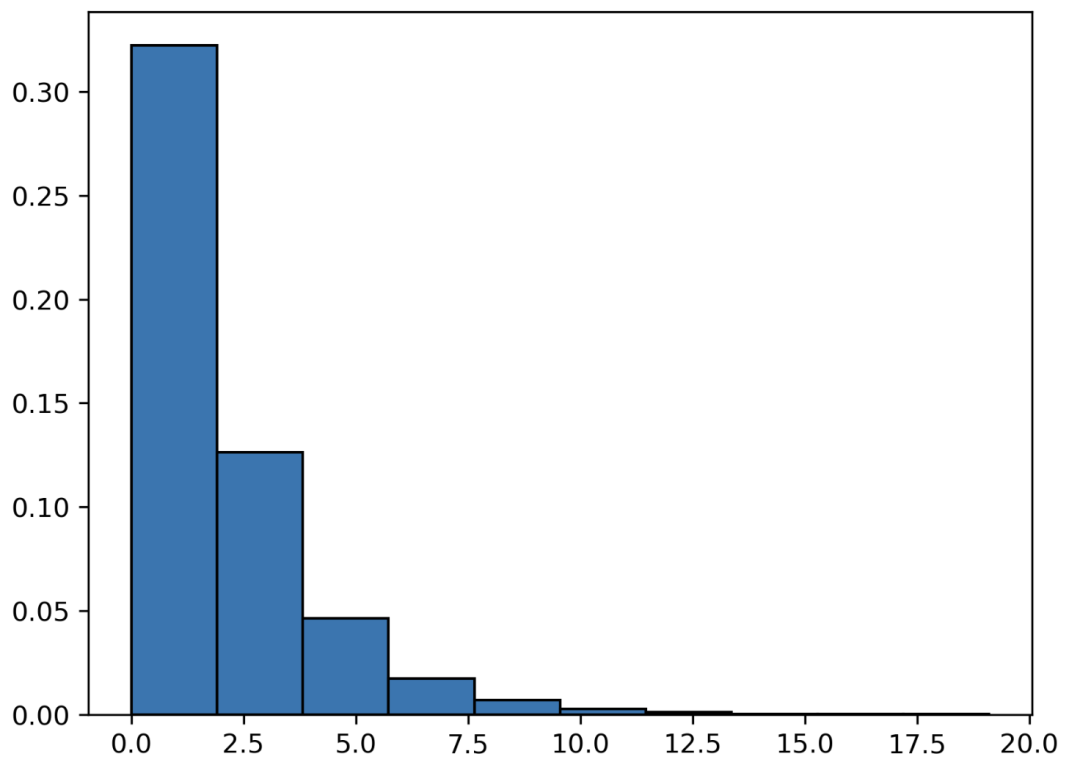
指数分布(Exponential Distribution) -
威布尔分布(Weibull Distribution) -
伽马分布(Gamma Distribution) -
卡方分布(Chi-square Distribution) -
中心极限定理(Central Limit Theorem)
1. 随机变量
离散随机变量
2. 密度函数
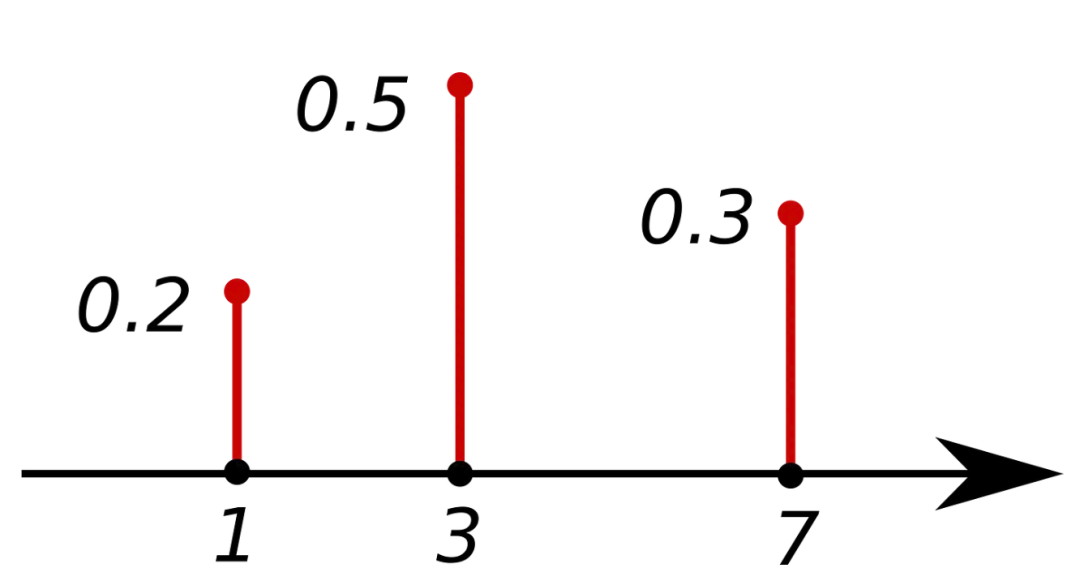
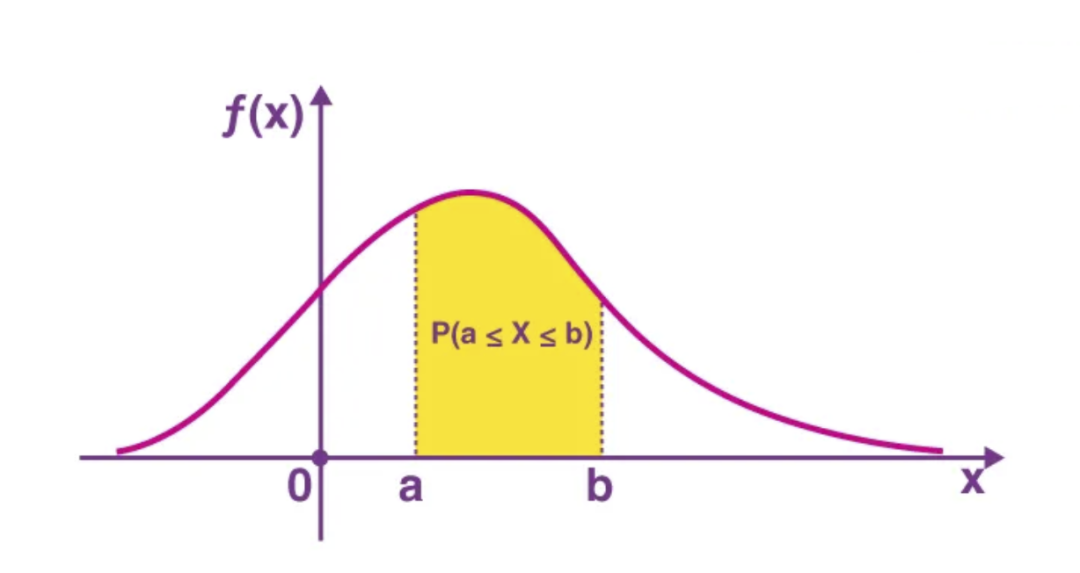
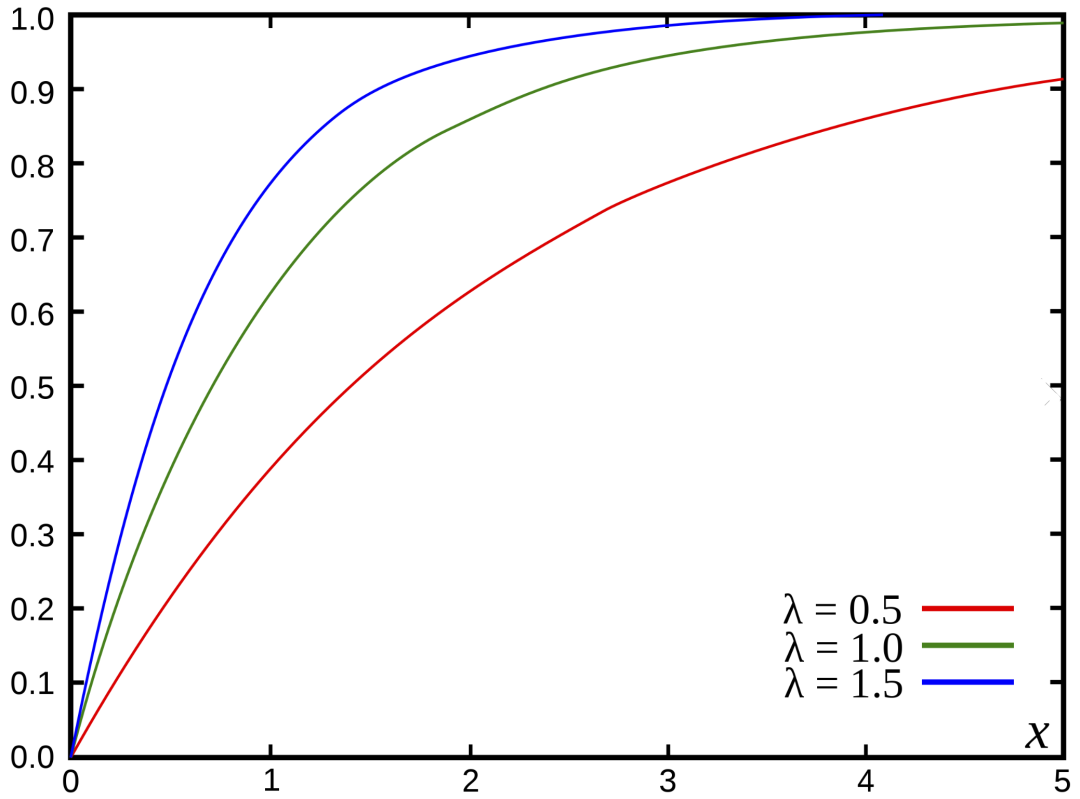
3. 离散分布
import seaborn as sns
from scipy.stats import bernoulli
# 单一观察值
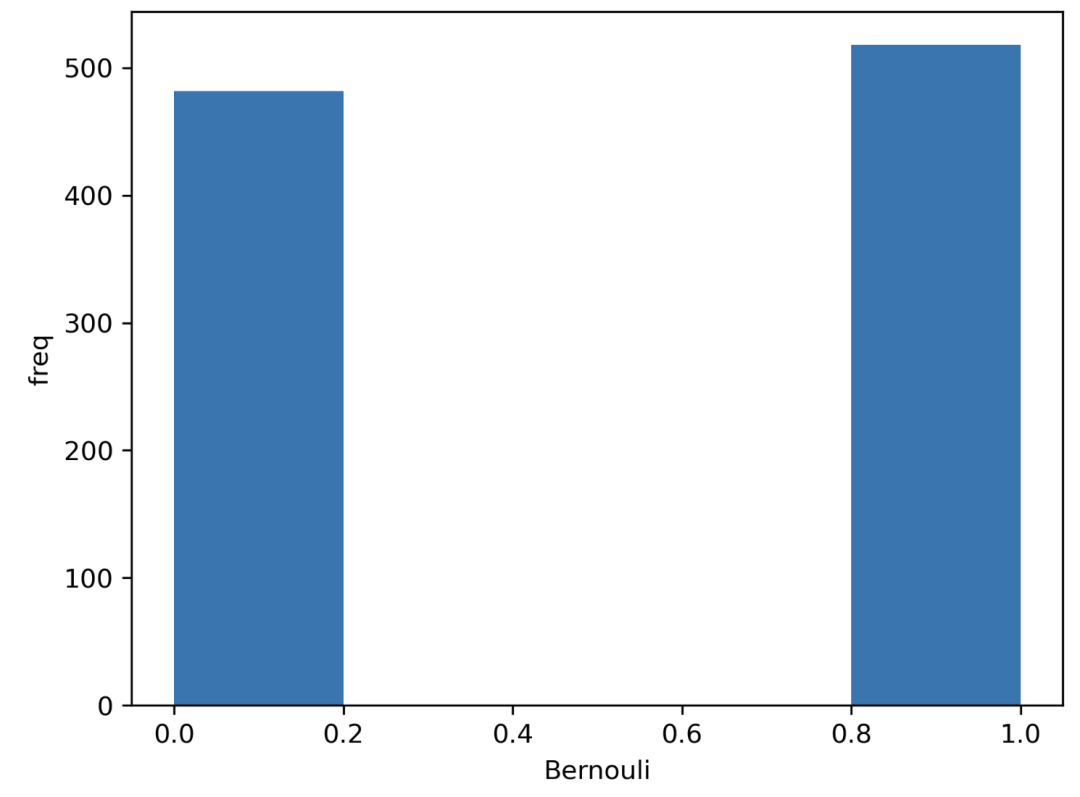
# 生成数据 (1000 points, possible outs: 1 or 0, probability: 50% for each)
data = bernoulli.rvs(size=1000,p=0.5)
# 绘制图形
ax = sns.distplot(data_bern,kde=False,hist_kws={"linewidth": 10,'alpha':1})
ax.set(xlabel='Bernouli', ylabel='freq')
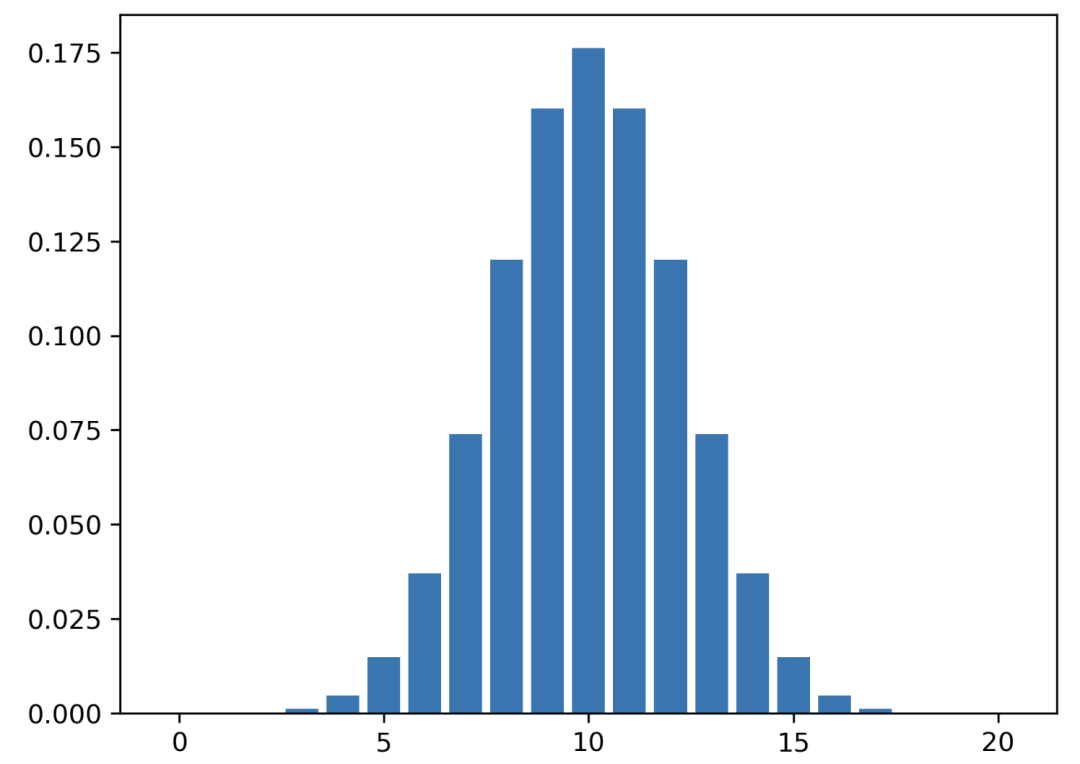
二项式分布
import matplotlib.pyplot as plt
from scipy.stats import binom
n = 20
# 实验次数
p = 0.5
# 成功的概率
r = list(range(n + 1))
# the number of success
# pmf值
pmf_list = [binom.pmf(r_i, n, p) for r_i in r ]
# 绘图
plt.bar(r, pmf_list)plt.show()
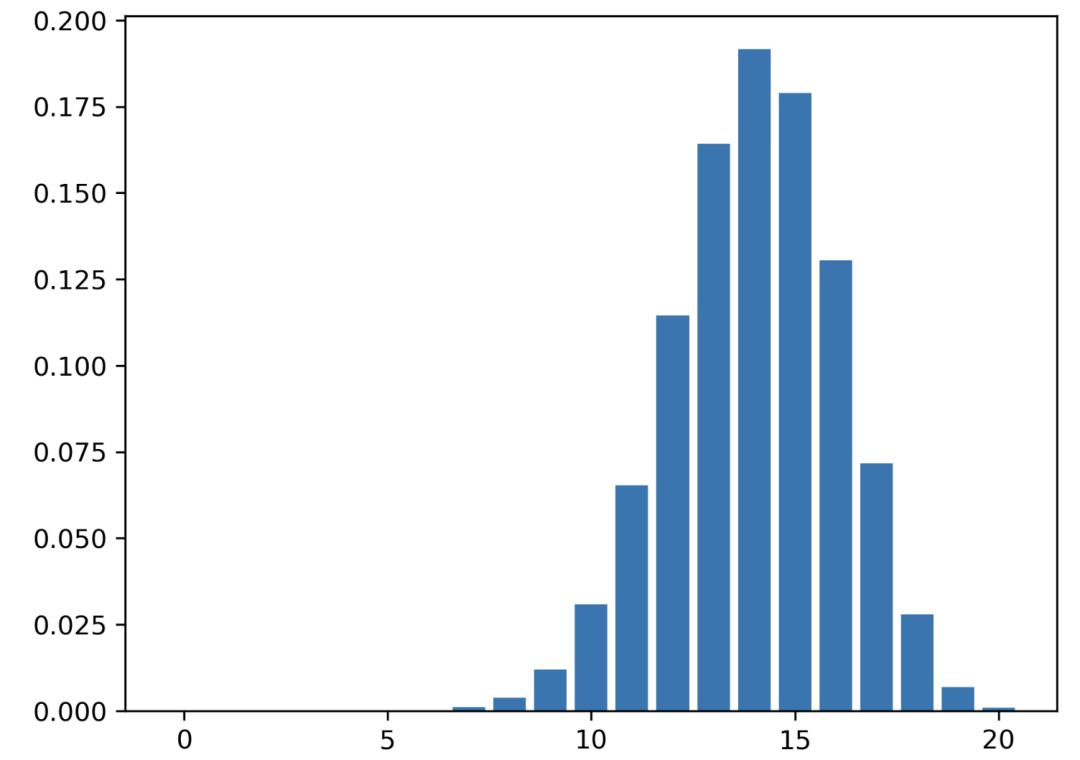
现在这次,你有一枚欺诈硬币。你知道这个硬币正面向上的概率是 0.7。因此,p = 0.7。
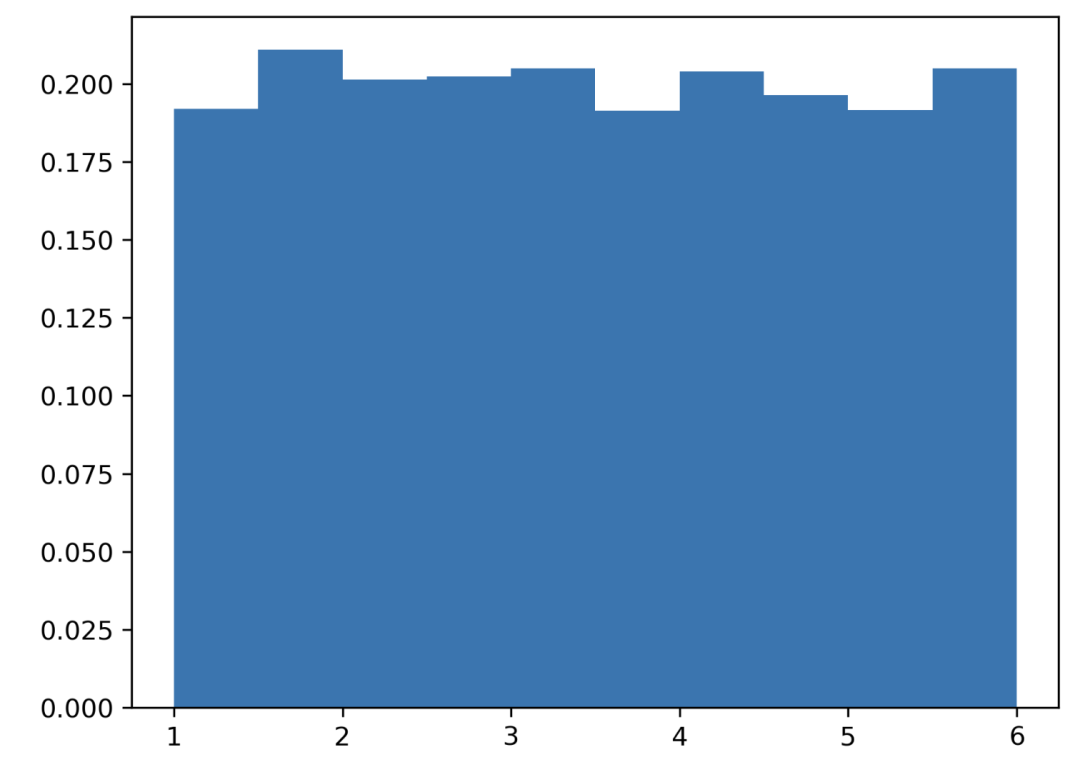
均匀分布
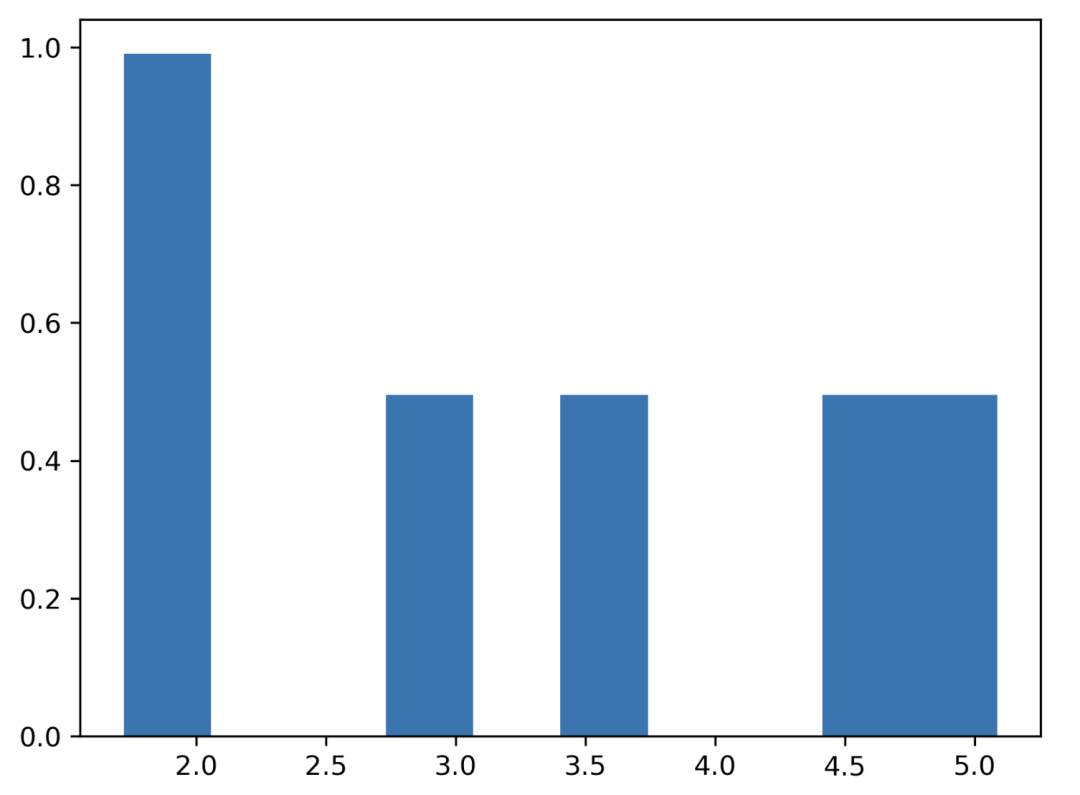 掷 6 次。
data = np.random.uniform(1, 6, 6000)
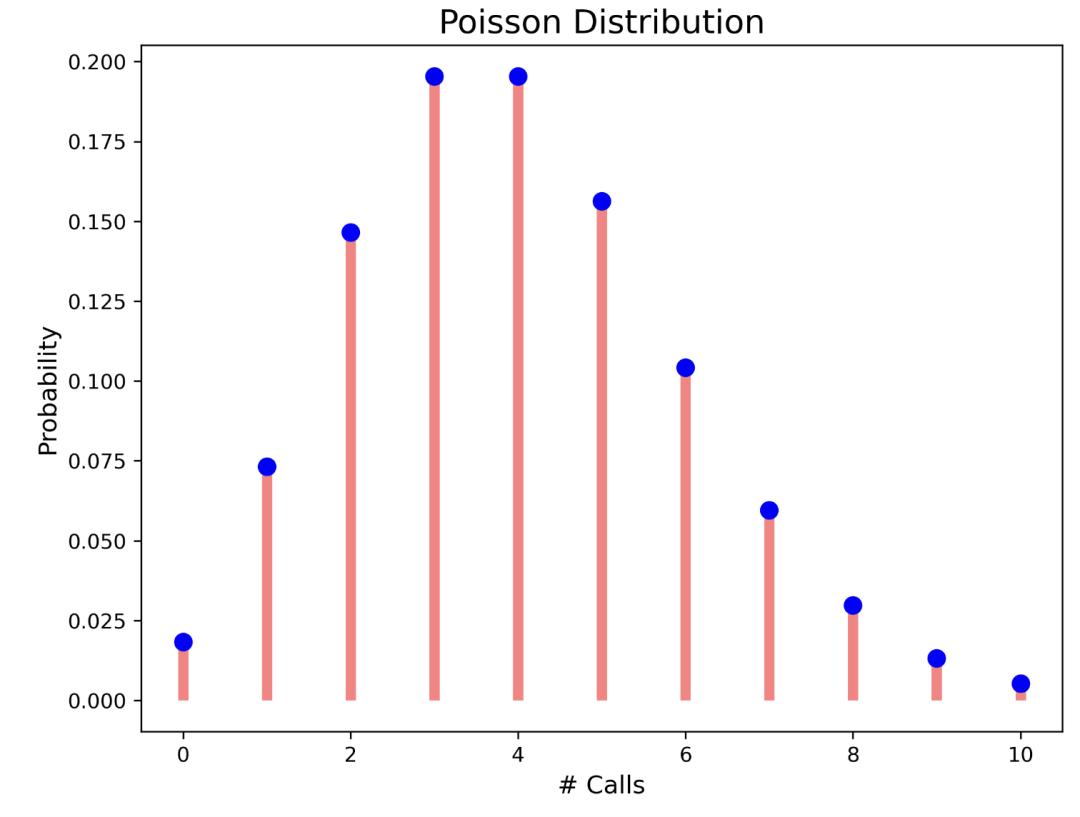
Poisson 分布
import matplotlib.pyplot as plt
from scipy.stats
import poisson
r = range(0,11)
# 呼叫次数
lambda_val = 4
# 均值
# 概率值
data = poisson.pmf(r, lambda_val)
# 绘图
fig, ax = plt.subplots(1, 1, figsize=(8, 6))
ax.plot(r, data, 'bo', ms=8, label='poisson')
plt.ylabel("Probability", fontsize="12")
plt.xlabel("# Calls", fontsize="12")
plt.title("Poisson Distribution", fontsize="16")
ax.vlines(r, 0, data, colors='r', lw=5, alpha=0.5)
4. 连续分布
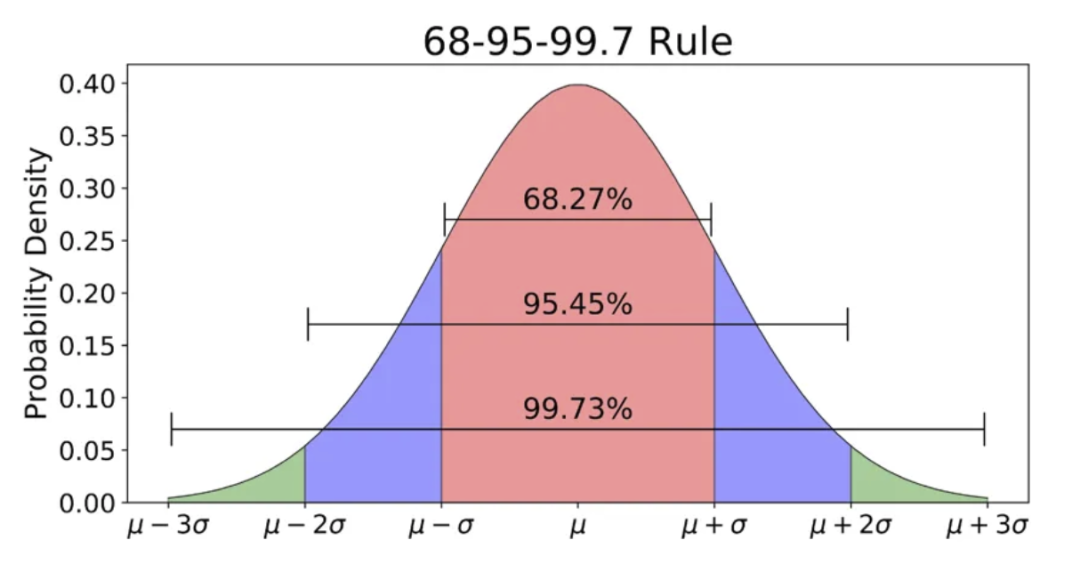
正态分布
import scipy
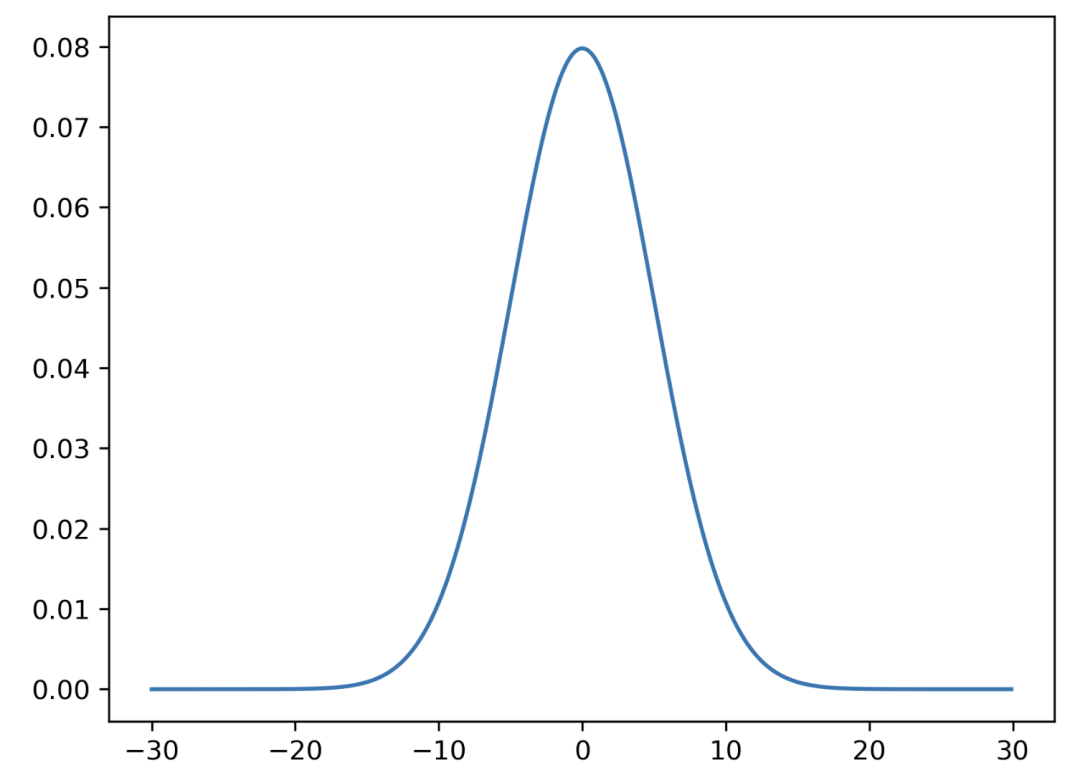
mean = 0
standard_deviation = 5
x_values = np. arange(-30, 30, 0.1)
y_values = scipy.stats.norm(mean, standard_deviation)
plt.plot(x_values, y_values. pdf(x_values))
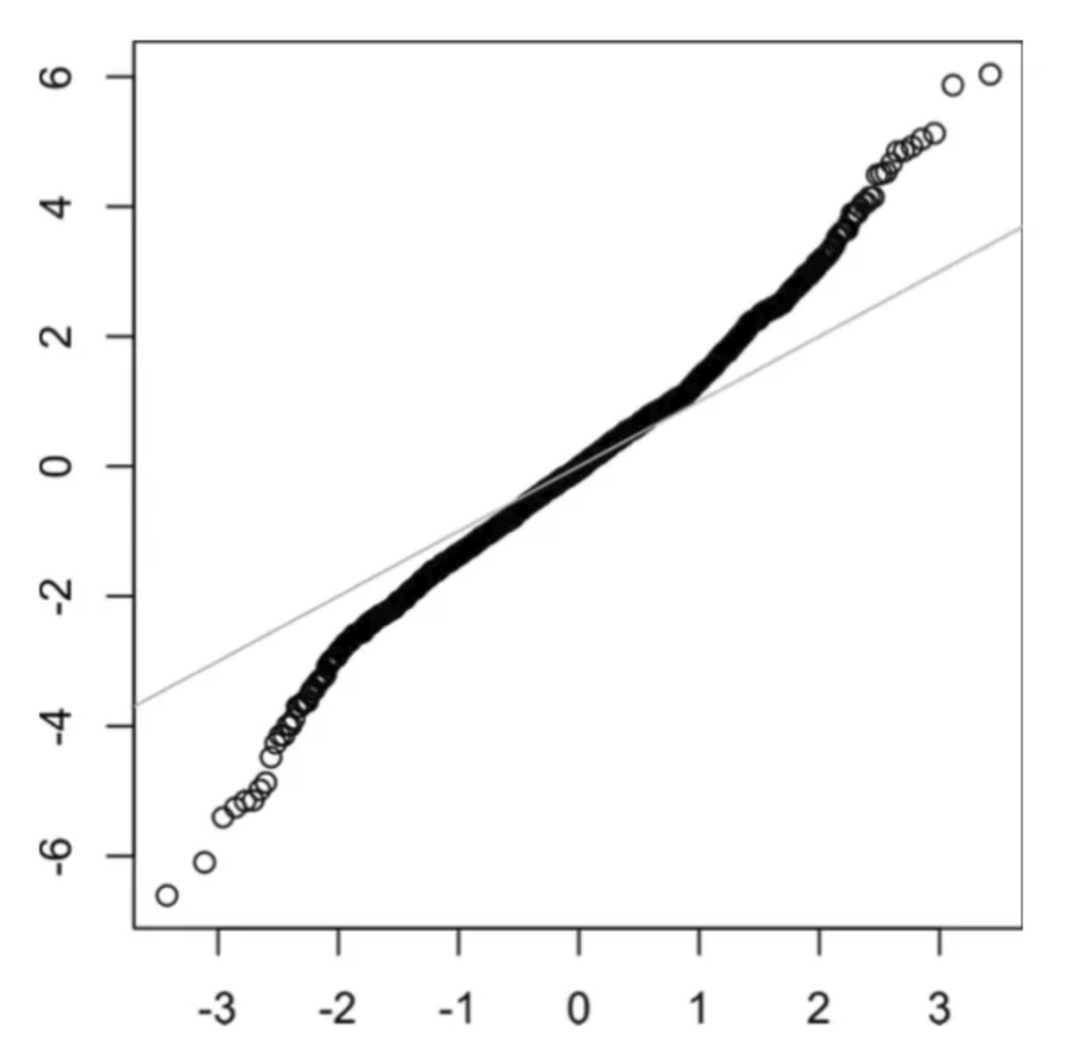
QQ 图
import numpy as np
import statsmodels.api as sm
points = np.random.normal(0, 1, 1000)
fig = sm.qqplot(points, line ='45')
plt.show()

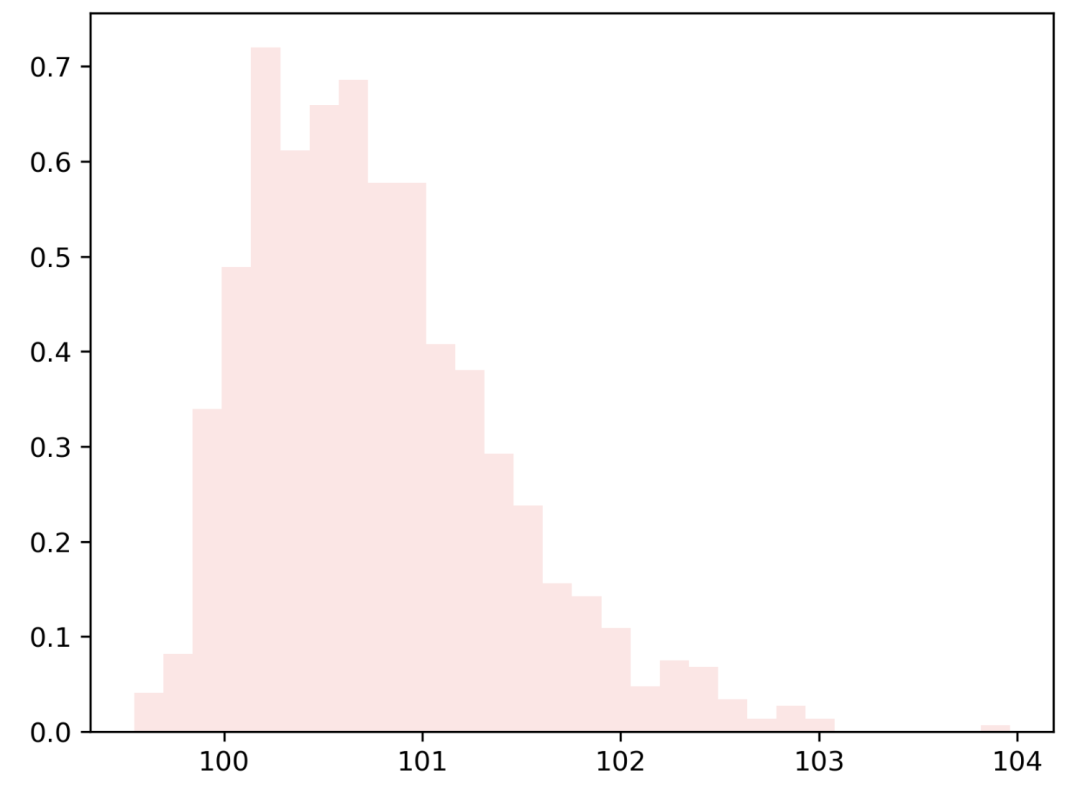
长尾分布
import matplotlib.pyplot as plt
from scipy.stats import skewnorm
def generate_skew_data(n: int, max_val: int, skewness: int):
  # Skewnorm function
  random = skewnorm.rvs(a = skewness,loc=max_val, size=n)
  plt.hist(random,30,density=True, color = 'red', alpha=0.1)
  plt.show()

generate_skew_data(1000, 100, -5) # negative (-5)-> 左偏分布

generate_skew_data(1000, 100, 5) # positive (5)-> 右偏分布
对数正态分布
import numpy as np
import matplotlib.pyplot as plt
from scipy import stats
X = np.linspace(0, 6, 1500)
std = 1
mean = 0
lognorm_distribution = stats.lognorm([std], loc=mean)
lognorm_distribution_pdf = lognorm_distribution.pdf(X)
fig, ax = plt.subplots(figsize=(8, 5))
plt.plot(X, lognorm_distribution_pdf, label="μ=0, σ=1")
ax.set_xticks(np.arange(min(X), max(X)))
plt.title("Lognormal Distribution")
plt.legend()plt.show()
指数分布
from scipy.stats import expon
import matplotlib.pyplot as plt
x = expon.rvs(scale=2, size=10000) # 2 calls
# 绘图
plt.hist(x, density=True, edgecolor='black')
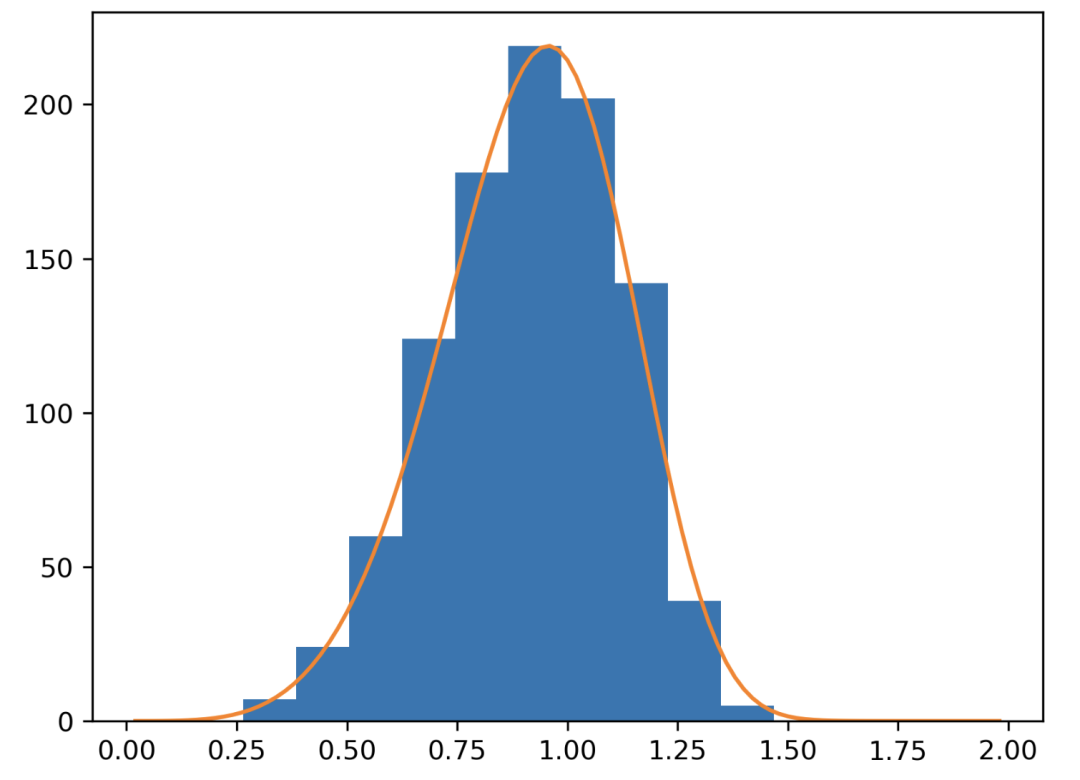
韦伯分布
import matplotlib.pyplot as plt
x = np.arange(1,100.)/50.
def weib(x,n,a):
  return (a / n) * (x / n)**(a - 1) * np.exp(-(x / n)**a)

count, bins, ignored = plt.hist(np.random.weibull(5.,1000))
x = np.arange(1,100.)/50.
scale = count.max()/weib(x, 1., 5.).max()
plt.plot(x, weib(x, 1., 5.)*scale)
plt.show()
Gamma 分布
import numpy as np
import scipy.stats as stats
import matplotlib.pyplot as plt
#Gamma distributions
x = np.linspace(0, 60, 1000)
y1 = stats.gamma.pdf(x, a=5, scale=3)
y2 = stats.gamma.pdf(x, a=2, scale=5)
y3 = stats.gamma.pdf(x, a=4, scale=2)
# plots
plt.plot(x, y1, label='shape=5, scale=3')
plt.plot(x, y2, label='shape=2, scale=5')
plt.plot(x, y3, label='shape=4, scale=2')
#add legend
plt.legend()
#display
plotplt.show()

Gamma 分布
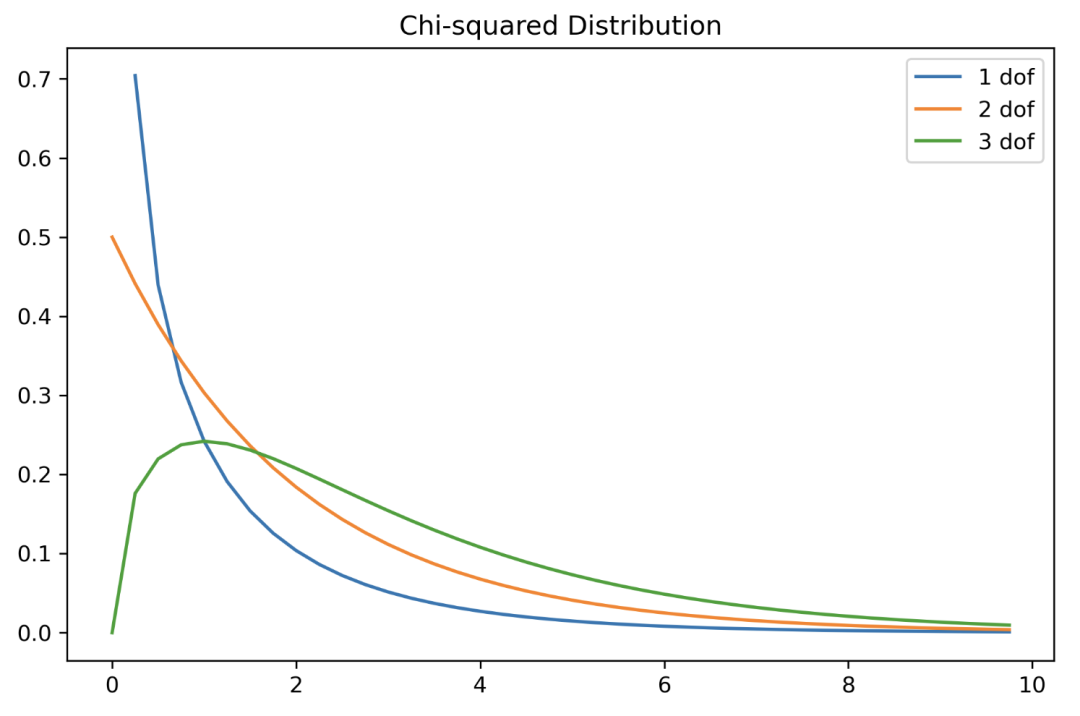
# x轴范围0-10,步长0.25
X = np.arange(0, 10, 0.25)
plt.subplots(figsize=(8, 5))
plt.plot(X, stats.chi2.pdf(X, df=1), label="1 dof")
plt.plot(X, stats.chi2.pdf(X, df=2), label="2 dof")
plt.plot(X, stats.chi2.pdf(X, df=3), label="3 dof")
plt.title("Chi-squared Distribution")
plt.legend()
plt.show()
中心极限定理
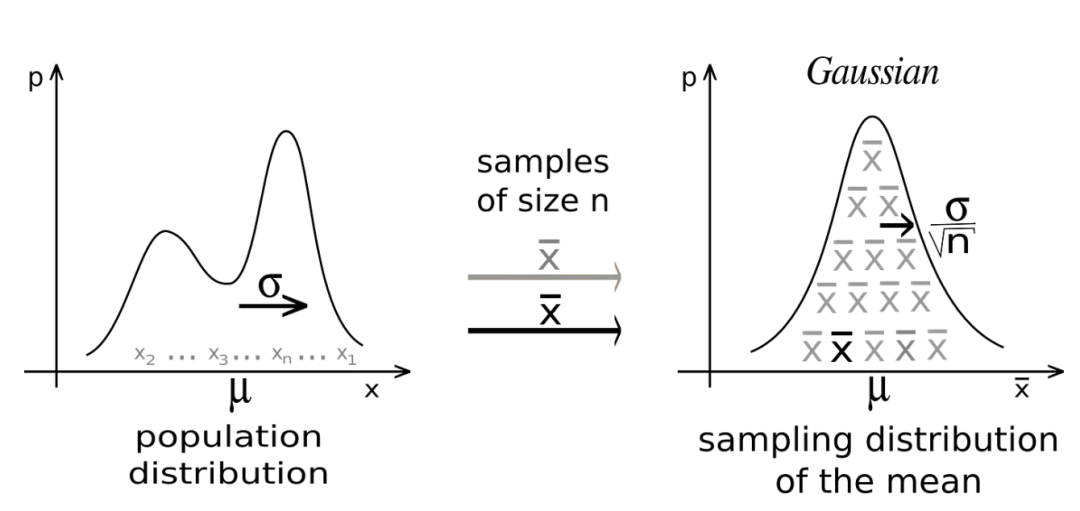
我们可以从任何分布(离散或连续)开始,从人群中收集样本并记录这些样本的平均值。随着我们继续采样,我们会注意到平均值的分布正在慢慢形成正态分布。
文章来源:https://awstip.com/statistical-probability-distributions-89398c4b68c7。
转自:我得学诚
