3种时间序列混合建模方法的效果对比和代码实现

来源:DeepHub IMBA 本文约2700字,建议阅读9分钟
本文中将讨论如何建立一个有效的混合预测器,并对常见混合方式进行对比和分析。
基础知识
series = trend + seasons + cycles + error首先,学习趋势并将其从原始序列中减去,得到残差序列; 其次,从去趋势的残差中学习季节性并减去季节; 最后,学习周期并减去周期。
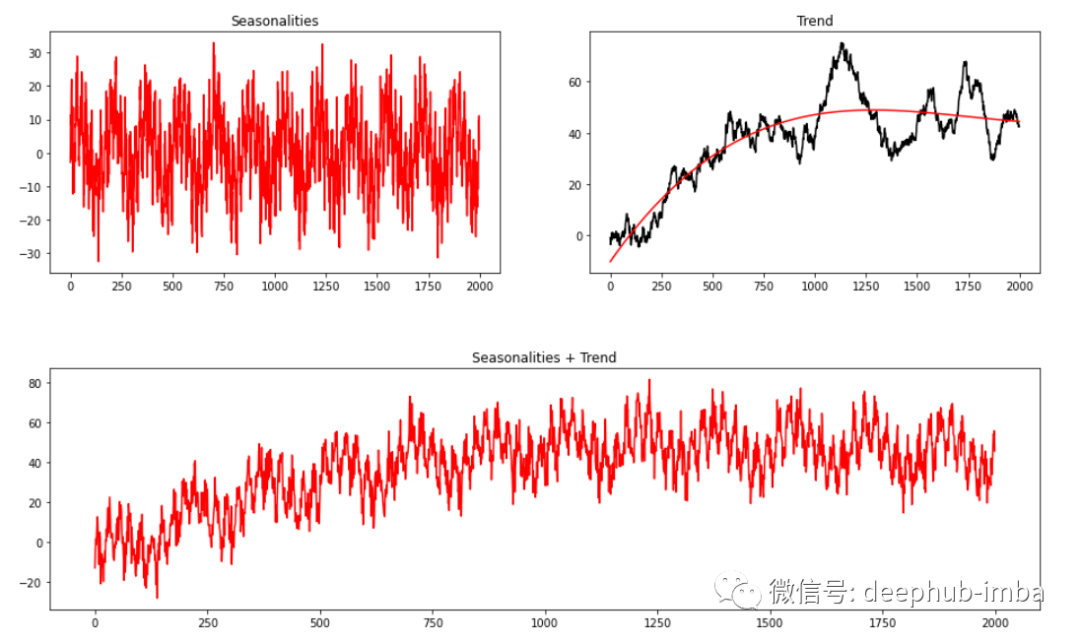
np.random.seed(1234)seas1 = gen_sinusoidal(timesteps=timesteps, amp=10, freq=24, noise=4)seas2 = gen_sinusoidal(timesteps=timesteps, amp=10, freq=24*7, noise=4)rw = gen_randomwalk(timesteps=timesteps, noise=1)X = np.linspace(0,10, timesteps).reshape(-1,1)X = np.power(X, [1,2,3])m = LinearRegression()trend = m.fit(X, rw).predict(X)plt.figure(figsize=(16,4))plt.subplot(121)plt.plot(seas1 + seas2, c='red'); plt.title('Seasonalities')plt.subplot(122)plt.plot(rw, c='black'); plt.plot(trend, c='red'); plt.title('Trend')plt.figure(figsize=(16,4))plt.plot(seas1 + seas2 + trend, c='red'); plt.title('Seasonalities + Trend')
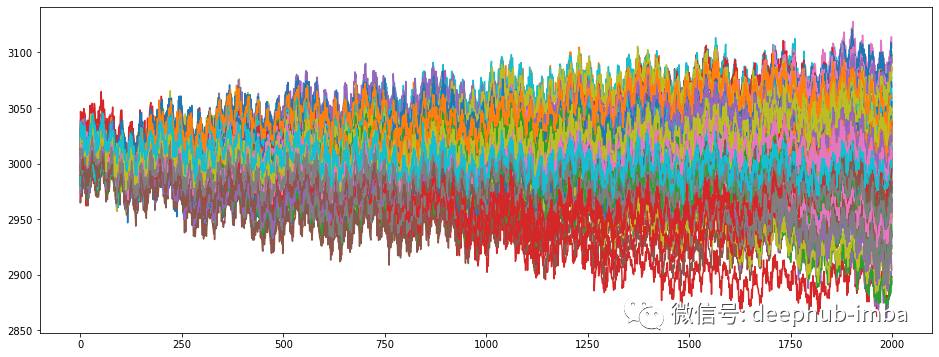
df.plot(legend=False, figsize=(16,6))
实验方法
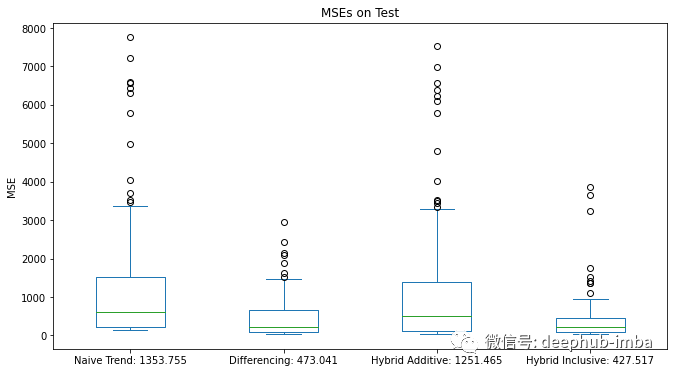
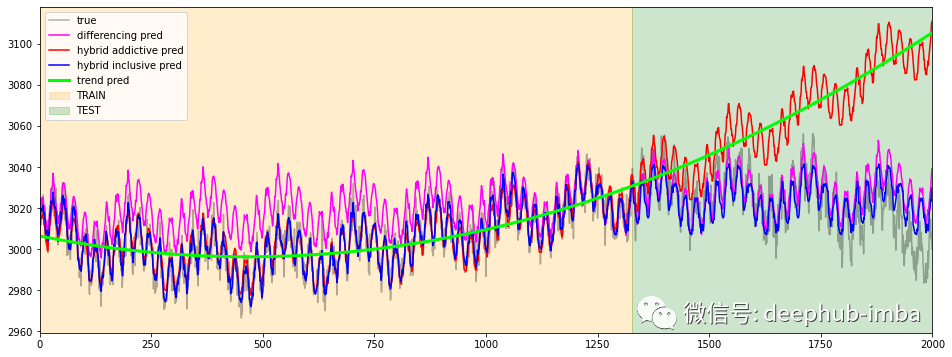
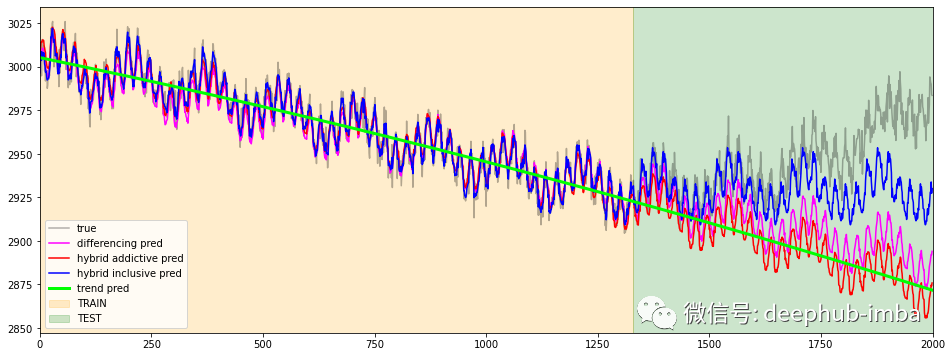
拟合一个简单的线性模型; differencing:使用差分变换,使目标变得稳定; hybrid additive:拟合具有最优的线性模型推断趋势。然后用梯度提升对去趋势序列进行建模; hybrid inclusive.:拟合梯度提升,包括外推趋势(获得拟合具有最优线性模型拟合的趋势)作为特征。
结果
### 训练过程略,请查看最后的完整源代码 ###scores = pd.DataFrame({f'{score_naive}': mse_naive,f'{score_diff}': mse_diff,f'{score_hybrid_add}': mse_hybrid_add,f'{score_hybrid_incl}': mse_hybrid_incl})scores.plot.box(figsize=(11,6), title='MSEs on Test', ylabel='MSE')
c = 'ts_11'df[c].plot(figsize=(16,6), label='true', alpha=0.3, c='black')df_diff[c].plot(figsize=(16,6), label='differencing pred', c='magenta')df_hybrid_add[c].plot(figsize=(16,6), label='hybrid addictive pred', c='red')df_hybrid_incl[c].plot(figsize=(16,6), label='hybrid inclusive pred', c='blue')df_naive[c].plot(figsize=(16,6), label='trend pred', c='lime', linewidth=3)plt.xlim(0, timesteps)plt.axvspan(0, timesteps-test_mask.sum(), alpha=0.2, color='orange', label='TRAIN')plt.axvspan(timesteps-test_mask.sum(), timesteps, alpha=0.2, color='green', label='TEST')plt.legend()
c = 'ts_33'df[c].plot(figsize=(16,6), label='true', alpha=0.3, c='black')df_diff[c].plot(figsize=(16,6), label='differencing pred', c='magenta')df_hybrid_add[c].plot(figsize=(16,6), label='hybrid addictive pred', c='red')df_hybrid_incl[c].plot(figsize=(16,6), label='hybrid inclusive pred', c='blue')df_naive[c].plot(figsize=(16,6), label='trend pred', c='lime', linewidth=3)plt.xlim(0, timesteps)plt.axvspan(0, timesteps-test_mask.sum(), alpha=0.2, color='orange', label='TRAIN')plt.axvspan(timesteps-test_mask.sum(), timesteps, alpha=0.2, color='green', label='TEST')plt.legend()
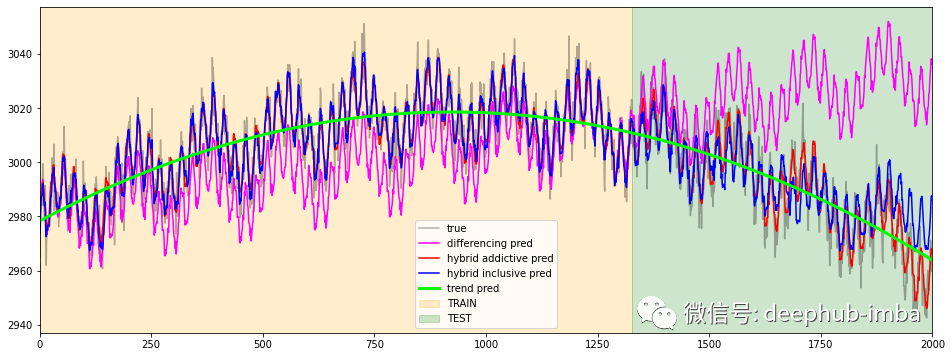
c = 'ts_73'df[c].plot(figsize=(16,6), label='true', alpha=0.3, c='black')df_diff[c].plot(figsize=(16,6), label='differencing pred', c='magenta')df_hybrid_add[c].plot(figsize=(16,6), label='hybrid addictive pred', c='red')df_hybrid_incl[c].plot(figsize=(16,6), label='hybrid inclusive pred', c='blue')df_naive[c].plot(figsize=(16,6), label='trend pred', c='lime', linewidth=3)plt.xlim(0, timesteps)plt.axvspan(0, timesteps-test_mask.sum(), alpha=0.2, color='orange', label='TRAIN')plt.axvspan(timesteps-test_mask.sum(), timesteps, alpha=0.2, color='green', label='TEST')plt.legend()
总结
最后,本文的完整代码在这里:
https://github.com/cerlymarco/MEDIUM_NoteBook/tree/master/Hybrid_Trees_Forecasting
作者:Marco Cerliani
评论

